


Introduction
Facial expression of emotions plays a central role in human communication. Individuals with high social anxiety are hypersensitive to the facial reactions of others and frequently feel discomfort during face-to-face interpersonal contact. Averting one's gaze from salient facial features, particularly from the eyes, is a common attentional strategy adopted by socially anxious subjects to avoid excessive anxiety during social interaction (Bogels & Mansell, Reference Bogels and Mansell2004). This avoidance behavior is frequently evident upon clinical examination (Greist, Reference Greist1995) and during objective experimental measurements (Horley et al. Reference Horley, Williams, Gonsalvez and Gordon2004; Garner et al. Reference Garner, Mogg and Bradley2006).
The normal brain response during face perception involves a widely distributed neural system. Areas most consistently activated in functional imaging studies are the visual cortex, fusiform gyrus, amygdala and prefrontal cortex (Sergent et al. Reference Sergent, Ohta and MacDonald1992; Haxby et al. Reference Haxby, Hoffman and Gobbini2000; Ishai et al. Reference Ishai, Schmidt and Boesiger2005). The fusiform gyrus contains the functionally defined ‘fusiform face area’ (Kanwisher et al. Reference Kanwisher, McDermott and Chun1997) that has a crucial role in face identification and is thought to act as a feedforward modulator of amygdala activation (Fairhall & Ishai, Reference Fairhall and Ishai2007). Of note, this recent functional magnetic resonance imaging (fMRI) study using effective connectivity analysis showed greater coupling between the fusiform gyrus and amygdala specifically when face stimuli expressed emotions (Fairhall & Ishai, Reference Fairhall and Ishai2007). However, these two brain regions are known to be mutually influential, as the amygdala can act as a feedback or re-entrant modulator of fusiform gyrus activity (Vuilleumier et al. Reference Vuilleumier, Richardson, Armony, Driver and Dolan2004). Overall, brain responses to face stimuli are bilateral, although a stronger activation in right extrastriate visual areas is often reported (Sergent et al. Reference Sergent, Ohta and MacDonald1992; Kanwisher et al. Reference Kanwisher, McDermott and Chun1997; Rossion et al. Reference Rossion, Dricot, Devolder, Bodart, Crommelinck, De Gelder and Zoontjes2000; Ishai et al. Reference Ishai, Schmidt and Boesiger2005). Neuropsychological lesion research also supports right-hemisphere dominance for face processing (for a review see Sorger et al. Reference Sorger, Goebel, Schiltz and Rossion2007).
Functional imaging studies of emotional face perception have shown increased amygdala activation in anxiety-prone subjects (Rauch et al. Reference Rauch, Whalen, Shin, McInerney, Macklin, Lasko, Orr and Pitman2000; Hariri et al. Reference Hariri, Mattay, Tessitore, Kolachana, Fera, Goldman, Egan and Weinberger2002; Stein et al. Reference Stein, Simmons, Feinstein and Paulus2007b) and patients with social anxiety disorders (Stein et al. Reference Stein, Goldin, Sareen, Zorrilla and Brown2002; Veit et al. Reference Veit, Flor, Erb, Hermann, Lotze, Grodd and Birbaumer2002; Straube et al. Reference Straube, Kolassa, Glauer, Mentzel and Miltner2004, Reference Straube, Mentzel and Miltner2005; Phan et al. Reference Phan, Fitzgerald, Nathan and Tancer2006; Yoon et al. Reference Yoon, Fitzgerald, Angstadt, McCarron and Phan2007). However, this increase in activation may depend on precise task conditions (Straube et al. Reference Straube, Kolassa, Glauer, Mentzel and Miltner2004), may be relatively modest in effect size (Cooney et al. Reference Cooney, Atlas, Joormann, Eugene and Gotlib2006; Yoon et al. Reference Yoon, Fitzgerald, Angstadt, McCarron and Phan2007) and may not be sustained throughout assessment (Campbell et al. Reference Campbell, Sareen, Paulus, Goldin, Stein and Reiss2007). These findings suggest that different factors can modulate amygdala activation.
Unlike the amygdala, fusiform gyrus activity in anxious subjects during emotional face processing has not been assessed comprehensively. Existing data indicate that non-enhanced fusiform gyrus activity may be present together with a heightened amygdala response in both anxiety-prone subjects and generalized social phobia (Campbell et al. Reference Campbell, Sareen, Paulus, Goldin, Stein and Reiss2007; Stein et al. Reference Stein, Simmons, Feinstein and Paulus2007b), although increased fusiform gyrus activation has also been reported in patients (Straube et al. Reference Straube, Kolassa, Glauer, Mentzel and Miltner2004). Nevertheless, it is currently unclear to what extent fusiform gyrus activity influences amygdala reactivity to emotional faces in socially anxious individuals.
In the current study we assessed whether a relevant effect exists between fusiform gyrus activation and amygdala response to emotional faces in the non-clinical range of social anxiety. Epidemiological surveys suggest that social anxiety exists on a continuum of severity with a greater number of feared situations associated with greater disability (Stein et al. Reference Stein, Torgrud and Walker2000). Most individuals with social anxiety symptoms, however, do not meet full diagnostic criteria (Furmark et al. Reference Furmark, Tillfors, Everz, Marteinsdottir, Gefvert and Fredrikson1999), although they may suffer from the condition in specific situations and may be at risk to develop a later disorder (Stein et al. Reference Stein, Torgrud and Walker2000; Stein & Stein, Reference Stein and Stein2008).
Specifically, we used fMRI to examine brain activity during an emotional face assessment task (Paulus et al. Reference Paulus, Feinstein, Castillo, Simmons and Stein2005) in a group of healthy individuals with a wide range of scores in measured social anxiety. By using this dimensional approach, we were able to map the correlation between subjects' social anxiety scores and amygdala activation, before and after controlling for fusiform gyrus activation in a covariance analysis. Our interest was in testing whether the expected positive relationship between social anxiety and amygdala activation is modulated by relatively attenuated fusiform gyrus activation in this population.
Method
Subjects
Volunteers were recruited to make up a series of 24 subjects on the basis of their score on the Liebowitz Social Anxiety Scale (LSAS; Liebowitz, Reference Liebowitz1987), which is sensitive in identifying clinical cases (Mennin et al. Reference Mennin, Fresco, Heimberg, Schneier, Davies and Liebowitz2002) and in quantifying the level of social anxiety in normal populations (Zubeidat et al. Reference Zubeidat, Salinas and Sierra2008). Study screening was carried out by self-report in the environment of Barcelona University and Barcelona Autonomous University and involved initial assessment of 146 individuals. Our sample was selected from this data pool to uniformly cover the range of social anxiety scores in normal subjects. Supplementary Fig. 1 (available online) shows the frequency histogram of social anxiety scores in the selected series, which ranged from 11 to 61 points. As a reference, patients with generalized social anxiety usually score above 60 points on this scale, whereas the range 30–60 points includes individuals with subclinical generalized social anxiety and specific social phobias (Mennin et al. Reference Mennin, Fresco, Heimberg, Schneier, Davies and Liebowitz2002). Each subject underwent the Structured Clinical Interview for DSM-IV (SCID) non-patient version (First et al. Reference First, Spitzer, Gibbon and Williams2007), which was administered by a senior psychiatrist (N.C.). This was done to systematically rule out the diagnosis of clinical social anxiety disorder (SAD) according to operative criteria. In the selected sample, no subject met DSM-IV criteria for social phobia and no subject was seeking medical assistance due to social anxiety complaints.
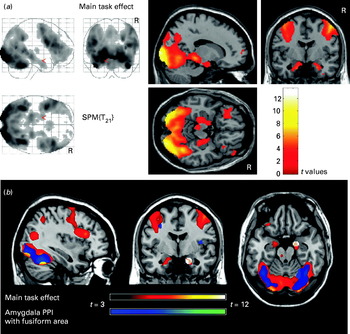
Fig. 1. (a) Statistical Parametric Mapping (SPM) of a group-level voxel-wise comparison between matching emotional faces (happy and fearful) and control shape condition. Activations are thresholded at p<0.05 False Discovery Rate (FDR) corrected (whole brain). The color bar represents t scores. R indicates the right hemisphere. (b) Results from the psychophysiological interaction (PPI) analysis assessing functional connectivity between the amygdala (source region, white circles) and fusiform gyrus [target region of interest (ROI): right fusiform gyrus (40, −50, −13), z score=3.52, t value=4.27, small volume correction p FDR=0.003].
Subjects with relevant medical or neurological disorder, substance abuse or psychiatric disease were not considered for inclusion. Two men were excluded, one through failure to complete the fMRI session and another due to excessive head movement during scanning. The final sample was made up of 22 subjects, all with normal or corrected-to-normal visual function. The characteristics of the group are reported in Table 1, which includes the following additional assessments: The Edinburgh Handedness Inventory (Oldfield, Reference Oldfield1971), the Vocabulary subscale of the Wechsler Adult Intelligence Scale – Revised (WAIS-R; Wechsler, Reference Wechsler1981), the Beck Anxiety and Depression Inventories, the Spielberger State-Trait Anxiety Inventory (STAI; Speilberger, Reference Speilberger1983), the Cloninger Temperament and Character Inventory – Revised (TCI-R Spanish version; Gutierrez-Zotes et al. Reference Gutierrez-Zotes, Bayon, Montserrat, Valero, Labad, Cloninger and Fernandez-Aranda2004), and the Sensitivity to Punishment and Sensitivity to Reward Questionnaire (SPSRQ; Torrubia et al. Reference Torrubia, Avila, Molto and Caseras2001). The latter served to expand our assessment of the major temperament dimensions. It is relevant to mention that our subjects showed relatively low scores in the Spielberger Anxiety Inventory (Table 1), which suggests that anxiety measured by the LSAS was strongly related to social context. After complete description of the study to the subjects, written informed consent was obtained. The study was approved by local research and ethics committees.
Table 1. Mean (s.d.) characteristics of the study sample (n=22)

WAIS-R, Wechsler Adult Intelligence Scale-Revised; TCI, Temperament and Character Inventory; SPSRS, Sensitivity to Punishment and Sensitivity to Reward Questionnaire; s.d., standard deviation.
Emotion face assessment task
Subjects were assessed using a slightly modified version of the emotional face-processing task developed by Hariri et al. (Reference Hariri, Mattay, Tessitore, Kolachana, Fera, Goldman, Egan and Weinberger2002). With the exception of an ‘angry-face’ stimulus condition (excluded here), our task was identical to the paradigm described in Paulus et al. (Reference Paulus, Feinstein, Castillo, Simmons and Stein2005). During each 5-s trial, subjects were presented with a target face (center top) and two probe faces (bottom left and right) and were instructed to match the probe expressing the same emotion to the target by pressing a button in either their left or their right hand. A block consisted of six consecutive trials in which the target face was either happy or fearful, and the probe faces included two out of three possible emotional faces (happy, fearful and angry). During the control (shape) condition, subjects were presented with 5-s trials of ovals or circles in an analogous configuration and were instructed to match the shape of the probe to the target. A total of six 30-s blocks of faces (three happy and three fearful) and six 30-s blocks of the control condition were presented interleaved in a pseudo-randomized order. A fixation cross was interspersed between each block. For each trial, response accuracy and response latency (reaction time) were obtained.
The paradigm was presented visually on a laptop computer running Presentation software (www.neurobehavioralsystems.com). MRI-compatible high-resolution goggles (VisuaStim Digital System, Resonance Technology Inc., Northridge, CA, USA) were used to display the stimuli. Subjects' responses were registered using a right- and a left-hand response device based on optical fiber transmission (Nordic Neuro Laboratories, Bergen, Norway).
fMRI acquisition
A 1.5-T Signa Excite system (General Electric, Milwaukee, WI, USA) equipped with an eight-channel phased-array head coil and single-shot echoplanar imaging (EPI) software was used. Functional sequences consisted of gradient recalled acquisition in the steady state [time of repetition (TR) 2000 ms; time of echo (TE) 50 ms; pulse angle 90°] within a field of view of 24 cm, with a 64×64-pixel matrix, and with a slice thickness of 4 mm (interslice gap 1 mm). Twenty-two interleaved slices, parallel to the anterior–posterior commissure line, were acquired to cover the whole brain. The functional time series consisted of 270 consecutive image sets obtained over 9 min.
An anatomical three-dimensional (3-D) fast spoiled gradient (SPGR) inversion-recuperation prepared sequence with 130 contiguous slices (TR 11.8 ms; TE 4.2 ms; flip angle 15°; field of view 30 cm; acquisition matrix 256×256 pixels; slice thickness 1.2 mm) was also acquired for each individual.
Image processing and statistical analysis
A Microsoft Windows platform running MATLAB version 6.5 (The MathWorks Inc., Natick, MA, USA) and Statistical Parametric Mapping software (SPM5; The Wellcome Department of Imaging Neuroscience, London, UK) was used. Image preprocessing involved motion correction, spatial normalization and smoothing using a Gaussian filter (full-width, half-maximum, 8 mm). Data were normalized to the standard SPM-EPI template and resliced to 2 mm isotropic resolution in Montreal Neurological Institute (MNI) space. High-quality functional images were obtained in all cases, except for one excluded subject showing motion exceeding 2 mm in z-axis translation.
Analyses of main task effects
First-level (single-subject) SPM contrast-images were estimated for the following five task effects of interest; (1) faces>shapes; (2) fearful>shapes; (3) happy>shapes; (4) fearful>happy; (5) happy>fearful. For these analyses, the blood oxygen level-dependent (BOLD) response at each voxel was modeled using a canonical hemodynamic response function and its temporal derivative (using a 128-s high-pass filter). The resulting first-level contrast images for each subject were then carried forward to second-level random-effects (group) analyses using one-sample t tests. The resulting group SPMs (t-statistic images) were thresholded at p<0.05 [False Discovery Rate (FDR) corrected] to display the whole pattern of activated regions.
Spatial coordinates from the four maps obtained were then converted to standard Talairach coordinates (Talairach & Tournoux, Reference Talairach and Tournoux1988) using a nonlinear transform of SPM standard space to Talairach space (Brett, Reference Brett2007). As this transform does not totally adapt coordinates between both systems (Lancaster et al. Reference Lancaster, Tordesillas-Gutierrez, Martinez, Salinas, Evans, Zilles, Mazziotta and Fox2007), further adjustment was required for the z axis at the fusiform gyrus region. This coordinate was adjusted for each individual using the acquired 3-D anatomical sequence, and the mean value from this individual adjustment served to correct group z coordinates of fusiform gyrus activations.
Psychophysiological interaction (PPI) analysis
To assess functional connectivity between activated brain regions during the task, we performed a PPI analysis (Friston et al. Reference Friston, Buechel, Fink, Morris, Rolls and Dolan1997). In this analysis, the fMRI signal time courses of all voxels throughout the brain were regressed onto the activity of the right amygdala, as our source region of interest (ROI). The interaction between the experimental paradigm and the time course of amygdala activity allowed us to identify those regions showing significantly increased functional connectivity with this region during emotional face processing (face condition) compared to baseline (shape condition). A complete description of this procedure is provided as Supplementary data (available online).
Amygdala correlation maps with LSAS scores
We mapped voxel-wise correlations between subjects' LSAS scores and amygdala activation during the emotional face assessment task. Separate correlation maps were obtained for the happy (happy>shapes) and fearful (fearful>shapes) conditions. To assess the influence of the fusiform gyrus on amygdala responsiveness, the correlation maps were repeated after controlling for a representative measurement of fusiform gyrus activation in a covariance analysis (i.e. fusiform gyrus activation was introduced in the model as a regressor). This measurement was extracted using 5-mm-radius ROIs centered at the peak location of fusiform activation for each contrast detailed in the group analyses of main task effects. Peak fusiform gyrus activation during this task corresponds to the functionally defined ‘fusiform face area’ (Kanwisher et al. Reference Kanwisher, McDermott and Chun1997). The MarsBaR ROI toolbox (Brett et al. Reference Brett, Anton, Valabregue and Poline2002) was used in this procedure. The effect of both right (primary analysis owing its dominant role for face processing; Sorger et al. Reference Sorger, Goebel, Schiltz and Rossion2007) and left fusiform gyrus were evaluated. Our ROI was defined bilaterally using automated WFU_PickAtlas (Lancaster et al. Reference Lancaster, Woldorff, Parsons, Liotti, Freitas, Rainey, Kochunov, Nickerson, Mikiten and Fox2000; Maldjian et al. Reference Maldjian, Laurienti, Kraft and Burdette2003) and included the amygdalar nucleus and its cortical extension. The resulting correlation maps were then thresholded to compare with several previous studies (Paulus et al. Reference Paulus, Feinstein, Castillo, Simmons and Stein2005; Stein et al. Reference Stein, Simmons, Feinstein and Paulus2007b). In these studies, this threshold was determined by simulations showing that a voxel-wise a priori probability of 0.05 would result in a corrected cluster-wise activation probability of 0.05 if a minimum volume of 128 μl and two connected voxels were considered.
Additional statistical analyses included the paired Student's t test to compare subjects' performance (response latency between fearful and happy conditions) during fMRI assessment, and Pearson's correlations to test the relationship between task performance and social anxiety scores and between the behavioral scales and representative measurements of brain activation.
Results
Behavioral performance during scanning
Overall task accuracy was very high, with subjects making on average only 1.1 (1.5%) errors (s.d.=1.3; range 0 to 5 errors) during the entire paradigm. Group mean reaction time for matching happy faces was 1079±207 ms, and for fearful faces 1505±307 ms. The response time difference between both emotional face types was significant. Subjects were 426 ms (s.d.=188 ms) slower in matching fearful faces (t=10.6, df=21, p<0.00001, paired Student's t test). Subjects with higher LSAS scores showed a general tendency for slower reaction times when matching faces (r=0.38, df=21, p=0.083 for happy faces; r=0.34, df=21, p=0.125 for fearful faces). Among the other behavioral scales, only Spielberger's State Anxiety Inventory scores showed a tendency for slower reaction times in the fearful condition (r=0.37, df=21, p=0.090).
Mapping brain response to emotional faces (main task effect)
Group-level voxel-wise comparison between matching emotional faces (happy and fearful) and control shape condition revealed significant bilateral activation in the visual cortex, fusiform gyrus, amygdala and prefrontal cortex (Fig. 1, Table 2). Specific analyses for happy and fearful face conditions showed similar patterns involving in both cases the four functionally relevant regions bilaterally. Matching fearful faces, however, showed greater activation relative to happy faces in the fusiform gyrus and the middle frontal gyrus bilaterally (Table 2). We did not find any differences in amygdala activation for this contrast.
Table 2. Mean group brain response to emotional faces at peak activation

R, Right; L, left. All contrasts show p<0.05 [False Discovery Rate (FDR) corrected] except right and left amygdala for happy (*), which showed p=0.002 and p=0.001 (uncorrected) respectively. The contrast Happy>Fearful did not produce significant results.
The PPI analysis, which assessed functional connectivity between activated regions during the task, showed that emotional face stimulation (relative to shape condition) significantly and specifically increased connectivity between the amygdala and the fusiform gyrus (Fig. 1b).
Correlations of brain activation with LSAS scores and behavioral variables
The primary analysis involved estimating Pearson's correlation of the LSAS scores with representative functional measurements of each activated region. Our interest was in testing whether a positive relationship exists between social anxiety and amygdala activation and a negative relationship with fusiform gyrus activation. We found that subjects' LSAS scores were not primarily related to amygdala functional changes at peak activation, and no region showed a positive correlation with LSAS scores (ST1). The fusiform gyrus, however, showed a negative correlation with scores in this scale, particularly in the right hemisphere and during the fearful condition (r=−0.47, df=21, p=0.029). For the happy condition, the correlation was also negative but not significant (ST1).
The behavioral significance of peak amygdala and fusiform activation during the emotional face-processing task was explored further by assessing its relationship with additional behavioral variables related to anxiety and avoidance (Table 1). In this analysis, we did not obtain significant findings for the amygdala. By contrast, the right fusiform gyrus showed a highly specific correlation profile with behavioral measures. We found a negative correlation of right fusiform gyrus response to fearful faces with Harm Avoidance scores (r=−0.53, df=21, p=0.012) and with Sensitivity to Punishment (r=−0.74, df=21, p<0.001) but not with the other behavioral scales.
Amygdala correlation maps with LSAS scores
The above analysis indicates that peak amygdala response to emotional faces was not significantly related to social anxiety scores using simple correlations. To investigate whether activation in other amygdala areas was related to social anxiety, we mapped the amygdala region using voxel-wise correlation between LSAS scores and task activation. The mapping was conducted separately for both happy and fearful conditions, and for both the left and right amygdala. In no case did we find significant correlations in the ROIs using our reference threshold. That is, the correlation map did not show clusters greater than 128 μl with p<0.05, which may suggest greater amygdala response to emotional faces in subjects with higher LSAS scores.
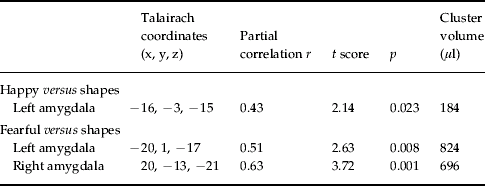
The analysis was then repeated after controlling for (regressing out) activation in the right fusiform gyrus. Fig. 2 shows amygdala areas with larger responses to emotional faces in subjects with higher LSAS scores after removing the effect of right fusiform gyrus activation (see also Table 3). A cluster greater than 128 μl with p<0.05 (the reference threshold) was identified for the happy condition in the left amygdala region. In the fearful condition, both the left and right amygdala showed significant correlations. The implicated area in the left side involved mainly the medial-cortical part of the amygdala, whereas the right area was observed more posteriorly and extended to the amygdala–hippocampus junction (Fig. 2). Supplementary Fig. 2 (online) illustrates these correlations with plots between LSAS scores and amygdala activation to fearful faces after controlling for right fusiform gyrus.
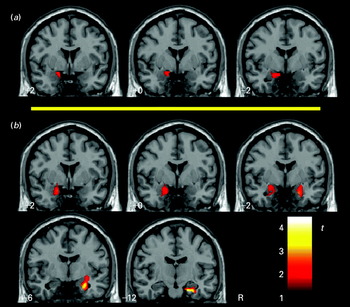
Fig. 2. Mapping the amygdala region using voxel-wise correlation between the Liebowitz Social Anxiety Scale (LSAS) scores and task activation after controlling for (regressing out) activation in the right fusiform gyrus: (a) correlations obtained for the happy condition; (b) correlations obtained for the fearful condition. Voxels above the reference threshold (cluster>128 μl with p<0.05) are displayed. The color bar represents t scores. R indicates the right hemisphere.
Table 3. Correlation of amygdala response to emotional faces with Liebowitz Social Anxiety Scale (LSAS) scores after controlling for right fusiform gyrus activation (df=20)
df, Degrees of freedom.
To test for specificity of the right fusiform gyrus effect, the correlation map was also conducted for both face conditions using the other brain regions involved in brain response to emotional faces (left fusiform gyrus and bilateral visual and prefrontal areas). Controlling for activation in these regions did not produce any changes in the correlation between amygdala activation and social anxiety scores in the fearful condition. By contrast, control for left fusiform gyrus activation reproduced the pattern observed when controlling for right fusiform gyrus activation in the happy condition. A cluster of 640 μl with p<0.05 was observed in the left amygdala region of the corresponding correlation map (Talairach coordinates at peak correlation x=−22, y=1, z=−20, t score=2.4, df=20, p=0.007).
The effect of task performance (reaction time for matching emotional faces) and sex (and age) was also tested in the above model. Inclusion of these variables in no case provided additional findings.
Discussion
We assessed the influence of fusiform gyrus activation on amygdala response to emotional faces in a sample of normal individuals showing a wide range of social anxiety scores using a dimensional approach. We observed that only after controlling for subjects' level of activation of the fusiform gyrus was there an association between social anxiety rating and activation of the amygdala. Specific analyses of facial expression type (happy or fearful) indicated that this association was more robust in combination with fearful stimuli.
Psychometric studies have revealed that socially anxious individuals often show a heightened attentional bias to alerting signals. This hypervigilant behavior can be balanced with an opposite tendency to avoid the threatening stimulus, which serves as a defensive function (Bogels & Mansell, Reference Bogels and Mansell2004). In our study, actual amygdala response to emotional faces may reflect one outcome of this vigilance/avoidance balance, showing reduced correlation with social anxiety as a result of fusiform gyrus modulation. Thus, after controlling for this influence of the fusiform gyrus, amygdala activation may reflect the bias towards increased vigilance. Clearly, this is an oversimplified interpretation, as the interaction between both brain regions during emotional face processing is likely to be more complex, as discussed below.
Our findings are consistent with the model of face processing described by Haxby et al. (Reference Haxby, Hoffman and Gobbini2000) and with a recent study that combined fMRI with an effective connectivity analysis (Fairhall & Ishai, Reference Fairhall and Ishai2007). The neural system that processes faces is organized overall in a hierarchical and feedforward manner with a visual cortex influence on the fusiform face area and, in turn, this area on the amygdala. The fusiform face area has a dominant role in the cortical processing of faces (Fairhall & Ishai, Reference Fairhall and Ishai2007). Nevertheless, there is also evidence for an early amygdalar influence on conscious visual processing of faces through a fast subcortical (pulvinar–amygdala–visual cortex) pathway that may operate even with subliminal face presentation (Morris et al. Reference Morris, Ohman and Dolan1999; Phillips et al. Reference Phillips, Drevets, Rauch and Lane2003; Adolphs & Spezio, Reference Adolphs and Spezio2006). Moreover, other studies suggest that amygdala response to emotional faces may be modulated further through top-down mechanisms, for example from distant frontal areas (Hariri et al. Reference Hariri, Bookheimer and Mazziotta2000; Stein et al. Reference Stein, Wiedholz, Bassett, Weinberger, Zink, Mattay and Meyer-Lindenberg2007a). Reciprocal interactions may therefore occur among all the stages of emotional face processing.
Stein et al. (Reference Stein, Simmons, Feinstein and Paulus2007b) observed greater amygdala activation to emotional faces in non-clinical subjects with high trait anxiety and suggested the existence of a functional endophenotype for proneness to anxiety disorders. Our findings further support this notion and extend to social anxiety-prone subjects. In our case, however, the fusiform gyrus showed a relevant modulating effect.
Increased amygdala responsiveness to emotional face processing has been a typical finding in fMRI studies of social anxiety patients (Stein et al. Reference Stein, Goldin, Sareen, Zorrilla and Brown2002; Veit et al. Reference Veit, Flor, Erb, Hermann, Lotze, Grodd and Birbaumer2002; Straube et al. Reference Straube, Kolassa, Glauer, Mentzel and Miltner2004, Reference Straube, Mentzel and Miltner2005; Phan et al. Reference Phan, Fitzgerald, Nathan and Tancer2006; Yoon et al. Reference Yoon, Fitzgerald, Angstadt, McCarron and Phan2007). Nevertheless, it was not always obvious whether fusiform gyrus showed an abnormal activation, as few authors have specifically investigated fusiform gyrus activation in SAD. Fragile X syndrome shows relevant clinical overlap with SAD, including characteristic gaze avoidance behavior during social interaction. Consistent with our findings, an fMRI study reported that children with this disorder tended to show reduced right fusiform gyrus activation, particularly in response to ‘forward’ faces compared to ‘angled’ faces, with no increase in amygdala activation (Garrett et al. Reference Garrett, Menon, MacKenzie and Reiss2004). Specifically in social phobia, several studies did not find abnormal fusiform gyrus response to faces (Phan et al. Reference Phan, Fitzgerald, Nathan and Tancer2006; Campbell et al. Reference Campbell, Sareen, Paulus, Goldin, Stein and Reiss2007; Stein et al. Reference Stein, Simmons, Feinstein and Paulus2007b), whereas Straube et al. (Reference Straube, Kolassa, Glauer, Mentzel and Miltner2004) observed greater fusiform gyrus activation relative to control subjects for implicit, and not explicit, processing of angry faces. In another study, fusiform gyrus response to faces was larger in social phobic patients with high anxiety scores (Straube et al. Reference Straube, Mentzel and Miltner2005). Such data would seem to indicate that fusiform gyrus activation depends on symptom severity and the specific testing situation (i.e. implicit face processing may allow less avoidance strategies).
The observed negative correlations of right fusiform gyrus response to fearful faces with harm avoidance and sensitivity to punishment further suggest that activation in this region may express the temperamental tendency to avoidance behavior. It is noteworthy that only those dimensions measuring specific aspects of avoidance behavior were related to fusiform face area activation. Our study, however, was limited in that no eye-tracking system was used during fMRI, and thus the notion of visual avoidance strategies in these subjects remains speculative. In addition, we used a matching task that included three faces in the picture, which may impede the accurate assessment of face visual scanning.
Our findings suggest that fusiform gyrus activation shows a general effect on the amygdala response to both accepting (happy) and harsh (fearful) faces. Although the effect was more evident in the fearful condition, showing stronger correlations, predominantly in the right hemisphere, we did not obtain significant findings when comparing fearful and happy faces directly. Fear is generally contemplated as the emotion that most consistently activates the amygdala (Phan et al. Reference Phan, Wager, Taylor and Liberzon2002). Tillfors et al. (Reference Tillfors, Furmark, Marteinsdottir, Fischer, Pissiota, Langstrom and Fredrikson2001) observed, specifically in subjects with social phobia, an abnormal increase in right amygdala blood flow during public speaking that significantly correlated with the severity of fear experienced. We should emphasize, however, that the matching face paradigm adopted in our study is not intended to discriminate between the effects of different emotional expressions, as different emotions (target and probes) appear in each presented picture. Similarly, we did not control for the effect of neutral faces, which have been found to be related to state anxiety in normal subjects (Somerville et al. Reference Somerville, Kim, Johnstone, Alexander and Whalen2004) and to an abnormal pattern of amygdala activation in SAD (Birbaumer et al. Reference Birbaumer, Grodd, Diedrich, Klose, Erb, Lotze, Schneider, Weiss and Flor1998; Cooney et al. Reference Cooney, Atlas, Joormann, Eugene and Gotlib2006).
In conclusion, the results of this dimensional approach suggest that relevant interactions among the emotional face-processing stages exist in the non-clinical range of social anxiety, involving a modulatory effect of the fusiform face area on amygdala responses. Future research examining this relationship in generalized social anxiety and specific phobias will be of interest, particularly if it provides new biological markers for assessing symptom severity and potential treatment effects.
Acknowledgments
This study was supported in part by the Fondo de Investigación Sanitaria (FIS, Grant no. PI050884). Dr Harrison is supported by a National Health and Medical Research Council of Australia (NHMRC) Training Award (I.D. 400420). Dr Yücel is supported by a National Health and Medical Research Council (NHMRC) of Australia Program Grant (I.D. 350241). Dr Pujol thanks the contribution of the Networking Research Center on Bioengineering, Biomaterials and Nanomedicine (CIBER-BBN), Barcelona, Spain. Dr Ortiz is supported by the FPU grant AP2006-2869 from the Ministry of Education of Spain, and Dr López-Solà by the FPU grant AP2005-0408 from the Ministry of Education of Spain.
Declaration of Interest
None.
Note
Supplementary material accompanies this paper on the Journal's website (http://journals.cambridge.org).


