


Introduction
Schizoaffective bipolar disorder (SABP) is a mental illness characterized by manic and depressive episodes typical of bipolar disorder and psychotic symptoms observed in schizophrenia. SABP individuals have a distinctly poor prognosis compared to the wider bipolar phenotype (Harrow et al. Reference Harrow, Grossman, Herbener and Davies2000). A genome-wide association study provided strong genetic evidence for a selective influence of GABA-A receptor dysfunction in this subpopulation of bipolar individuals (Craddock et al. Reference Craddock, Jones, Jones, Kirov, Green, Grozeva, Moskvina, Nikolov, Hamshere, Vukcevic, Caesar, Gordon-Smith, Fraser, Russell, Norton, Breen, St Clair, Collier, Young, Ferrier, Farmer, McGuffin, Holmans, Donnelly, Owen and O'Donovan2010), which was recently independently replicated (Breuer et al. Reference Breuer, Hamshere, Strohmaier, Mattheisen, Degenhardt, Meier, Paul, O'Donovan, Muhleisen, Schulze, Nothen, Cichon, Craddock and Rietschel2011). Although these single nucleotide polymorphisms do not alter protein sequence, they may affect the expression levels of GABA-A receptor subunits, affecting the duration of inhibitory post-synaptic current onto pyramidal cells (Capogna & Pearce, Reference Capogna and Pearce2011).
These genetic findings in SABP add to the increasing evidence of an abnormal glutamatergic/GABAergic cortical balance in psychiatric disorders. Neuropathological evidence (Costa et al. Reference Costa, Davis, Dong, Grayson, Guidotti, Tremolizzo and Veldic2004; Lewis et al. Reference Lewis, Curley, Glausier and Volk2012) suggests that there is a cortical GABA deficit in both bipolar disorder and schizophrenia. Decreased levels of glutamic acid decarboxylase (GAD) 67 mRNA are consistently found in parvalbumin-positive interneurons, in multiple cortical regions in schizophrenia and mood disorders (Hashimoto et al. Reference Hashimoto, Volk, Eggan, Mirnics, Pierri, Sun, Sampson and Lewis2003; Thompson et al. Reference Thompson, Weickert, Wyatt and Webster2009; Gonzalez-Burgos et al. Reference Gonzalez-Burgos, Hashimoto and Lewis2010). Glutamate dysfunction, particularly involving the N-methyl-d-aspartate receptor (NMDAR) has also been implicated (Martucci et al. Reference Martucci, Wong, De Luca, Likhodi, Wong, King and Kennedy2006; Kirov et al. Reference Kirov, Pocklington, Holmans, Ivanov, Ikeda, Ruderfer, Moran, Chambert, Toncheva, Georgieva, Grozeva, Fjodorova, Wollerton, Rees, Nikolov, van de Lagemaat, Bayés, Fernandez, Olason, Böttcher, Komiyama, Collins, Choudhary, Stefansson, Stefansson, Grant, Purcell, Sklar, O'Donovan and Owen2012). It is possible that these abnormalities are compounded in the SABP phenotype, which manifests features of both disorders.
Converging evidence from both computational and animal models demonstrates that high frequency (30–80 Hz) cortical gamma oscillations depend on the excitatory-inhibitory activity generated between reciprocally connected glutamatergic and GABA interneuron cell assemblies (Bartos et al. Reference Bartos, Vida and Jonas2007; Buzsaki & Wang, Reference Buzsaki and Wang2012). Thus, one might expect gamma oscillations to be similarly perturbed in psychiatric disorder. Indeed, alterations in evoked and induced gamma band measures have been found in response to a variety of tasks in schizophrenia and bipolar disorder (O'Donnell et al. Reference O'Donnell, Hetrick, Vohs, Krishnan, Carroll and Shekhar2004; Spencer et al. Reference Spencer, Niznikiewicz, Nestor, Shenton and McCarley2009; Hall et al. Reference Hall, Spencer, Schulze, McDonald, Kalidindi, Kravariti, Kane, Murray, Bramon, Sham and Rijsdijk2011; Mulert et al. Reference Mulert, Kirsch, Pascual-Marqui, McCarley and Spencer2011; Ethridge et al. Reference Ethridge, Hamm, Shapiro, Summerfelt, Keedy, Stevens, Pearlson, Tamminga, Boutros, Sweeney, Keshavan, Thaker and Clementz2012; Liu et al. Reference Liu, Hsieh, Chen, Tu, Su and Chen2012). The majority of studies find a decrease in gamma oscillatory measures, including gamma power, frequency and phase locking. However, no differences (Uhlhaas et al. Reference Uhlhaas, Linden, Singer, Haenschel, Lindner, Maurer and Rodriguez2006) and increases (Riečanský et al. Reference Riečanský, Kašpárek, Rehulová, Katina and Přikryl2010) in gamma measures have also been reported.
Methods have been developed to induce gamma oscillations in the primary visual cortex of healthy individuals in response to visual gratings with a high degree of repeatability (Hoogenboom et al. Reference Hoogenboom, Schoffelen, Oostenveld, Parkes and Fries2006; Muthukumaraswamy et al. Reference Muthukumaraswamy, Singh, Swettenham and Jones2010). However, the link between GABA and gamma is unclear, depending on whether you look at disease, pharmaco-magnetoencephalography (MEG) or modelling. Positive correlations have been demonstrated between induced gamma frequency and occipital MRS GABA measures (Muthukumaraswamy et al. Reference Muthukumaraswamy, Edden, Jones, Swettenham and Singh2009). Thus, if a GABA deficit is present in SABP (as is implicated in clinical studies of schizophrenia and bipolar disorder), MRS GABA-gamma studies would predict that a GABA deficit would decrease gamma frequency. Pharmaco-MEG drug studies (alcohol and propofol) would suggest that enhancing GABA will boost gamma power (Saxena et al. Reference Saxena, Muthukumaraswamy, Diukova, Singh, Hall and Wise2013; Campbell et al. Reference Campbell, Sumner, Singh and Muthukumaraswamy2014) so a GABA deficit may well lead to a reduction in gamma power. Conversely, computational models of an NMDAR hypofunction (which may be relevant to the aetiology of SABP) (Spencer, Reference Spencer2009) would predict an increase in gamma power.
Therefore, in this study we measured gamma power and frequency in the visual cortex of SABP individuals and healthy controls to shed light on these contradictions.
Materials and method
Participants
Fifteen SABP individuals and 22 healthy control (HC) individuals participated in the study. The study was approved by the National Research Ethics Service (England and Wales) and the School of Psychology Ethics Committee, Cardiff University. Informed consent was obtained from all participants. SABP participants were recruited from local genetic epidemiology studies at the MRC Centre for Neuropsychiatric Genetics & Genomics, Cardiff University, part of the Wellcome Trust Case Control Consortium (http://www.wtccc.org.uk). They had previously been diagnosed according to research diagnostic criteria (RDC) (Spitzer et al. Reference Spitzer, Endicott and Robins1978). HCs were recruited from Cardiff University staff and the local community. HCs had no history of Axis I psychiatric disorder, determined by the MINI (Sheehan et al. Reference Sheehan, Lecrubier, Sheehan, Amorim, Janavs, Weiller, Hergueta, Baker and Dunbar1998) and General Hospital Questionnaire (GHQ) and no history of psychiatric disorder in first-degree relatives using RDC family history method (Andreasen et al. Reference Andreasen, Endicott, Spitzer and Winokur1977). Exclusion criteria included dyslexia, contra-indications to MRI, organic brain disease, drug or alcohol dependence (determined by the MINI) and self-reported cognitive problems or memory problems, determined by systematic interview.
SABP subjects completed the MINI, to screen for current affective or psychotic episodes, and measures of current affective and psychotic symptoms: the Scale for the Assessment of Positive Symptoms (SAPS; Andreasen, Reference Andreasen1984), the Scale for the Assessment of Negative Symptoms (SANS; Andreasen, Reference Andreasen1983) the Young Mania Rating Scale (YMRS; Young et al. Reference Young, Biggs, Ziegler and Meyer1978) and the Calgary Depression Scale (CDS; Addington et al. Reference Addington, Addington and Schissel1990). In addition, a record was made of currently prescribed medications.
Stimulation paradigm
Participants were presented with a slightly modified version of an established visual paradigm (Muthukumaraswamy et al. Reference Muthukumaraswamy, Edden, Jones, Swettenham and Singh2009) consisting of a vertical, stationary, maximum-contrast, three cycles per degree, sine-wave grating presented on a mean luminance background. The stimulus was presented in the lower left visual field, subtended 4° both horizontally and vertically, with the centre of the image located 2.8° along a 45° angle, extending left-inferiorly from a small red fixation point. Visual stimuli were presented on a Mitsubishi Diamond Pro 2070 monitor (1024 × 768 pixels and 100 Hz frame rate). The duration of each stimulus was 0.8–2.3 s (mean duration 1.55 s) followed by 1.5 s of the fixation point only. Participants were instructed to maintain fixation for the entire experiment and to maintain attention, were instructed to press a response key at the termination of each stimulation period. One hundred and fifty identical visual stimuli were presented in each recording session and each recording session took approximately 8 min.
MEG acquisition and analysis
Whole head MEG recordings were made using a 275-channel whole-head MEG system in a magnetically shielded room. Twenty-nine reference channels were also recorded for noise-cancellation purposes and the primary sensors were analysed as synthetic third-order gradiometers (Vrba & Robinson, Reference Vrba and Robinson2001). Three of the 275 channels were turned off due to excessive sensor noise. Before MEG recording, participants were fitted with three fiduciary markers in the form of electromagnetic head coils at the two pre-auricular points and nasion, and were localized relative to the MEG system immediately before and after the recording session. Previously, high-resolution anatomical images had been acquired for each individual with a T1-weighted 3D FSPGR sequence (TR/TE/TI = 7.8/3.0/450 ms, flip angle = 20° FOV = 256 × 192 × 172 mm, 1 mm isotropic resolution, 8 min acquisition time). After MEG recording these fiduciary markers were used to enable MEG and MRI co-registration.
Offline, each dataset was epoched from −0.8 to 0.8 s around stimulus onset and each trial visually inspected for data quality. Trials containing gross artefacts, such as head movements and muscle clenching were excluded from further analysis. Three source localizations were performed on each dataset using synthetic aperture magnetometry (SAM) (Robinson & Vrba, Reference Robinson, Vrba, Yoshimoto, Kotani, Kuriki, Karibe and Nakasato1999) for gamma (30–70 Hz), alpha (8–13 Hz) and evoked responses (SAMerf) (Robinson, Reference Robinson2004). Correspondingly, three global covariance matrices were calculated for each dataset, one for gamma, one for alpha and one for SAMerf (0–100 Hz). Based on these covariance matrices, using the beamformer algorithm (Robinson & Vrba, Reference Robinson, Vrba, Yoshimoto, Kotani, Kuriki, Karibe and Nakasato1999), three sets of beamformer weights were computed for the entire brain at 4 mm isotropic voxel resolution.
For gamma-band SAM image reconstruction virtual sensors were constructed for each beamformer voxel and student t images of source power changes computed using a baseline period of −0.8 to 0 s and an active period of 0 to 0.8 s, while for alpha-band SAM image reconstruction a baseline period of −0.8 to −0.25 s and an active period of 0.25–0.8 s was used. The 0–0.25 s active time window was excluded for the alpha-band SAM image reconstruction to avoid contamination of the evoked response into the alpha-band source image.
For each participant, using their source reconstruction image, the voxel with the strongest power increase in the contralateral occipital lobe was located for gamma and the voxel with the strongest source power decrease located for alpha. Time-frequency analyses of these virtual electrodes were conducted with the Hilbert transform between 1 and 100 Hz, at 0.5 Hz frequency step intervals and time-frequency spectra were computed as a percentage change from the pre-stimulus baselines (−0.8 to −0 s) for each frequency band. From these spectra, the peak frequency and amplitude at that frequency for transient gamma amplitude increases (30–70 Hz, 0–0.3 s), sustained gamma amplitude increases (30–70 Hz, 0.3–0.8 s) and alpha amplitude decreases (8–13 Hz, 0.25–0.8 s) were quantified by collapsing across the time dimension and finding the maximal (or minimal for alpha) frequency. From these spectra, the time-course of gamma (30–70 Hz) was extracted and submitted to non-parametric permutation tests using 5000 permutations (Nichols & Holmes, Reference Nichols and Holmes2002). Permuted t statistics were corrected for multiple comparisons using cluster-based techniques (Maris & Oostenveld, Reference Maris and Oostenveld2007). The width of the spectral peak was estimated by the full-width half maximum (FWHM) of the gamma peak.
Previous studies have reported differences in baseline (pre-stimulus) gamma power between schizophrenia patients and controls (Spencer, Reference Spencer2012). Hence, we examined pre-stimulus amplitudes by recomputing time-frequency spectra with no baseline correction across frequency bands (0–105 Hz) in the pre-stimulus period (−0.8 to 0 s).
For SAMerf, the computed evoked response was passed through the 0–100 Hz beamformer weights to generate SAMerf images (Robinson, Reference Robinson2004) at 10 ms intervals from 50–150 ms. The image window (usually 70–80 ms or 80–90 ms) with the maximal response in visual cortex was identified and the maximal voxel selected as the peak location for further analysis. For this, the evoked field was computed for this virtual sensor (−0.2 to 0 s baseline) and the peak amplitude and latency of the M80 and M150 responses quantified.
Results
Demographic and clinical characteristics for SABP and HC groups are summarized in Table 1. The SABP and HC subjects did not differ significantly by age [46.8 years (s.d. = 9.8) v. 40.8 years (s.d. = 10.7), t 35 = −1.73, p = 0.093] and had similar female to male gender ratios. SAPS and SANS symptom scores and YMRS and CDS scores were available for 13 SABP individuals; SABP patients had subsyndromal levels of depression and manic symptoms as measured with the YMRS and CDS. They also had low negative and positive symptoms as measured using the SAPS and SANS. All of the SABP patients were taking a range of medications: 14 were taking antipsychotics (quetiapine, aripiprazole, olanzapine, clozapine, sulpiride), seven were taking antidepressants (citalopram, mirtazapine, vilazodone, venlafaxine, effexor), nine were taking anticonvulsants (depakote, sodium valproate, epilim, lamotrigine, tegretol), five were taking lithium and four were taking benzodiazepines (diazepam, lorazepam, oxazepam).
Table 1. Demographic and clinical characteristics of SABP and HC groups

SABP, Schizoaffective bipolar disorder; HC, healthy controls.
Mean values are shown (with standard deviations).
SABP individuals had slightly longer key-pressing response times compared to healthy individuals [317 ms (s.d. = 54) v. 283 ms (s.d. = 47); t = −2.056, p = 0.047] but there were no group differences in the number of key presses missed [7.3 (s.d. = 7.0) v. 4.5 (s.d. = 4.1); t = −1.544, p = 0.132].
Fig. 1a shows the grand-averaged source localization of gamma oscillations (30–70 Hz) for SABP and HC groups. Fig. 1b shows the resulting grand-average time-frequency spectra for SABP and HC groups. For both groups, the time-frequency spectra showed the characteristic responses following this type of visual stimulus (Muthukumaraswamy et al. Reference Muthukumaraswamy, Singh, Swettenham and Jones2010): there was an initial transient increase in gamma power (0–0.3 s), followed by a sustained increase in gamma power (0.3–0.8 s). The lower frequency band (8–13 Hz) included the early (<0.3 s) visual evoked response, followed by a sustained suppression of alpha amplitude.
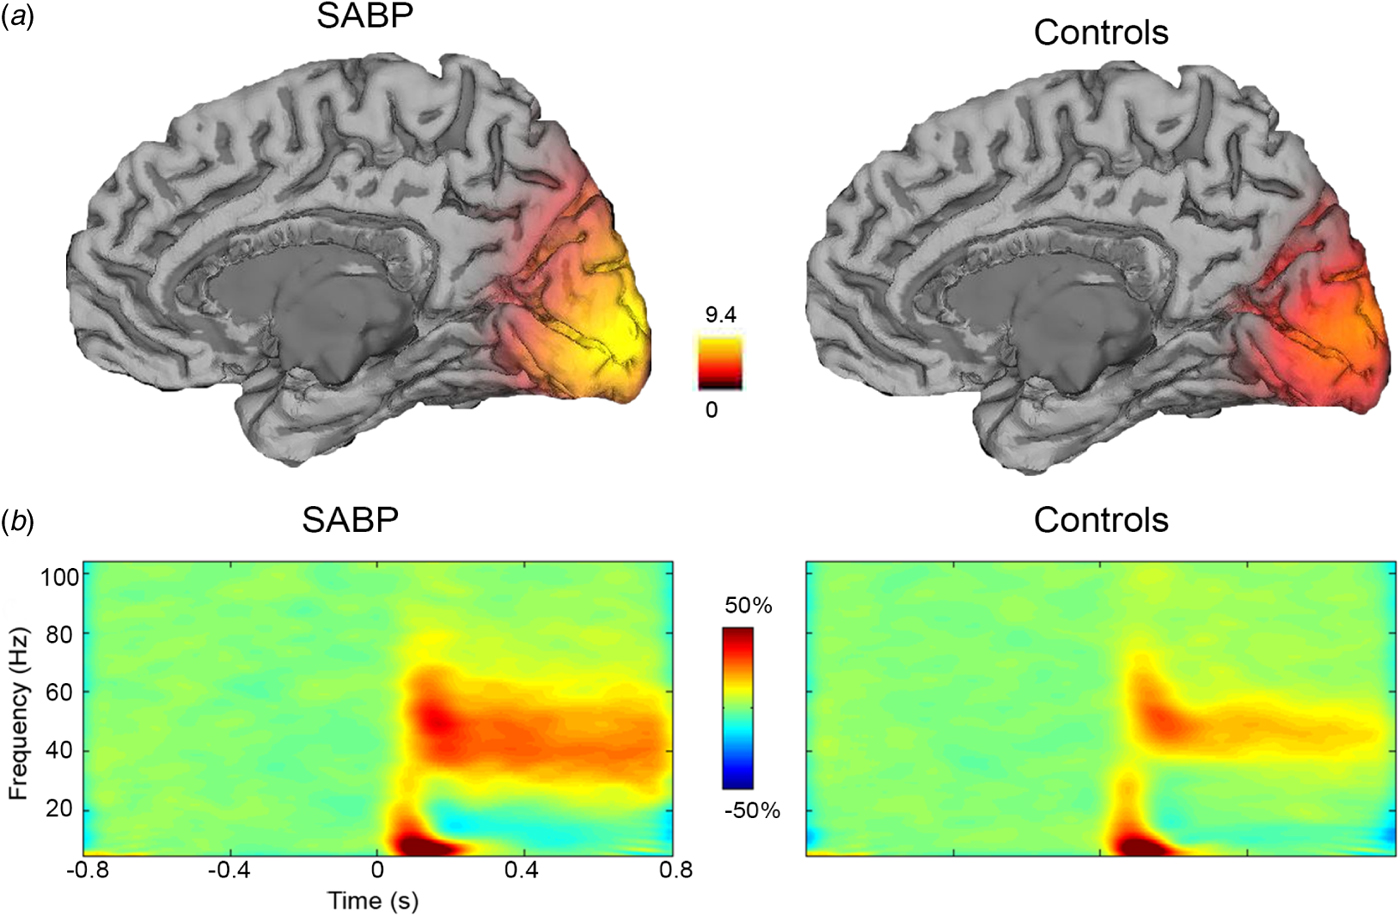
Fig. 1. (a) Grand-averaged source localization of gamma oscillations (30–70 Hz) for schizoaffective bipolar disorder (SABP) and healthy control (HC) individuals. Units are t statistics. (b) Grand-averaged time-frequency spectrograms showing source-level oscillatory power changes following visual stimulation with a circular grating patch (stimulus onset at time = 0 s) for SABP and HC individuals. Spectrograms are displayed as percentage change from the pre-stimulus baseline.
For group comparisons, the grand-averaged time-frequency spectra demonstrate a greater increase in sustained gamma power (30–70 Hz) in the SABP group compared to the HC group. These increases in gamma power in the SABP group follow a much broader gamma band response compared to the HC group [20.9 (s.d. = 7.4) v. 15.6 (s.d. = 7.2); t 35 = −2.170, p = 0.037, 95% confidence intervals of the difference = −10.253 to −0.341], calculated using FWHM of the gamma peak. In order to further investigate this group difference in the sustained gamma band response, power-frequency plots were generated for the transient (0–0.3 s) and sustained gamma time windows (0.3–0.8 s) (Fig. 2a, b). As expected from Fig. 1, in the sustained gamma time window, SABP individuals showed a significantly higher increase of 18% in gamma power (30–70 Hz) compared to a 9% increase in controls (t 35 = −2.56, p = 0.015, 95% confidence intervals of the difference = −15.3 to −1.7).

Fig. 2. Grand-averaged power-frequency spectrograms, showing power changes across a broad frequency range (0–105 Hz) in (b) the transient (0–0.3 s) and (a) sustained response (0.3–0.8 s) time window following visual stimulation. Coloured areas represent standard error of the mean. Frequency bands with significant differences in power between schizoaffective bipolar disorder (SABP) and healthy control (HC) groups are shown with a black bar (* p < 0.05, ** p < 0.01, corrected for multiple comparisons across frequency bands; see text). (c) Mean pre-stimulus baseline activity (−0.8–0 s) in SABP and HC subjects, with an integrated and enlarged graph across 30–70 Hz.
To detect the specific frequencies within the gamma frequency band at which there was increased gamma power we used permuted t statistics with cluster based techniques. The power-frequency plot for sustained responses (Fig. 2a) shows two significant clusters of increased power in the SABP group compared to the HC group, one at lower gamma frequencies (26.5–42.5 Hz, p < 0.01, corrected) and one at higher gamma frequencies (60.5–70 Hz, p < 0.05, corrected) (Fig. 2a). At the lower gamma frequency range (26.5–42.5 Hz), SABP individuals showed a 19.5% mean increase in gamma power compared to a 7.4% increase in HCs. At the higher gamma frequency range (60.5–70 Hz), SABP individuals had a mean increase of 8.9% in gamma power compared to 3.2% in HCs. There was no significant difference between groups in transient responses (p > 0.05) (Fig. 2b).
We investigated whether the observed increase in sustained gamma power in the SABP group was due to an initial baseline (pre-stimulus) difference in the power-frequency spectrum (Fig. 2c). No group differences in mean pre-stimulus (−0.8 to 0 s) values were seen across the 30–70 Hz frequency range (t 35 = −0.126, p = 0.901, 95% confidence intervals of the difference = −0.113 to 0.100).
In order to explore if the significant difference in gamma power observed in the group comparison was consistent across the group or was influenced by only a minority of individuals, we selected 15 HC individuals who were age- and-sex-matched to the 15 SABP individuals on a pairwise basis and charted the gamma power values for these pairs. Sustained gamma power was higher in the SABP individual than in the HC individual in all but one of these pairwise comparisons (see Fig. 3a). A similar plot was made for peak sustained gamma frequency (Fig. 3b). This paired age-matching also ensures that small differences in age between the two groups are not affecting our results, as although age has not been found to affect gamma power, peak gamma frequency decreases with age (Muthukumaraswamy et al. Reference Muthukumaraswamy, Singh, Swettenham and Jones2010).

Fig. 3. A histogram demonstrating individual pairwise comparisons in schizoaffective bipolar disorder (SABP, n = 15) and controls (n = 15) for (a) mean gamma power values (30–70 Hz) and (b) sustained peak gamma frequency.
We also investigated the effect of medication on our finding of increased gamma power in SABP. For the 14 patients on antipsychotics, we converted antipsychotic dosage to chlorpromazine equivalent levels (Woods, Reference Woods2003; Janssen et al. Reference Janssen, Weinmann, Berger and Gaebel2004). Chlorpromazine dosage did not correlate with gamma power (r = 0.168, p = 0.565). The potential effect of other medications on gamma power was investigated by group comparisons within the SABP patients, comparing those on the medication and those not on the medication. No significant difference was found between the two groups of SABP patients for benzodiazepines (p = 0.868), antidepressants (p = 0.278) or lithium (p = 0.789). Anticonvulsants were found to significantly reduce gamma power (p = 0.01),with patients on anticonvulsants having a mean increase in gamma power of 11%, compared to a mean increase of 27% for those not medicated on anticonvulsants. There were no group differences in transient or sustained peak gamma frequency (Fig. 4a, b, p = 0.106, p = 0.280), or alpha power (Fig. 4c, p = 0.900). There were also no group differences in the amplitude or latency of the M80 or M150 pattern onset evoked responses. (Fig. 4d; M80 amplitude: p = 0.928, M80 latency: p = 0.072, M150 amplitude: p = 0.899, M150 latency: p = 0.143).

Fig. 4. (a)–(c) Bar charts showing no significant group differences in (a) peak transient gamma frequency (0–0.3 s), (b) peak sustained gamma frequency (0.3–0.8) and (c) alpha power (8–13 Hz). Error bars represent standard errors of the mean. (d) A graph of the time-course of source-level evoked responses in schizoaffective bipolar disorder (SABP) and healthy controls, showing no significant group differences.
Discussion
We have demonstrated a large increase of 18% in induced gamma power in SABP individuals compared to a 9% increase in controls, in response to a visual grating stimulus designed to maximally elicit gamma responses in the visual cortex. This was present in all but one of the pairwise comparisons. Importantly, this increase in gamma power was not due to group differences in baseline (pre-stimulus) gamma power. We found no group differences in either transient or sustained peak gamma frequency, alpha power or components of the evoked response. This dissociation between induced and evoked responses is not surprising, since previous studies have identified these measures as independent oscillatory parameters which may be generated via different cell populations in the visual cortex (Spaak et al. Reference Spaak, Bonnefond, Maier, Leopold and Jensen2012; Jia et al. Reference Jia, Xing and Kohn2013).
In contrast to our finding of increased visual gamma power in SABP, the majority of electrophysiological studies report reductions in gamma band responses in schizophrenia and bipolar patients during a range of cognitive and visual tasks. Many of these studies have employed evoked gamma band responses, which are phase-locked to stimuli: reduced evoked gamma power and synchrony have been observed in response to click train stimuli in chronic schizophrenia (Kwon et al. Reference Kwon, O'Donnell, Wallenstein, Greene, Hirayasu, Nestor, Hasselmo, Potts, Shenton and McCarley1999) and reduced gamma phase locking in visual and auditory oddball tasks were observed in both bipolar disorder and schizophrenia (Spencer et al. Reference Spencer, Niznikiewicz, Shenton and McCarley2008; Hall et al. Reference Hall, Spencer, Schulze, McDonald, Kalidindi, Kravariti, Kane, Murray, Bramon, Sham and Rijsdijk2011). Early visual processing deficits have also been found in schizophrenia patients, as measured by the visual backward-masking task (Wynn et al. Reference Wynn, Light, Breitmeyer, Nuechterlein and Green2005). Reductions in frontal gamma power have been reported in schizophrenia individuals during more complex cognitive tasks such as working memory (Haenschel & Linden, Reference Haenschel and Linden2011) and mental arithmetic (Kissler et al. Reference Kissler, Muller, Fehr, Rockstroh and Elbert2000). Fewer studies have focused on induced gamma oscillations. Both intact (Uhlhaas et al. Reference Uhlhaas, Linden, Singer, Haenschel, Lindner, Maurer and Rodriguez2006) and impaired induced visual gamma oscillations (Grützner et al. Reference Grützner, Wibral, Sun, Rivolta, Singer, Maurer and Uhlhaas2013) have been found in response to Mooney faces.
Gamma frequency has previously been found to positively correlate with MRS GABA levels (Muthukumaraswamy et al. Reference Muthukumaraswamy, Edden, Jones, Swettenham and Singh2009). Thus, given that schizophrenia and bipolar disorder are associated with decreased GABAergic function (Lewis et al. Reference Lewis, Curley, Glausier and Volk2012) and that gamma frequency has previously been reported to be decreased in schizophrenia (Ferrarelli et al. Reference Ferrarelli, Sarasso, Guller, Riedner, Peterson, Bellesi, Massimini, Postle and Tononi2012), one might expect decreased gamma frequency.
Overall, several factors may explain the observed inconsistency in gamma deficits between our results and other studies. First, we investigated induced gamma responses, which reflect intrinsic cortical network activity as opposed to evoked responses, which reflect driven cortical activity. Second, our study was in SABP individuals rather than schizophrenia patients. SABP individuals have previously been included in the schizophrenia cohort rather than as a separate cohort, which assumes a common pathophysiology. An auditory steady-state response observed greater gamma amplitudes and phase-locking factors in the 40 Hz steady-state responses to auditory stimuli in the right hemisphere of individuals with schizoaffective disorder but not schizophrenia compared to controls (Reite et al. Reference Reite, Teale, Collins and Rojas2010). This suggests schizoaffective disorder may be an independent phenotype and differs in pathophysiology to schizophrenia. Third, we measured gamma responses in the visual cortex rather than the auditory or prefrontal cortices. In the context of psychiatric disorders, primary abnormalities in cortical glutamate function are unlikely to be confined to the occipital cortex, but occipital measures could represent sensitive indices of more generalized pathology. Fourth, we used a simple visual stimulus as opposed to more complex cognitive or emotional stimuli. The advantage of using this stimulus is that responses are highly repeatable within individuals and thus represent a stable measure. Responses can also be manipulated pharmacologically in healthy individuals, providing us with a strong basis to probe GABAergic and glutamatergic function in the visual cortex of SABP individuals. Although the time window (0.5 s) over which induced sustained gamma measures are assessed is also relatively short previous studies have investigated induced gamma power over much shorter time windows (Uhlhaas et al. Reference Uhlhaas, Linden, Singer, Haenschel, Lindner, Maurer and Rodriguez2006; Grützner et al. Reference Grützner, Wibral, Sun, Rivolta, Singer, Maurer and Uhlhaas2013).
Finally, it is also possible that gamma power across psychotic disorders may be increased or decreased depending on the preponderance of positive v. negative symptoms in the illness history. The power of gamma responses to Gestalt tasks have been shown to positively correlate with positive symptoms, such as delusions and hallucinations, in the occipital region (Spencer et al. Reference Spencer, Nestor, Perlmutter, Niznikiewicz, Klump, Frumin, Shenton and McCarley2004), and when averaged across all channels (Uhlhaas et al. Reference Uhlhaas, Linden, Singer, Haenschel, Lindner, Maurer and Rodriguez2006), while gamma power has been shown to negatively correlate with the negative symptom disorganisation (Grützner et al. Reference Grützner, Wibral, Sun, Rivolta, Singer, Maurer and Uhlhaas2013). However, as the patients in our study were remitted and had low SAPS and SANS scores, we could not fully investigate the influence of symptoms on our measures.
Our finding of increased gamma power in SABP supports the NMDAR hypofunction hypothesis for the aetiology of schizophrenia. Computer modelling evidence suggests gamma power may be increased by NMDAR antagonism (Spencer, Reference Spencer2009). In the cortical circuit model, reducing the NMDAR input by 20–100% to fast-spiking interneurons was found to increase gamma power. This increase in gamma power has been explained by reduced NMDA facilitation of fast-spiking GABA interneurons which, in turn, disinhibits AMPA neurons, leading to an overall increase in cortical excitability. Preclinical work also supports this hypothesis, demonstrating increased gamma power in response to the NMDA antagonist MK-801 (Arai & Kessler, Reference Arai and Kessler2007; Wood et al. Reference Wood, Kim and Moghaddam2012) and decreased cortical gamma power in response to the α-amino-3-hydroxy-5-methyl-4-isoxazolepropionic acid (AMPA) receptor antagonist SYM 2206 (Oke et al. Reference Oke, Magony, Anver, Ward, Jiruska, Jefferys and Vreugdenhil2010). The anaesthetic ketamine is thought to act in a similar way, and recent in vivo evidence suggests that it increases glutamate release in the prefrontal cortex of healthy volunteers (Stone et al. Reference Stone, Dietrich, Edden, Mehta, De Simoni, Reed, Krystal, Nutt and Barker2012). Thus, increases in gamma power may be mediated by NMDAR blockade, which reduces the activity of cortical GABAergic interneurons and, in consequence, increases the excitability of pyramidal cells (Homayoun & Moghaddam, Reference Homayoun and Moghaddam2007).
However, recent pharmacoimaging work argues against a GABA deficit mediating the effect of increased gamma responses observed in SABP. The GABA-A agonist propofol increased rather than decreased gamma power in healthy volunteers (Saxena et al. Reference Saxena, Muthukumaraswamy, Diukova, Singh, Hall and Wise2013). Furthermore, the GABA transporter tiagabine, which increases synaptic availability of GABA, had no effect on gamma frequency or power, but suppressed the pattern onset (80 ms) evoked response (Muthukumaraswamy et al. Reference Muthukumaraswamy, Myers, Wilson, Nutt, Hamandi, Lingford-Hughes and Singh2013). It is possible, therefore, that the observed increase in gamma power reflects a primarily glutamatergic pathology. The effects of NMDA antagonists (such as ketamine) and AMPA antagonists (such as perampanel) on visual gamma power need to be investigated in vivo.
In addition, our finding of altered gamma power in SABP being associated with a deficit in glutamatergic function coincides with the predictive coding model on sensory perception. The model suggests that perception relies on the optimization of predicted upcoming sensory information, to reduce prediction errors. Gamma band oscillations are thought to play an important part in processing prediction errors via feed-forward signalling from superficial pyramidal cells to deeper layers of the cortex (Arnal & Giraud, Reference Arnal and Giraud2012). In schizophrenia, individuals are thought to have a reduction in precision (prior beliefs on sensory information), causing a failure to adequately predict sensory input (Adams et al. Reference Adams, Stephan, Brown, Frith and Friston2013). This leads to altered perception on incoming sensory stimuli. Precision is thought to be encoded by the postsynaptic gain of superficial pyramidal cells, which may primarily be determined by NMDARs. Hence, dysfunctions in the NMDAR may cause abnormal neuromodulation of postsynaptic gain and oscillatory activity, ultimately leading to altered precision and perception of sensory information.
Our study had some limitations. In the context of psychiatric disorders, primary abnormalities in cortical GABAergic/glutamatergic function are unlikely to be confined to the occipital cortex. However, occipital measures could represent particularly sensitive indices of more generalized pathology. The putative advantage of using a low-level visual stimulus, as opposed to more complex cognitive or emotional stimuli, is that the paradigm is tapping in to a stable and sensitive index of neurotransmitter function. While the stimuli are simple, any abnormalities that might be discovered in mental disorder would have implications for the integration of higher level perceptual and cognitive processes seen in these disorders that are harder to detect using current MEG methods.
Medication will always be a potential confound when studying patients with schizoaffective disorder or psychosis in general. All of our participants were taking medication, which could have affected gamma measures independent of any trait disturbance, and medication could have mitigated against any illness-related disturbance in this remitted group. In an auditory steady-state stimulation paradigm, patients with schizophrenia taking atypical antipsychotics showed enhanced gamma power at 40 Hz stimulation compared with patients taking conventional antipsychotics (Hong et al. Reference Hong, Summerfelt, McMahon, Adami, Francis, Elliott, Buchanan and Thaker2004), although there was considerable overlap. All but one of our participants was taking atypical antipsychotics. However, preclinical work suggests that atypical and conventional antipsychotics reduce spontaneous gamma power (Jones et al. Reference Jones, Reddy, Anderson, Salzberg, O'Brien and Pinault2012), or suppress gamma power responses to acetylcholine and physostigmine (Schulz et al. Reference Schulz, Heidmann, Mike, Klaft, Heinemann and Gerevich2012). Hence, we might expect antipsychotics to reduce rather than explain the observed group differences. Other clinical evidence suggests that both medicated and unmedicated patients with first episode psychosis have similarly impaired gamma power during cognitive control in first-episode schizophrenia (Minzenberg et al. Reference Minzenberg, Firl, Yoon, Gomes, Reinking and Carter2010).
In our results, we found no effect of chlorpromazine dosage, benzodiazepines, antidepressants or lithium on gamma power. However, patients on anticonvulsants were found to have significantly lower gamma power compared to those not on the medication. These findings coincide with a recent study, showing that the anticonvulsant sodium valproate significantly decreases visual gamma power (Perry et al. Reference Perry, Brindley, Muthukumaraswamy, Singh and Hamandi2014). This implies that anticonvulsants may in fact be normalizing gamma power and that increases in gamma power could be less detectable in patients on this type of medication. Nicotine may also be a confounding factor. Nicotine has been shown to enhance auditory evoked gamma activity (Featherstone et al. Reference Featherstone, Phillips, Thieu, Ehrlichman, Halene, Leiser, Christian, Johnson, Lerman and Siegel2012) but the effect of nicotine on induced oscillations in the visual cortex is unknown. Although nicotine use may be affecting our measures, as 14 of the 15 patients showed increased gamma power in comparison to their age- and gender-matched control it is unlikely that this can be attributed to increased nicotine intake across all SABP individuals.
In conclusion, we have demonstrated that remitted SABP is characterized by an increase in gamma power induced by a simple visual stimulus. We further suggest that this is an index of a more generalized non-state-dependent dysfunction of glutamatergic and/or GABAergic activity. Further work is needed to explore these deficits in unmedicated SABP patients and their relatives. This will help us determine if inconsistencies between our findings and other clinical population studies can be explained by the visual stimulus and/or the SABP cohort. Pharmaco-MEG studies are required to examine the relative effects of glutamate and GABA receptor agonists and antagonists on induced gamma power in healthy and psychiatric populations. This may ultimately help us to understand specific mechanisms underlying the generation of gamma oscillations and improve the treatment of major mental disorders.
Acknowledgements
The study was supported by the Academy of Medical Sciences.
Declaration of Interest
None.


