Introduction
Nausea and vomiting are among the most common symptoms during pregnancy, affecting 50–90% of all pregnant women (O'Donnell et al., Reference O'Donnell, McParlin, Robson, Beyer, Moloney, Bryant, Bradley, Muirhead, Nelson-Piercy, Newbury-Birch, Norman, Simpson, Swallow, Yates and Vale2016). Nausea and vomiting during pregnancy (NVP) starts at the beginning of the first trimester, peaks around 9 weeks and usually resolves after 20 weeks of gestation (Klebanoff et al., Reference Klebanoff, Koslowe, Kaslow and Rhoads1985; Gadsby et al., Reference Gadsby, Barnie-Adshead and Jagger1993; Lacroix et al., Reference Lacroix, Eason and Melzack2000). The most severe form of NVP, hyperemesis gravidarum (HG), affects about 0.3–1% of pregnant women (Niebyl, Reference Niebyl2010) and these women are often hospitalised because of severe weight loss and dehydration (Jueckstock et al., Reference Jueckstock, Kaestner and Mylonas2010).
Although NVP is regarded as a physiological and self-limiting process in most cases, around 35% of pregnant women experience the NVP symptoms as interfering with their daily activities (Attard et al., Reference Attard, Kohli, Coleman, Bradley, Hux, Atanackovic and Torrance2002; Andersson et al., Reference Andersson, Sundström-Poromaa, Wulff, Åström and Bixo2004; Niebyl, Reference Niebyl2010). High levels of NVP are associated with lower quality of life (QOL), reduced work productivity, time loss from work and increased use of healthcare resources (Gadsby et al., Reference Gadsby, Barnie-Adshead and Jagger1993; Attard et al., Reference Attard, Kohli, Coleman, Bradley, Hux, Atanackovic and Torrance2002).
The aetiology of NVP is poorly understood, but thought to be multifactorial (O'Donnell et al., Reference O'Donnell, McParlin, Robson, Beyer, Moloney, Bryant, Bradley, Muirhead, Nelson-Piercy, Newbury-Birch, Norman, Simpson, Swallow, Yates and Vale2016). Endocrine factors have been related to NVP. Since the clinical course of NVP symptoms shows a similar pattern as the increase of human chorionic gonadotropin (hCG) levels during the first trimester, higher levels of hCG have been associated with (more severe forms of) NVP (Niebyl, Reference Niebyl2010; O'Donnell et al., Reference O'Donnell, McParlin, Robson, Beyer, Moloney, Bryant, Bradley, Muirhead, Nelson-Piercy, Newbury-Birch, Norman, Simpson, Swallow, Yates and Vale2016). However, different findings mitigate against the hCG hypothesis as the sole aetiological factor of NVP. For example, many pregnant women with high hCG levels do not suffer from severe NVP and a substantial proportion of women with severe NVP continue to have symptoms beyond the first trimester when hCG levels are rapidly decreasing. Furthermore, the few studies that investigated a possible relationship between hCG and NVP have methodological flaws and often used small samples (O'Donnell et al., Reference O'Donnell, McParlin, Robson, Beyer, Moloney, Bryant, Bradley, Muirhead, Nelson-Piercy, Newbury-Birch, Norman, Simpson, Swallow, Yates and Vale2016). Therefore, the exact relation between hCG and NVP remains to be determined.
A proposed mediating mechanism for the association between hCG and NVP is the effect of hCG on thyroid function because of the structural similarity between beta hCG and thyroid-stimulating hormone (TSH). This is reflected in the finding of lower TSH levels and elevated thyroxin (FT4) levels when hCG levels increase in normal pregnancy (Verberg et al., Reference Verberg, Gillott, Al-Fardan and Grudzinskas2005). However, the exact relation between thyroid function and NVP in healthy women is poorly investigated and remains unclear. HG has been reported to occur more frequently in women with severe hyperthyroidism (low TSH and high FT4) during early gestation (Tan et al., Reference Tan, Loh, Yeo and Chee2002). Other factors associated with the incidence of NVP are primigravida (Jueckstock et al., Reference Jueckstock, Kaestner and Mylonas2010; Latva-Pukkila et al., Reference Latva-Pukkila, Isolauri and Laitinen2010), multiple (twin or higher) gestation (Yates, Reference Yates2004), larger placentae (Gadsby et al., Reference Gadsby, Barnie-Adshead and Jagger1997; Niebyl, Reference Niebyl2010), nausea and vomiting in a previous pregnancy (Gadsby et al., Reference Gadsby, Barnie-Adshead and Jagger1997; Niebyl, Reference Niebyl2010), heritability (Gadsby et al., Reference Gadsby, Barnie-Adshead and Jagger1997; Yates, Reference Yates2004; Vikanes et al., Reference Vikanes, Skjaerven, Grjibovski, Gunnes, Vangen and Magnus2010) and insufficient vitamin (B) intake (Källén et al., Reference Källén, Lundberg and Åberg2003; Latva-Pukkila et al., Reference Latva-Pukkila, Isolauri and Laitinen2010; Niebyl, Reference Niebyl2010).
In addition to biological processes involved in NVP, evidence indicates that psychosocial factors contribute to NVP. Depression and anxiety disorders are associated with several somatic symptoms, including nausea and vomiting (Walker et al., Reference Walker, Roy-Byrne and Katon1990; Kelly et al., Reference Kelly, Russo and Katon2001; Haug et al., Reference Haug, Mykletun and Dahl2002). During pregnancy, the association of depression and anxiety with NVP has been confirmed in several studies (Chou et al., Reference Chou, Lin, Cooney, Walker and Riggs2003; Andersson et al., Reference Andersson, Sundström-Poromaa, Wulff, Åström and Bixo2004; Swallow et al., Reference Swallow, Lindow, Masson and Hay2004). However, surprisingly few studies have adjusted for other psychosocial factors. For example, unplanned and undesired pregnancies (Buckwalter and Simpson, Reference Buckwalter and Simpson2002), negative partner relationships, stressful life events (Swallow et al., Reference Swallow, Lindow, Masson and Hay2004), a history of migration (Jueckstock et al., Reference Jueckstock, Kaestner and Mylonas2010), lower education, younger age, eating disorders, overweight (Klebanoff et al., Reference Klebanoff, Koslowe, Kaslow and Rhoads1985; Jueckstock et al., Reference Jueckstock, Kaestner and Mylonas2010) and non-smoking (Gadsby et al., Reference Gadsby, Barnie-Adshead and Jagger1997; Källén et al., Reference Källén, Lundberg and Åberg2003; Jueckstock et al., Reference Jueckstock, Kaestner and Mylonas2010) have been associated with higher NVP symptoms.
The public health implication of NVP is substantial because approximately one in three women report NVP symptoms that interfere with daily activities (Attard et al., Reference Attard, Kohli, Coleman, Bradley, Hux, Atanackovic and Torrance2002; Andersson et al., Reference Andersson, Sundström-Poromaa, Wulff, Åström and Bixo2004; Niebyl, Reference Niebyl2010). Understanding the mechanisms involved in NVP may have implications for health policy since NVP may result in increased health care utilisation and time loss from work (Gadsby et al., Reference Gadsby, Barnie-Adshead and Jagger1993; Attard et al., Reference Attard, Kohli, Coleman, Bradley, Hux, Atanackovic and Torrance2002). Currently, only limited treatment options exist for all but the most severe NVP (Locock et al., Reference Locock, Alexander and Rozmovits2008). It appears that women with less severe NVP would benefit from greater acknowledgement of the distress NVP causes them. If both psychological and biological factors contribute to NVP, then an integrated health care approach is likely to be successful. Prior research in NVP has not simultaneously investigated biological and psychological factors. Moreover, small sample sizes and lack of adjustment for possible confounding factors limit the current knowledge of NVP.
The primary goal of this study was to evaluate in a large sample of pregnant women whether biological factors such as hCG and thyroid hormones (TSH and FT4) are related to NVP. Secondly, we evaluated a possible relation between depressive symptoms and NVP. Finally, we explored the combined association of biological and psychological factors with NVP.
Methods
Participants
The women of the current study participated in the Holistic Approach to Pregnancy and the first Postpartum Year (HAPPY) study, of which the design was described in details previously (Truijens et al., Reference Truijens, Meems, Kuppens, Broeren, Nabbe, Wijnen, Oei, van Son and Pop2014). The HAPPY study investigated general well-being during gestation, also in relation to thyroid function. Dutch-speaking women from 18 years or older and in the first trimester of a singleton pregnancy were eligible for the study. Exclusion criteria were current psychiatric disorders other than depression or anxiety (e.g. schizophrenia, borderline, bipolar disorder) and chronic health disorders (e.g. endocrine disorder) [see Truijens et al. (Reference Truijens, Meems, Kuppens, Broeren, Nabbe, Wijnen, Oei, van Son and Pop2014) for additional details related to inclusion and exclusion criteria].
Procedure
Women who met the inclusion criteria were invited by their community midwife to participate in the HAPPY study. Of the 3160 eligible women, 72% (2275) gave written informed consent (Truijens et al., Reference Truijens, Meems, Kuppens, Broeren, Nabbe, Wijnen, Oei, van Son and Pop2014). An additional tube of blood was drawn during standard blood assessments between 10 and 12 weeks of gestation for thyroid function evaluation. Six months after starting the HAPPY study (when the first women were included), it was decided to additionally determine hCG. Therefore, the present analyses were based on the 1776 women in whom both thyroid hormones and hCG were assessed. The gestational age was calculated from the date of the last menstrual cycle and from an ultrasound scan during what was presumed to be the 12th week of pregnancy. If a discrepancy of more than 7 days was seen between these two measurements, a second ultrasound scan was performed within 2 weeks to reassess gestational age. Participants completed the baseline questionnaires between 12 and 14 weeks of gestation [median (Md) = 13, inter-quartile range = 13–14; mean (M) = 13.54, standard deviation (s.d.) = 1.74]. Incomplete questionnaires were returned by 94 women. This left a sample of 1682 women suitable for data analysis (95% response rate), in whom both thyroid hormones and hCG were assessed, and who completed all questionnaires.
The HAPPY study was approved by the Ethics Review Board of Tilburg University and the Medical Ethical Committee of the Máxima Medical Centre Veldhoven.
Biological and psychological assessments
NVP
The Pregnancy-Unique Quantification of Emesis (PUQE) scale was used to assess NVP (Koren et al., Reference Koren, Boskovic, Hard, Maltepe, Navioz and Einarson2002). The PUQE is a self-report questionnaire consisting of three items with five answer categories measuring the physical symptoms nausea, vomiting and retching over the past 12 h. The three-item PUQE is a reliable instrument to determine the severity of NVP (Koren et al., Reference Koren, Magee, Attard, Kohli, Atanackovic, Bishai, Chandra, Navoiz and Maltepe2001, Reference Koren, Boskovic, Hard, Maltepe, Navioz and Einarson2002). The Cronbach's α, reflecting the internal consistency of the Dutch PUQE, was α = 0.67 in the current study. The PUQE was used to assess NVP during the first trimester of pregnancy, consistent with the methods described by Lacasse and colleagues (Reference Lacasse, Rey, Ferreira, Morin and Bérard2008). The total score of the PUQE ranges from 3 to 15, with higher scores reflecting more severe NVP (Ebrahimi et al., Reference Ebrahimi, Maltepe, Bournissen and Koren2009). Since there is no widely established approach to measure the severity of symptoms of NVP, the PUQE scores were used as a continuous variable in the current study. High NVP, indicating the presence of elevated NVP symptoms, was defined as PUQE score >M + 1 s.d. (⩾9). There was no significant difference in the mean number of weeks of gestation at completion of the questionnaires between the 318 women with high NVP (M = 13.60, s.d. = 1.72) compared to the 1364 women without high NVP (M = 13.53, s.d. = 1.74): t = 0.65, p = 0.52, d = 0.040. Furthermore, there was also no significant difference in use of antibiotics or painkillers between the groups of woman with or without high NVP (data not shown).
In addition to the PUQE, the severity of NVP symptoms was also derived from a 57-item symptom checklist inquiring about the most common complaints during the first trimester of pregnancy (such as headache, back-pain, pelvic-pain, nausea and vomiting). NVP-related items were: ‘During the previous weeks of pregnancy, did you have symptoms of: 1. Nausea; 2. Nausea and vomiting?’. Women were asked to respond on a five-point Likert scale to these questions. The sum score of these two items correlated highly with the PUQE (r = 0.86, p < 0.001), indicating concurrent validity.
Between 12 and 14 weeks of gestation, before completing the PUQE, women were also asked whether they encountered serious medical problems during the first trimester of pregnancy that needed referral to a general practitioner (GP) and/or a gynaecologist for additional medical evaluation beyond regular monitoring by licensed midwives. This information was used to evaluate the possible occurrence of HG.
HCG and thyroid function
HCG, TSH, FT4 and thyroid peroxidase antibodies (TPO-Ab) were measured in lithium-heparin plasma using electrochemiluminescence assays (Cobas® e 601, Roche Diagnostics, Mannheim Germany). The within-laboratory coefficients of variation are: HCG: 3.1%; TSH: 2.1%; FT4: 3.5% and TPO-Ab: 7.1%. For hCG, levels ranged from 3500 to 310 000 mIU/mL. Because no specific reference range for hCG during pregnancy exists, we divided log hCG in quartiles, with high hCG defined as a hCG level in the upper quartile (hCG 75th percentile = 77 250 mIU/mL). Reference ranges of thyroid hormones during pregnancy are population dependent and are influenced by the applied assays (Medici et al., Reference Medici, Korevaar, Visser, Visser and Peeters2015). Therefore, the reference ranges of TSH and FT4 were determined by using the 2.5th and 97.5th percentiles as lower and upper reference limit assessed in TPO-Ab negative women (⩽35 IU/mL, n = 1528). Between 12 and 14 weeks of gestation reference ranges of 0.21–4.04 mU/L for TSH and 11.52−18.09 pmol/L for FT4 were obtained. Based on these reference ranges, groups with various thyroid (dys)function were discriminated: euthyroid women (TSH and FT4 both within reference range), overt hypothyroidism (TSH > 97.5th and FT4 < 2.5th percentile), subclinical hypothyroidism (TSH > 97.5th percentile and FT4 within normal reference range), overt hyperthyroidism (TSH < 2.5th and FT4 > 97.5th percentile) and subclinical hyperthyroidism (TSH < 2.5th percentile and FT4 within reference range).
Depression
The Edinburgh Depression Scale (EDS) was used to measure symptoms of depression during the first trimester (Cox et al., Reference Cox, Chapman, Murray and Jones1996). The EDS is the most widely used self-rating scale in the perinatal period to assess depressive symptoms. The EDS has previously been validated in the Netherlands during the postpartum period and for use during pregnancy with trimester specific cut-off values (Pop et al., Reference Pop, Komproe and van Son1992; Bergink et al., Reference Bergink, Kooistra, Lambregtse-van den Berg, Wijnen, Bunevicius, van Baar and Pop2011). According to Bergink and colleagues (Reference Bergink, Kooistra, Lambregtse-van den Berg, Wijnen, Bunevicius, van Baar and Pop2011), the EDS has good internal consistency during pregnancy, with a Cronbach's α coefficient reported of α = 0.82. Higher EDS scores indicate more depressive symptoms. A cut-off value of ⩾11 gives the best combination of sensitivity, specificity and positive predictive value for syndromal depression during the first trimester of pregnancy (Bergink et al., Reference Bergink, Kooistra, Lambregtse-van den Berg, Wijnen, Bunevicius, van Baar and Pop2011). Hence, to define elevated depressive symptoms (current depression), we used a cut-off value of EDS ⩾ 11, in addition to using continuous EDS scores. Cronbach's α of the EDS was α = 0.83 in the current study.
Covariates
Self-report data were used to document age, height, weight, education level, smoking status and use of medication. Body mass index (BMI) was calculated as kg/m2. Information regarding a history of depression, unplanned pregnancy and parity was also obtained using questionnaires (Truijens et al., Reference Truijens, Meems, Kuppens, Broeren, Nabbe, Wijnen, Oei, van Son and Pop2014).
Statistical analyses
Data are presented as mean ± standard deviation (s.d.) or frequency and percentage of total sample (%). The EDS and PUQE were normally distributed whereas hCG, TSH and FT4 were skewed and log-transformed (log 10) prior to statistical analyses. Considering the high number of women with complete data, the 94 participants with missing data on any of the variables were excluded from the analyses. Except for a significant younger age of these 94 women and a lower percentage of high level of education compared to respondents (small effect sizes), no differences in basic characteristics were found (data not shown). Univariate associations were explored between all variables. Pearson correlations were calculated for continuous variables (i.e. PUQE score, hCG, FT4, TSH, EDS score, age and BMI). Independent samples t tests were used for analysing dichotomous variables (i.e. history of depression, education level, smoking status, unplanned pregnancy and parity). Additionally, women were divided into subgroups based on hCG quartiles, thyroid (dys)function and the cut-off for depression. Possible differences in mean scores between groups were examined using independent samples t tests (two-tailed) or analysis of variances. To explore associations between categorical variables χ2 tests were used. Since large samples easily result in statistically significant differences between subgroups, effect sizes according to Cohen (Reference Cohen1992) are reported in addition to two-sided p-values. The magnitude of effect sizes is described as small, medium and large based on Pearson correlations of 0.1, 0.3 and 0.5 and for t tests based on Cohen's d of 0.2, 0.5 and 0.8, respectively.
Finally, a multiple logistic regression analysis [odds ratio (OR); 95% confidence interval (CI)] was conducted to test a psychobiological model with high NVP symptoms as outcome (dependent) variable. Depression, hCG and thyroid function were included as independent variables, adjusting for confounding variables (history of depression, age, BMI, education level, smoking status, unplanned pregnancy and parity).
Statistical analyses were performed using SPSS (Statistical Package for Social Sciences version 24; IBM, Chicago, IL, USA).
Results
Participant characteristics
Table 1 presents the demographic and clinical characteristics of the 1682 participating women included in this study.
Table 1. Characteristics of N = 1682 pregnant women included in the current study
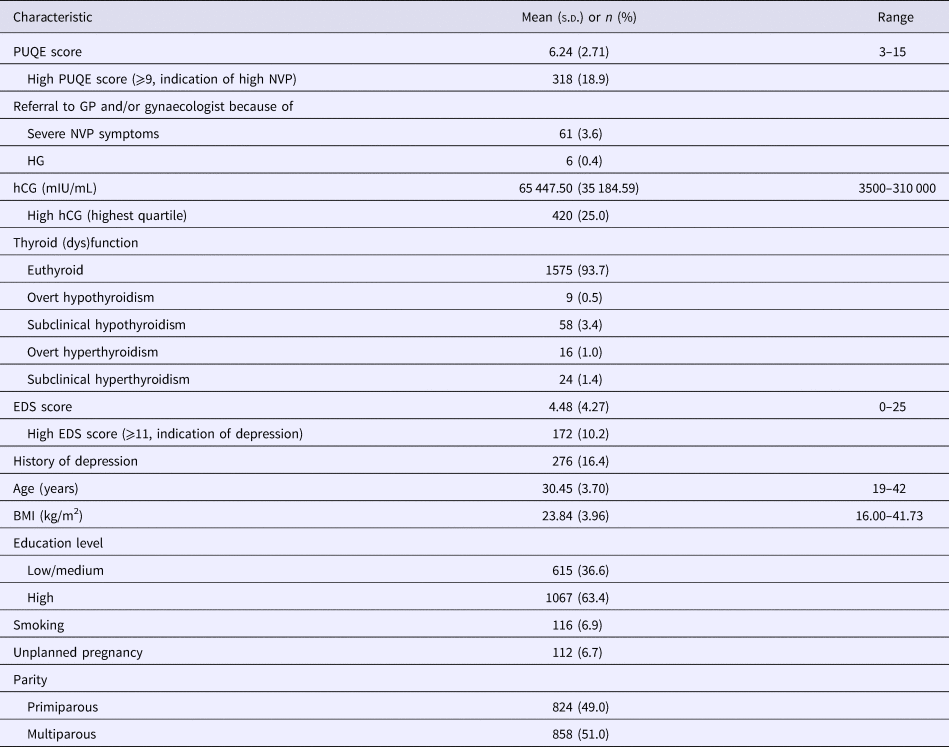
s.d., standard deviation; %, percentage; PUQE, Pregnancy-Unique Quantification of Emesis scale; high PUQE score, ⩾9 is an indication of high NVP (based on M + 1 s.d.); GP, general practitioner; NVP, nausea and vomiting during pregnancy; HG, hyperemesis gravidarum; high hCG, defined as hCG level in upper quartile; euthyroid, TSH and FT4 both within reference range; overt hypothyroidism, TSH > 97.5th and FT4 < 2.5th percentile; subclinical hypothyroidism, TSH > 97.5th percentile and FT4 within normal reference range; overt hyperthyroidism, TSH < 2.5th and FT4 > 97.5th percentile; subclinical hyperthyroidism, TSH < 2.5th percentile and FT4 within reference range; EDS, Edinburgh Depression Scale; high EDS score, ⩾11 is an indication of depression in the first trimester according to Bergink and colleagues (Reference Bergink, Kooistra, Lambregtse-van den Berg, Wijnen, Bunevicius, van Baar and Pop2011); BMI, body mass index; low/medium education level, primary education, VMBO, MAVO, MBO, HAVO and VWO (in Dutch education system); high education level, HBO and University (in Dutch education system).
High NVP (defined as PUQE ⩾ 9) was reported by 318 (18.9%) women. The mean PUQE score was 6.24 (s.d. = 2.71). A total of 252 women (15.0%) were referred to the GP and/or gynaecologist because of symptoms requiring additional medical attention. Of these referrals, 61 women (3.6% of the total sample) reported severe problems with nausea and vomiting. These 61 women had significantly higher mean PUQE scores (M = 10.74, s.d. = 2.32) compared to the 1430 women who did not report a serious medical problem (M = 6.03, s.d. = 2.58): t = 14.02, p < 0.001, d = 1.920. Six of these 61 women were hospitalised because excessive weight loss and dehydration due to severe vomiting during the first trimester. These women were classified as having experienced HG (6/1682 = 0.4%).
A total of 420 (25.0%) women had high hCG levels (defined as hCG level in the upper quartile; hCG 75th percentile = 77 250 mIU/mL). Significant correlations were observed between hCG with TSH (r = −0.21, p < 0.001) and FT4 (r = 0.25, p < 0.001). TSH was inversely correlated with FT4 (r = −0.37, p < 0.001). In total there were 1575 euthyroid women and 107 (6.3%) women with different classes of thyroid dysfunction (see Table 1).
The mean EDS score was 4.48 (s.d. = 4.27) and 172 (10.2%) women met criteria for current depression (EDS ⩾ 11). A history of depression was reported by 276 (16.4%) of the participants.
Association between hCG and thyroid (dys)function with NVP
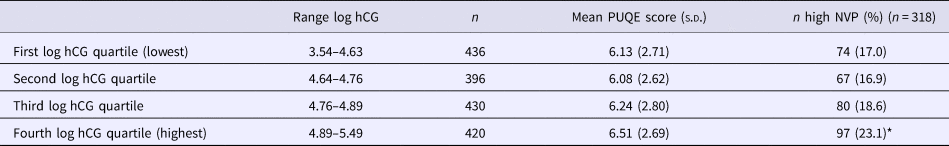
PUQE scores were significantly related to hCG levels (r = 0.06, p = 0.022). As shown in Table 2, the mean PUQE scores increased in the highest hCG quartiles, but the difference was not significant [F (3,1678) = 2.13, p = 0.094]. Women with high hCG (defined as hCG level in the upper quartile; n = 420) reported significantly more often high NVP (PUQE score ⩾ 9) compared to the women who did not have high hCG levels (defined as hCG level in lower three quartiles; n = 1262): OR = 1.42, 95% CI = 1.08–1.85. Moreover, the six women with HG were not well identified based on hCG (one hCG level of 250 000 mIU/mL, one hCG level of 125 000 mIU/mL and four hCG levels of <100 000 mIU/mL).
Table 2. Association between hCG with PUQE scores, N = 1682

PUQE, Pregnancy-Unique Quantification of Emesis scale; s.d., standard deviation; high NVP = PUQE score ⩾9 (based on M + 1 s.d.); %, percentage of women with high NVP in hCG quartile; *χ2 test with Yates continuity correction for hCG (high = upper quartile; low = lower three quartiles) and NVP (high = PUQE score ⩾9), p < 0.05.
PUQE scores were inversely related to TSH levels (r = −0.07, p = 0.004) and not with FT4 levels (r = 0.04, p = 0.15). The mean PUQE scores did not differ significantly between the different subgroups of thyroid (dys)function (data not shown). Also, no significant differences were found in the prevalence of high NVP between the thyroid dysfunction subgroups.
Association of depression with NVP
Depressive symptoms correlated positively with NVP (r = 0.23, p < 0.001). Women with depression between 12 and 14 weeks of gestation (defined as EDS score ⩾11, n = 172) had significantly higher mean PUQE scores (M = 7.38, s.d. = 2.97) compared to those with low depression scores (n = 1510, M = 6.11, s.d. = 2.65): t = 5.86, p < 0.001, d = 0.451.
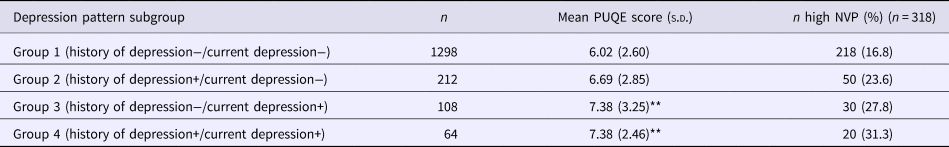
Women who reported a history of depression had significantly higher mean EDS scores between 12 and 14 weeks of gestation (n = 276, M = 6.59, s.d. = 5.04) compared to those who did not report such an episode (n = 1406, M = 4.07, s.d. = 3.97): t = 7.86, p < 0.001 d = 0.555. Women who reported a history of depression reported higher PUQE scores (M = 6.85, s.d. = 2.77), compared to those who did not (M = 6.12, s.d. = 2.68): t = 4.09, p < 0.001, d = 0.268. Table 3 displays results for participants with current depression and/or a history of depression.
Table 3. PUQE scores and number of women according to a history of depression and EDS cut-off for depression between 12 and 14 weeks of gestation, N = 1682

PUQE, Pregnancy-Unique Quantification of Emesis scale; EDS, Edinburgh Depression Scale; s.d., standard deviation; high NVP, PUQE score ⩾ 9 (based on M + 1 s.d.); %, percentage of women with high NVP in subgroup of depression pattern; current depression, EDS score ⩾ 11 is an indication of depression in the first trimester according to Bergink and colleagues (Reference Bergink, Kooistra, Lambregtse-van den Berg, Wijnen, Bunevicius, van Baar and Pop2011); **a two-way between-groups analysis of variance revealed only a significant main effect for depression between 12 and 14 weeks of gestation (current depression+), p < 0.001.
As shown in Table 3, the mean PUQE scores were the lowest in the reference group (group 1: no history of depression and no current depression) and the highest in group 3 and group 4 (current depression groups). A two-way between-groups analysis of variance revealed only a significant main effect for depression between 12 and 14 weeks of gestation, F (1,1678) = 19.31, p < 0.001, η p2 = 0.011. The main effect for a history of depression and the interaction effect were not significant (data not shown). Moreover, we also explored the percentage of women with high NVP for each of the four depression pattern subgroups. A χ2 test revealed a significant association between subgroup and high NVP, χ2 (3, N = 1682) = 18.71, p < 0.001, V = 0.105. Post-hoc analyses showed significantly less than expected women reporting high NVP in the reference group. However, in the groups with a current depression (groups 3 and 4) a significantly higher percentage of women reported high NVP.
Multivariable analyses
A two-way between-groups analysis of variance was used to investigate the relation of a combination of high hCG (hCG upper quartile used as cut-off) and depression (EDS score ⩾11 used as cut-off) between 12 and 14 weeks of gestation with NVP symptoms as dependent variable. Figure 1 shows mean PUQE scores for the four subgroups that were formed; group 1: women without elevated hCG and without depression [hCG−/D−, M = 6.03, standard error of the mean (s.e.m.) = 0.08], group 2: women with high hCG and without depression (hCG+/D−, M = 6.36, s.e.m. = 0.14), group 3: women without high hCG and with depression (hCG−/D+, M = 7.22, s.e.m. = 0.27) and group 4: women with high hCG and with depression (hCG+/D+, M = 7.82, s.e.m. = 0.39). As can be seen in Fig. 1, mean PUQE scores were the lowest in group 1 (hCG−/D−) and the highest in group 4 (hCG+/D+). A main effect for depression was found, F (1,1678) = 29.18, p < 0.001, η p2 = 0.017. The main effect for high hCG and the interaction effect were not significant (data not shown).
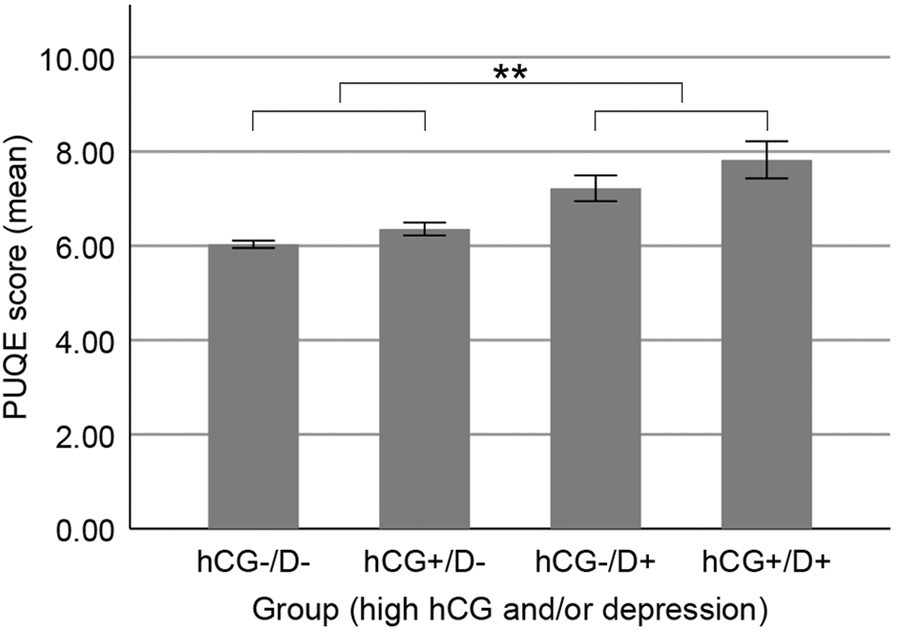
Fig. 1. The severity of NVP symptoms as related to elevated hCG and/or depressive symptoms. NVP, nausea and vomiting during pregnancy; PUQE, Pregnancy-Unique Quantification of Emesis scale; hCG+ = high hCG, defined as hCG level in the upper quartile; D+ = depression, defined as EDS score ⩾11 in the first trimester as an indication of depression according to Bergink and colleagues (Reference Bergink, Kooistra, Lambregtse-van den Berg, Wijnen, Bunevicius, van Baar and Pop2011); **a two-way between-groups analysis of variance revealed a main effect of depression, p < 0.001 (error bars reflect standard error of the mean).
A multiple logistic regression analysis with high NVP (PUQE ⩾ 9 used as cut-off) as dependent variable, and high hCG (hCG upper quartile used as cut-off), (sub)clinical hyperthyroidism and depression between 12 and 14 weeks of gestation (EDS score ⩾ 11 used as cut-off) as independent variables was performed, adjusting for history of depression, age, BMI, education level, smoking status, unplanned pregnancy and parity. Because evidence suggests that NVP occurs more frequently in women with hyperthyroidism during early gestation, (sub)clinical hyperthyroidism (n = 40) was entered as an additional covariate in the model [i.e. women with overt hyperthyroidism (TSH < 2.5th and FT4 > 97.5th percentile) or subclinical hyperthyroidism (TSH < 2.5th percentile and FT4 within reference range)].
The multivariate model containing all biological, psychological and demographic measures was significant: χ2(5, N = 1682) = 63.49, p < 0.001. As shown in Table 4, depression and high hCG were independently related to high NVP while (sub)clinical hyperthyroidism was not. Moreover, the confounders history of depression, younger age and multiparity were also significantly and independently related to high NVP. The strongest predictor of high NVP was a high EDS score (i.e. ⩾11, indication of depression) between 12 and 14 weeks of gestation, with an OR of 1.67 (95% CI = 1.15–2.43; see Table 4).
Table 4. Adjusted ORs for the association of psychological and biological factors associated with high NVP scores, N = 1682
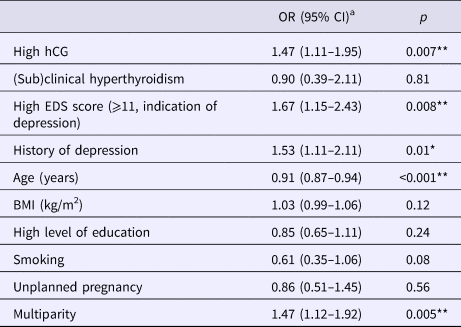
aORs are based on the multivariable model in which high NVP is the dependent variable and all other variables are the mutually adjusted independent variables.
High NVP, PUQE score ⩾ 9 (based on M + 1 s.d.); OR, adjusted odds ratio; CI, confidence interval; high hCG, defined as log hCG level in upper quartile; (sub)clinical hyperthyroidism = women with overt hyperthyroidism (TSH < 2.5th and FT4 > 97.5th percentile) or subclinical hyperthyroidism (TSH < 2.5th percentile and FT4 within reference range), reference limits assessed in TPO-Ab negative women (⩽35 IU/mL); EDS, Edinburgh Depression Scale; high EDS score, ⩾11 is an indication of depression in the first trimester according to Bergink and colleagues (Reference Bergink, Kooistra, Lambregtse-van den Berg, Wijnen, Bunevicius, van Baar and Pop2011); BMI, body mass index; high level of education, HBO/University (in Dutch education system); **p < 0.01, *p < 0.05.
Discussion
The current study showed that high hCG levels as well as a history of depression and elevated depressive symptoms between 12 and 14 weeks of gestation are independently related to NVP in the first trimester of pregnancy. Also, multiparous women and younger women had an increased risk of reporting high NVP. Thyroid function, more specifically (sub)clinical hyperthyroidism, was not related to high NVP. These findings indicate that hCG and depression have additive effects on NVP during pregnancy.
We found a significant correlation between hCG and the severity of NVP, but the magnitude of this association was small (r = 0.06, p = 0.022). This finding is consistent with the variability of the correspondence between hCG and HG reported in the literature (Niebyl, Reference Niebyl2010; O'Donnell et al., Reference O'Donnell, McParlin, Robson, Beyer, Moloney, Bryant, Bradley, Muirhead, Nelson-Piercy, Newbury-Birch, Norman, Simpson, Swallow, Yates and Vale2016). Moreover, more than half of the 0.4% women with HG showed only moderately elevated pregnancy hCG levels, although this observation is limited to six women. The combination of high hCG levels with depression may be important to identify women at risk of developing NVP during pregnancy.
The finding that (low) TSH was not related to NVP might be explained by hCG acting as a thyroid regulator during pregnancy, because of the production of sub-units of hCG that are potent stimulators of the thyroid gland (Glinoer, Reference Glinoer1997; Verberg et al., Reference Verberg, Gillott, Al-Fardan and Grudzinskas2005). In conjunction with this, we found a significant but modest relation between TSH and hCG. Also, the regression analysis showed that high hCG rather than (sub)clinical hyperthyroidism (low TSH and normal to high FT4) was related to high NVP.
Regarding psychological determinants, nausea is a potential somatisation symptom of distress and depression in general (Walker et al., Reference Walker, Roy-Byrne and Katon1990; Haug et al., Reference Haug, Mykletun and Dahl2002). Therefore, when assessing the severity of NVP it is important to adjust for the existence of (symptoms of) depression. The current study confirmed that depression, before pregnancy and between 12 and 14 weeks of gestation, is related to high NVP. This is in line with the theory of a cognitive component of NVP (Goodwin, Reference Goodwin2002). It is also possible that depression is ‘reactive’ to NVP. The multivariable analysis investigating the combined effect of high hCG and depression between 12 and 14 weeks of gestation showed that NVP symptoms were higher in women with depression, regardless of the hCG level. Moreover, high EDS between 12 and 14 weeks of gestation was the strongest predictor of high NVP. These findings indicate that a psychobiological model is needed to optimally explain NVP.
The observed association between younger age and high NVP has been reported in the literature before (Klebanoff et al., Reference Klebanoff, Koslowe, Kaslow and Rhoads1985). The literature regarding an association of NVP with parity is inconclusive: both primiparity (Klebanoff et al., Reference Klebanoff, Koslowe, Kaslow and Rhoads1985; Latva-Pukkila et al., Reference Latva-Pukkila, Isolauri and Laitinen2010) and multiparity (Källén et al., Reference Källén, Lundberg and Åberg2003) have been reported as determinants for NVP. However, studies that found a relation with primiparity suffered from methodological flaws, such as operationalising NVP by reporting only one symptom of nausea or vomiting. Moreover, inconclusive data were used to define parity (gravidity instead of parity) resulting in difficulty to compare data of the existing literature (Einarson et al., Reference Einarson, Navioz, Maltepe, Einarson and Koren2007). We found multiparity to be significantly related to high NVP. The finding that women who report NVP in one pregnancy are more likely to report NVP in subsequent pregnancies, supports this (Klebanoff et al., Reference Klebanoff, Koslowe, Kaslow and Rhoads1985; Einarson et al., Reference Einarson, Navioz, Maltepe, Einarson and Koren2007). We found no relation between high NVP and smoking status, BMI or unplanned pregnancies. In the literature, conflicting results are mentioned regarding these factors. Källén and colleagues (Reference Källén, Lundberg and Åberg2003) found that in particular smoking before pregnancy is associated with a decreased risk for NVP. We only assessed smoking status during pregnancy, what might explain why we did not find a relation. Regarding BMI, our sample had relatively few women with mild obesity [8.7%, BMI (kg/m2) > 30] or extreme obesity [0.2%, BMI (kg/m2) > 40] compared to the general population in The Netherlands (National Institute for Health and Environment, 2017), resulting in low statistical power to detect weight-related factors involved in NVP.
A unique strength of the current study is the inclusion of both biological and psychological factors into one design. In addition, the operationalisation of these factors is a major strength of the current study. That is, instead of using the PUQE-12 for the previous 12 h, we used the PUQE evaluating the severity of NVP symptoms during the entire first trimester. A study of Lacasse and colleagues (Reference Lacasse, Rey, Ferreira, Morin and Bérard2008) underlined the use of a modified index that covers the entire first trimester because of substantial concordance with the PUQE-12 and the relationship with QOL. We consider this approach as a more reliable way of looking at a possible relation between endocrine factors and NVP. HCG shows a gradual increase from conception until 10–14 weeks of gestation (Niebyl, Reference Niebyl2010). Similarly, the pregnancy specific changes of thyroid hormones do occur over a period of weeks rather than hours (Glinoer, Reference Glinoer1997). Evaluating a possible association between hCG, thyroid function and NVP during a period of hours does not reflect the physiological pattern of hCG and/or thyroid hormones. Also, if the PUQE questions would have been restricted to the previous 12 h, women who had serious symptoms of nausea and vomiting earlier during pregnancy, including the women with HG, would not have been able to correctly report symptoms of NVP. No Cronbach's α of the English PUQE could be found in the literature, which makes it difficult to compare with the reliability of the original PUQE. An α of 0.85 is found in a study of Birkeland and colleagues (Reference Birkeland, Stokke, Tangvik, Torkildsen, Boateng, Wollen, Albrechtsen, Flaatten and Trovik2015), using a translated Norwegian PUQE. However, these investigators used a small sample of hospitalised women due to HG. We investigated a large sample of healthy pregnant women with a whole spectrum of NVP symptoms. The relatively low internal consistency of α = 0.67 in the current study partially reflects the short (three-item) scale format of the PUQE as this metric is dependent on the number of items in a scale.
Another strength of the study is the large sample of 1682 women that was fairly representative for the general pregnant population in The Netherlands, regarding important (obstetric) features such as unplanned pregnancy, age and depression (Central Office of Statistics, 2015, 2017). With regard to ethnic subgroups and education, the current cohort is not optimally representative of the general population. Only women with understanding of the Dutch language were included. The high number of highly educated women in the current study should be regarded in light of their age and the area where the study was undertaken. The education level for all women living around Eindhoven at this (young) age is approximately equal to that of women in the used sample (Central Office of Statistics, 2017). The finding in the current study that education level was not related to high NVP is in line with other reports (Koren et al., Reference Koren, Boskovic, Hard, Maltepe, Navioz and Einarson2002).
This study has also limitations. First, we did not ask about nutritional intake habits and did not evaluate the possible impact of diet on NVP. In addition, the cut-off value for hCG (75th percentile) may be sample-specific. However, this sample is comparable to the general obstetric practice in The Netherlands. The correspondence of hCG values between the sample of the current study and a previous study of 568 pregnant women from the same area, substantiates this (Pop et al., Reference Pop, Broeren, Wijnen, Endendijk, van Baar, Wiersinga and Williams2018). Both studies used similar hCG assessment methods and similar in- and exclusion criteria. Furthermore, we used a large population-based study of 8195 pregnant women in The Netherlands (Korevaar et al., Reference Korevaar, Steegers, de Rijke, Schalekamp-Timmermans, Visser, Hofman, Jaddoe, Tiemeier, Visser, Medici and Peeters2015) as a reference and found similar hCG values (current study: Md = 58 000 IU/L; Korevaar and colleagues: Md12 weeks = 56 004 IU/L, Md13 weeks = 52 367 IU/L, Md14 weeks = 47 267 IU/L). As far as we know, there are no internationally agreed upon normative data for hCG in the first trimester of pregnancy. Finally, the use of a cross-sectional design prevents us from drawing any causal relationships. For example, women who reported serious problems resulting in referral to their GP and/or gynaecologist in the weeks before completing the PUQE showed higher depression scores between 12 and 14 weeks of gestation. It is unclear whether they were depressed as a result of previously occurring severe NVP symptoms or because of other reasons. Additional research is needed to further understand the pathophysiology of NVP, to decide what biological factors contribute to the aetiology of NVP and to explore what pathway relates NVP to depression. For example, it would be interesting to examine the possible influence of cortisol as a hypothalamic–pituitary axis hormone in addition to TSH and FT4. Since NVP is thought to be multifactorial, prospective research should analyse different biological and psychological variables in one design to ascertain the determinants of NVP. Other psychological factors, for example anxiety, could be examined in relation to NVP as well. Our findings support the theory of a cognitive component in NVP and emphasise the need for a multidisciplinary approach. From a clinical perspective, the observed association between elevated depressive symptoms and NVP indicates that monitoring, and when needed treating, depression may have beneficial effects for NVP. Screening for depressive symptoms in women with NVP and referral for psychological interventions could possibly lead to a reduction of symptoms of NVP and thereby less reduction of QOL, limitation of functioning and costs.
In conclusion, the current study shows that both hCG and psychological factors are related to the severity of NVP. This underlines the need for using a psychobiological model for future NVP research and clinical interventions.
Author ORCIDs
Guus W.F. Dekkers, 0000-0003-2833-7433.
Acknowledgements
We thank all the midwives of the participating midwifery practices around Eindhoven for contributing to the recruitment of participants.
Financial support
This research received no specific grant from any funding agency, commercial or not-for-profit sectors.
Conflict of interest
None.
Ethical standards
The authors assert that all procedures contributing to this work comply with the ethical standards of the relevant national and institutional committees on human experimentation and with the Helsinki Declaration of 1975, as revised in 2008.