Introduction
Depressive disorders as defined by the Diagnostic and Statistical Manual of Mental Disorders (DSM), fourth edition, text revision (DSM-IV-TR) typically present in adolescence or early adult life, can be chronic or episodic and are frequently recurrent and co-morbid with substance abuse or other mental and physical health conditions (APA, 2000). The burden attributed to depressive disorders worldwide is a major public health concern. The Global Burden of Disease (GBD), Injuries, and Risk Factors Study measures disease burden in terms of the disability-adjusted life year (DALY). This is the sum of years of life lost due to premature mortality (YLL) and years of life lived with a disability (YLD) (Murray & Lopez, Reference Murray and Lopez1996). The GBD 1990 study reported that depressive disorders were the fourth leading cause of burden, accounting for 3.7% of DALYs in 1990 (Murray & Lopez, Reference Murray and Lopez1996). By 2000 they were the third leading cause of burden, accounting for 4.3% of DALYs, and the leading cause of disability, accounting for 13.4% of YLDs in women and 8.3% in men (Üstün et al. Reference Üstün, Ayuso-Mateos, Chatterji, Mathers and Murray2004).
Our understanding of the public health importance of mental disorders, including their impact on other health conditions (Prince et al. Reference Prince, Patel, Saxena, Maj, Maselko, Phillips and Rahman2007; Collins et al. Reference Collins, Patel, Joestl, March, Insel, Daar, Anderson, Dhansay, Phillips, Shurin, Walport, Ewart, Savill, Bordin, Costello, Durkin, Fairburn, Glass, Hall, Huang, Hyman, Jamison, Kaaya, Kapur, Kleinman, Ogunniyi, Otero-Ojeda, Poo, Ravindranath, Sahakian, Saxena, Singer and Stein2011), will be enhanced by the GBD 2010 study currently underway (Murray et al. Reference Murray, Lopez, Black, Mathers, Shibuya, Ezzati, Salomon, Michaud, Walker and Vos2007). This will quantify burden for over 220 diseases (including 11 mental disorders) by country and 21 world regions for the years 1990, 2005 and 2010. It will use significantly improved methodology compared with the GBD 1990 study, including more representative disability weight estimations (see http://www.globalburden.org/). In the GBD 2010 study, a dimensional approach is being taken, with burden being calculated for major depressive disorder (MDD), i.e. one or more major depressive episodes (MDEs) using three severity levels, and dysthymia separately. This will enable burden estimates to encapsulate differences in morbidity within and between depressive disorder subtypes (Salomon et al. Reference Salomon, Murray, Üstün, Chatterji, Murray and Evans2003; Global Burden of Disease, 2009; Salomon, Reference Salomon2010).
To quantify the morbidity (i.e. YLD) attributable to MDD in the GBD 2010 study, epidemiological data were required to describe the disease occurrence and course of illness (see Supplementary Appendix 1 for definitions of the data required). Although there is a wealth of literature on the different epidemiological parameters of MDD, this has yet to be systematically summarised at a global level. Aside from informing the GBD 2010 study, such an integrated summary has both clinical and public health applications (Kessler, Reference Kessler1999; Wittchen, Reference Wittchen2000; Skapinakis & Lewis, Reference Skapinakis and Lewis2001). However, this task is complicated by the presence of significant heterogeneity in the data. Heterogeneity refers to both the variability in epidemiological estimates resulting from true differences in the epidemiology of MDD and the variability produced by differences in the methodology used to capture data (Weich & Araya, Reference Weich and Araya2004; Bromet et al. Reference Bromet, Andrade, Hwang, Sampson, Alonso, de Girolamo, de Graaf, Demyttenaere, Hu, Iwata, Karam, Kaur, Kostyuchenko, Lepine, Levinson, Matschinger, Mora, Browne, Posada-Villa, Viana, Williams and Kessler2011).
Literature reviews on the prevalence and incidence of MDD have consistently raised the issue of heterogeneity. The GBD 2000 update estimated that the 12-month prevalence of a MDE was 1.6% in males and 2.5% in females. Predicted (from prevalence estimates) annual incidence was 3.2% in males and 4.9% in females (Üstün et al. Reference Üstün, Ayuso-Mateos, Chatterji, Mathers and Murray2004). An analytical review of the GBD 2000 update concluded that there was a lack of data on unipolar depression and significant heterogeneity across epidemiological estimates (Brhlikova et al. Reference Brhlikova, Pollock and Manners2010).
Paykel and collaborators' review of MDD in Europe reporting a 12-month prevalence of 5% also revealed significant gaps in the literature. The incidence of MDD was unclear because of the lack of longitudinal follow-up of cases and there were limited data from Eastern Europe (Paykel et al. Reference Paykel, Brugha and Fryers2005). Another review investigating the prevalence of MDD in the USA, Canada, Puerto Rico, France, West Germany, Italy, Lebanon, Taiwan, Korea and New Zealand revealed significant regional variation in prevalence. The 12-month prevalence of MDD ranged from 0.8% in Taiwan to 5.8% in New Zealand (Weissman et al. Reference Weissman, Bland, Canino, Faravelli, Greenwald, Hwu, Joyce, Karam, Lee, Lellouch, Lepine, Newman, Rubio-Stipec, Wells, Wickramaratne, Wittchen and Yeh1996). Explaining this regional variation is difficult, given differences in the methodology used by the different studies (Weich & Araya, Reference Weich and Araya2004).
In an attempt to control for this, the World Mental Health Survey (WMHS) Consortium conducted population surveys in 28 countries using a standard protocol for data collection and assessment. The World Health Organization's Composite International Diagnostic Interview (CIDI) was used to diagnose cases of MDE (Bromet et al. Reference Bromet, Andrade, Hwang, Sampson, Alonso, de Girolamo, de Graaf, Demyttenaere, Hu, Iwata, Karam, Kaur, Kostyuchenko, Lepine, Levinson, Matschinger, Mora, Browne, Posada-Villa, Viana, Williams and Kessler2011). Results revealed regional variation in the 12-month prevalence of a MDE, ranging from 2.2% in Japan to 10.4% in Brazil with similar averages of 5.5% in developed and 5.9% in developing countries. The average duration of an episode estimated from WMHS ranged from 23.1 to 33.8 weeks (Kessler & Üstün, 2008; Seedat et al. Reference Seedat, Scott, Angermeyer, Berglund, Bromet, Brugha, Demyttenaere, de Girolamo, Haro, Jin, Karam, Kovess-Masfety, Levinson, Medina Mora, Ono, Ormel, Pennell, Posada-Villa, Sampson, Williams and Kessler2009; Bromet et al. Reference Bromet, Andrade, Hwang, Sampson, Alonso, de Girolamo, de Graaf, Demyttenaere, Hu, Iwata, Karam, Kaur, Kostyuchenko, Lepine, Levinson, Matschinger, Mora, Browne, Posada-Villa, Viana, Williams and Kessler2011). These differences may reflect true regional variability in the epidemiology of MDE. However, despite WMHS's standardised procedure, some limitations were reported. Notably, validation exercises involving the CIDI have been completed almost entirely in western countries; hence its cross-cultural reliability and validity remain unclear (Simon et al. Reference Simon, Goldberg, Von Korff and Üstün2002; Wang et al. Reference Wang, Aguilar-Gaxiola, Alonso, Angermeyer, Borges, Bromet, Bruffaerts, de Girolamo, de Graaf, Gureje, Haro, Karam, Kessler, Kovess, Lane, Lee, Levinson, Ono, Petukhova, Posada-Villa, Seedat and Wells2007; Bromet et al. Reference Bromet, Andrade, Hwang, Sampson, Alonso, de Girolamo, de Graaf, Demyttenaere, Hu, Iwata, Karam, Kaur, Kostyuchenko, Lepine, Levinson, Matschinger, Mora, Browne, Posada-Villa, Viana, Williams and Kessler2011).
The aim of this paper is to summarise the global prevalence and incidence of MDD, exploring the global distribution and sources of heterogeneity and, where feasible, adjusting for variability caused by differences in study methodology and design. This will help identify true differences in the global distribution of MDD that need to be considered in the integration of the epidemiological data. This work was undertaken by the GBD Mental Disorders Research Group (http://www.qcmhr.uq.edu. au/BODP).
Method
Literature review
The systematic review adhered to guidelines recommended by the Preferred Reporting Items for Systematic Reviews and Meta-Analyses (PRISMA) statement (Moher et al. Reference Moher, Liberati, Tetzlaff and Altman2009). Electronic databases Medline (via CSA), PsycINFO and EMBASE were used. Search strings were derived in consultation with a research librarian. See http://www.gbd.unsw.edu.au/gbdweb.nsf/resources/MD_Pt2_SearchStrings/$file/MDSearch + strings_2.pdf for more information on the search strings. Publications in languages other than English were included. Although the search was limited to studies published between 1980 and 2007, we have continued to capture additional studies up to 2011 through continuing perusal of the literature and correspondence with experts in the field.
Inclusion and exclusion
Population-based surveys representative of the community, region or country were included. Non-representative subsets of the population such as samples based on in-patient admissions or treatment trials were excluded. Studies adhering to DSM or International Classification of Diseases (ICD) diagnostic classifications were preferred to allow for better consistency in the measurement of MDD; however, studies using symptom scales that only broadly map on to DSM/ICD diagnostic thresholds were included for comparison. Where the same data were reported across different papers the most informative paper was selected.
For prevalence, we included studies reporting point (i.e. current or past-month prevalence), 6- and/or 12-month prevalence. Lifetime estimates were excluded, as these are more prone to recall bias (Simon & VonKorff, Reference Simon and VonKorff1995; Kruijshaar et al. Reference Kruijshaar, Barendregt, Vos, de Graaf, Spijker and Andrews2005; Moffitt et al. Reference Moffitt, Caspi, Taylor, Kokaua, Milne, Polanczyk and Poulton2010; Susser & Shrout, Reference Susser and Shrout2010). Estimates of MDD were the focus; however, if studies reported estimates of depression not otherwise specified (NOS) these were included for comparison. Studies reporting incidence hazards were included (i.e. those with person-years of follow-up in the denominator). Estimates of probability such as cumulative incidence based on longer risk intervals were excluded.
Extraction
Data extracted included information on the country and year of study, parameter value and type (point, 12-month prevalence), sample coverage (community, regional, national), sample urbanicity (rural, urban, mixed), sex (male, female, persons), age range, case ascertainment period (recorded as the midyear time point), response rate, depression subtype (MDD or MDD + depression NOS), diagnostic criteria (ICD, DSM) and survey instrument (diagnostic instruments, symptom scales). Countries were stratified into regions based on the GBD categorization of regions (see http://www.globalburden.com.au/project-description). Forced entry of key variables was required for quality assurance. A random sample of papers was reviewed by two researchers to check consistency of data extraction. Where differences occurred, reviewers discussed these with the study's primary investigator (H.A.W.) to arrive at a consensus.
Uncertainty [standard error (s.e.) or confidence interval] pertaining to each prevalence or incidence estimate was extracted if reported or otherwise calculated. If the denominator (sex- and/or age-specific sample size) was reported, s.e. was calculated using s.e. = √2.1 × (P × (1 – P)/N), where P is the proportion of cases reported, 2.1 is the average design effect and N is the denominator. The average design effect accounted for any increase in uncertainty produced by a study's sampling methodology. It was calculated based on a sample of 110 design effects from the GBD Mental Disorders Research Group's affective disorders dataset. If the denominator was not reported by age and sex, the United Nation's country-, sex-, age- and year-specific population size was used to distribute the overall sample size across age and sex categories (United Nations, 2007).
Analysis
Prevalence
For prevalence, Stata II.2 software (StataCorp LP, USA) was used to conduct a meta-regression (Sterne et al. Reference Sterne, Egger, Sutton, Egger, Smith and Altman2008) to help explain the variability between studies. We based our statistical methodology on previous applications of meta-regression to explore the effect of methodological and ecological variables on prevalence (Van Houwelingen et al. Reference Van Houwelingen, Arends and Stijnen2002; Sterne et al. Reference Sterne, Egger, Sutton, Egger, Smith and Altman2008; Baker et al. Reference Baker, White, Cappelleri, Kluger and Coleman2009). Since the distribution of prevalence estimates was positively skewed, logarithmic transformation (natural log) was applied to meet the parametric assumption of normality (Tabachnick & Fidell, Reference Tabachnick and Fidell2007).
Results from the meta-regression guided the stratification of pooled prevalence estimates in the subsequent meta-analysis (Sterne et al. Reference Sterne, Egger, Sutton, Egger, Smith and Altman2008). As it is essential for GBD purposes to avoid any overestimation in burden estimates, point prevalence is considered as the ‘gold standard’ as it is less susceptible to recall bias compared with estimates of period prevalence (Global Burden of Disease, 2009). For this reason, it was also set as the primary summary measure here as well as in the upcoming GBD disease modelling of MDD for which this literature review was undertaken.
Statistical heterogeneity was quantified using the I 2 statistic, which indicates the total variation in the data attributable to heterogeneity (Higgins et al. Reference Higgins, Thompson, Deeks and Altman2003). A random-effects model was selected over the fixed-effects model to accommodate for heterogeneity (DerSimonian & Laird, Reference DerSimonian and Laird1986; DerSimonian & Kacker, Reference DerSimonian and Kacker2007). We used the post-estimation ‘predict’ command to estimate overall prevalence by region, accommodating for methodological factors. This command fitted a value to each reported prevalence estimate and the associated s.e. based on the coefficients from the meta-regression.
Incidence
Similar methods of pooling incidence were used as described for prevalence. However, the paucity of incidence estimates did not permit us to conduct a meta-regression.
Results
Out of 32 579 data sources on the epidemiology of MDD, only 120 studies fitted the inclusion criteria for prevalence and incidence. The search and main reasons for exclusion are summarized in Fig. 1. A summary of the studies included for each parameter is given in Supplementary Appendix 2.

Fig. 1. Flowchart showing results of the systematic review for the prevalence and incidence of major depressive disorder.
Prevalence
A total of 116 studies reporting the prevalence of MDD were included, the majority of which were from western countries, i.e. Europe and North America (n = 74). We identified 11 studies reporting both MDD and depression NOS and 22 studies using a symptom scale. There was considerable variability between estimates. Point prevalence ranged from 0.05% in males from Japan aged 65 years or older (Ihara et al. Reference Ihara, Muraoka, Oiji and Nadaoka1998) to 73% in females from Afghanistan aged 15 years or older (Lopes Cardozo et al. Reference Lopes Cardozo, Bilukha, Gotway, Wolfe, Gerber and Anderson2005).
To maximize inclusion, potential outliers in the dataset with no salient methodological limitation were retained and investigated further through the meta-regression. To ensure independence of observations, where person- as well as sex-specific estimates were reported by the same study, only the latter were included in analyses. Where age-specific and overall-age estimates were reported, only the latter were included. Where only age-specific estimates were reported, these were combined to calculate the overall-age prevalence, i.e. the summed number of cases across each age group was divided by the summed denominator across each age group. This reduced the final dataset from 783 to 274 prevalence estimates. To investigate the effect of age on prevalence, estimates were grouped into four broad categories: whole age range (e.g. 0–99 years), <18 years, 18–65 years and >65 years. Where reported age ranges could fit into more than one category they were allocated to the most representative one on a case-by-case basis.
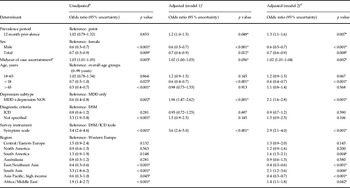
In the meta-regression, study-level variables were inserted in the model first (model 1), and the country-level variable (region) second (model 2). Coverage and urbanicity variables were excluded from both models as they were signficantly correlated with the majority of other variables, particularly with the region variable, which is a major focus of this paper. Model 1 explained 43.1% of the between-study variance (adjusted R 2 43.1%, F 11,265 = 16.9, p < 0.001). Prevalence type, sex, midyear of case ascertainment, age range, depression subtype and survey instrument were statistically significant determinants of reported prevalence (Table 1). Diagnostic criteria were not significantly associated with prevalence.
Table 1. Results of meta-regression models showing odds ratios for reported prevalence by study- and country-level determinantsa

MDD, Major depressive disorder; NOS, not otherwise specified; DSM, Diagnostic and Statistcal Manual of Mental Disorders (APA, 2000); ICD, International Classification of diseases (World Health Organization, 1992).
a The response rate variable was exlcuded from the model as it did not contribute to the overall variance explained.
b Unadjusted results represent meta-regression ran on indiviual variables without countrolling for the effect of others.
c Adjusted model 1 results represent meta-regression ran on study-level variables only.
d Adjusted model 2 results represent meta-regression ran on study- and country-level variables.
e Midyear of case ascertainment modelled as a continuous variable.
* Statistically significant at p < 0.05.
Prevalence was statistically higher for past year prevalence compared with point, in females compared with males and persons, in studies capturing MDD and depression NOS compared with MDD alone, and in studies with more recent case ascertainments. Persons under 18 years had lower prevalence than persons across the overall age group and studies that used symptom scales reported a higher prevalence than studies where DSM or ICD criteria were used. The survey instrument variable was originally made up of eight categories, summarizing the most frequent instruments in the dataset. The CIDI was used as the reference as it was the most commonly reported. This variable was dichotomized in the final model because symptom scales were the only instruments to yield signicantly different prevalence estimates at p < 0.001. Results were similar when clinical interview (interviews conducted by a clinician) were used instead of the CIDI as the reference, with only symptoms scales (p < 0.001) and the Geriatric Mental State Schedule (p < 0.041) yielding statistically significant results.
The inclusion of the region variable in model 2 explained an additional 14.6% of the between-study variance. The overall variance explained by study- and country-level variables combined was 57.7% (adjusted R 2 57.7%, F 19,257 = 16.5, p < 0.001). Prevalence period, sex, midyear of case ascertainment, depression subtype, survey instrument and age range remained statistically significant determinants of reported prevalence in model 2. When Western Europe, the region with the most data, was set as the reference, a statistically significant effect of region emerged such that prevalence from South America, South Asia and Africa/Middle East was statistically higher than prevalence from Western Europe. Estimates from East/Southeast Asia and Asia Pacific (high income) were statistically lower. Similar results were obtained when North America was used as the reference, except that South America and North Africa/Middle East no longer yielded statistically higher prevalence.
A series of meta-analyses was used to further illustrate the effect of statistically significant determinants of prevalence. Reported prevalence was pooled according to each statistically significant study-level determinant (Table 2). For each determinant, reported prevalence was also pooled by sex, but there were insuffient data to simultaneously stratify prevalence by all other determinants. To address this limitation, prevalence was also predicted for each region while adjusting for the effects of study-level determinants in model 2 (Fig. 2). Although reduced, cross-national differences in prevalence persisted after adjusting for study-level determinants of prevalence. Notably, although adjusted downwards, estimates from South Asia and Africa/Middle East remained the highest in the dataset, and although adjusted upwards, estimates from East/Southeast Asia remained amongst the lowest. Estimates from Asia Pacific were no longer amongst the lowest. The adjusted and unadjusted prevalence by region is summarised in Supplementary Appendix 3.

Fig. 2. Predicted point prevalence % (95% uncertainty) by region, adjusted for study-level determinants. Map derived using MapInfo Professional version 10.5.2. (2010) (Pitney Bowes Software, Inc., USA). Map projection: Robinson WGS84. n, Number of studies in each region.
Table 2. Pooled reported prevalence stratified by study-level determinants statistically associated with prevalencea

n, Number of studies in each group; MDD, major depressive disorder; NOS, not otherwise specified; DSM, Diagnostic and Statistcal Manual of Mental Disorders (APA, 2000); ICD, International Classification of diseases (World Health Organization, 1992).
a For each determinant, prevalence was additionally pooled only by sex, and hence did not account for the effect of all other determinants of prevalence. All I 2 statistics were >90%.
Incidence
Only four studies (Eaton et al. Reference Eaton, Kramer, Anthony, Dryman, Shapiro and Locke1989; Lewinsohn et al. Reference Lewinsohn, Hops, Roberts, Seeley and Andrews1993; Patten, Reference Patten2001; Mogga et al. Reference Mogga, Prince, Alem, Kebede, Stewart, Glozier and Hotopf2006) reporting annual incidence rates of MDD from USA, Canada and Ethiopia were identified. Estimates ranged from 1.6% in females aged 18 years or above to 7.1% in females aged 15 to 19 years, from the USA. Male and female estimates across overall age groups were pooled to calculate an overall estimate of annual incidence (Table 3). Total estimates were only included if sex-specific estimates were not reported. Although pooled female estimates were higher than pooled male estimates, there was no statistically significant effect of sex. Since there were only three estimates in each group, more data are required to make a definitive statement on whether a difference exists.
Table 3. Pooled estimates of annual incidencea

n, Number of estimates in each group.
a All I 2 statistics were >86%.
b Random-effects weights.
Discussion
The majority of the literature on prevalence was from Western Europe and North America, with much less from non-Western regions. Prevalence data were highly sensitive to elements of study design and methodology. Consistent with existing literature, prevalence in females was higher than in males (Culbertson, Reference Culbertson1997; Angst et al. Reference Angst, Gamma, Gastpar, Lépine, Mendlewicz and Tylee2002; Kuehner, Reference Kuehner2003) and 12-month prevalence was higher than point prevalence (Faravelli et al. Reference Faravelli, Degl'Innocenti, Aiazzi, Incerpi and Pallanti1990; Stefánsson et al. Reference Stefánsson, Líndal, Björnsson and Gudmundsdóttir1994; Bromet et al. Reference Bromet, Gluzman, Paniotto, Webb, Tintle, Zakhozha, Havenaar, Gutkovich, Kostyuchenko and Schwartz2005). Given these results, it would be reasonable to assume that when pooled by sex and prevalence type simultaneously, pooled 12-month prevalence would be higher than pooled point prevalence; however, this was not the case. For persons pooled 12-month prevalence was lower than pooled point prevalence, although this result was not statistically significant. Pursuing the reason for this finding was outside the scope of this study; however, similar unanticipated results have been reported in the literature pertaining to the prevalence of schizophrenia (Saha et al. Reference Saha, Chant, Welham and McGrath2005). It must also be noted that prevalence was pooled by prevalence type and sex only due to the lack of data. Controlling for the other significant study-level determinants of prevalence, as was done in the meta-regression, may have yielded different results.
Symptom scales were the only survey instruments significantly associated with prevalence, suggesting adequate consistency between the other diagnostic tools in the MDD literature. There has been continuous debate as to whether symptom scales are better suited to measuring mental disorder symptoms or psychological distress (Hollander et al. Reference Hollander, Ekblad, Mukhamadiev and Muminova2007; Horwitz & Wakefield, Reference Horwitz and Wakefield2007; Ventevogel et al. Reference Ventevogel, De Vries, Scholte, Shinwari, Faiz, Nassery, van den Brink and Olff2007). In this case, we found that symptom scales inflated the overall prevalence of MDD. That said, they were often the only tools used to capture prevalence, particularly in conflict settings where epidemiological data are sparse (Hollifield et al. Reference Hollifield, Warner, Lian, Krakow, Jenkins, Kesler, Stevenson and Westermeyer2002). In order to maximize the global representativeness of our findings we chose to include prevalence estimates derived from symptoms scales. We adjusted for any inflation to pooled prevalence by specifying that prevalence derived from diagnostic tools was the ‘gold standard’. This is consistent with the methodology used by other authors specifying that data from symptoms scales need to be ‘recalibrated’ relative to data from diagnostic tools (Ventevogel et al. Reference Ventevogel, De Vries, Scholte, Shinwari, Faiz, Nassery, van den Brink and Olff2007; Rodin & Van Ommeren, Reference Rodin and Van Ommeren2009; Steel et al. Reference Steel, Chey, Silove, Marnane, Bryant and van Ommeren2009). Despite some differences in the DSM and ICD definitions of MDD, diagnostic criteria did not have a statistically significant effect on prevalence.
We detected a time effect suggesting that the prevalence of MDD had increased over time. This was based on an ecological comparison of the midpoint of the case ascertainment period, as a continuous variable. It is possible that this finding represented a true increase in prevalence. Alternatively, it could be due to other methodological or ecological differences across time that we were unable to capture. More in-depth investigation is required to confirm this finding. The only age effect found was from the <18 years age group, which yielded lower estimates compared with estimates across the entire lifespan. This was probably due to estimates from very young children (e.g. 8–9 years) in the <18-year-old group. However, drawing conclusions from this variable is also problematic, given that we could only categorize age using four broad age categories and some age ranges could be allocated to multiple categories. We used broad as opposed to age-specific estimates, as the latter would violate the parametric assumption of independent observations required in a meta-regression. A more detailed comparison of prevalence across the lifespan is required for better conclusions.
We detected considerable regional differences in the prevalence of MDD, some of which were reduced when study-level sources of variability were controlled for. Although our finding of higher prevalence of MDD in developing regions (except for Asia East/Southeast) compared with developed regions corresponded to WMHS results, our overall adjusted point prevalence of 4.7% was higher than the WMHS finding of 1.8% point prevalence in developed countries and 2.6% in developing countries. Instead, it was closer to the 5.5% 12-month prevalence in developed countries (Bromet et al. Reference Bromet, Andrade, Hwang, Sampson, Alonso, de Girolamo, de Graaf, Demyttenaere, Hu, Iwata, Karam, Kaur, Kostyuchenko, Lepine, Levinson, Matschinger, Mora, Browne, Posada-Villa, Viana, Williams and Kessler2011). The higher point prevalence obtained here may be due to the adjustments made for differences in study methodology. Despite WMHS efforts to enforce a standardized methodology, differences still occurred. Response rates and the amount of missing data varied substantially across countries, which may have reduced the representativeness of some samples (Simon et al. Reference Simon, Goldberg, Von Korff and Üstün2002; Wang et al. Reference Wang, Aguilar-Gaxiola, Alonso, Angermeyer, Borges, Bromet, Bruffaerts, de Girolamo, de Graaf, Gureje, Haro, Karam, Kessler, Kovess, Lane, Lee, Levinson, Ono, Petukhova, Posada-Villa, Seedat and Wells2007; Bromet et al. Reference Bromet, Andrade, Hwang, Sampson, Alonso, de Girolamo, de Graaf, Demyttenaere, Hu, Iwata, Karam, Kaur, Kostyuchenko, Lepine, Levinson, Matschinger, Mora, Browne, Posada-Villa, Viana, Williams and Kessler2011). The WMHS used data collected by the CIDI only. Our broader focus allowed us to include data from countries that were not part of the WMHS, using other diagnostic instruments. That said, our inclusion of prevalence derived from symptom scales must be treated with caution, given the possibility of inflating final results with presentations of MDD symptoms rather than diagnoses.
Estimates from East/Southeast Asia remained much lower than other regions even after adjusting for methodological differences. This may reflect a true difference in the global distribution of MDD. Alternatively, it may be due to unidentified sources of measurement bias that we were unable to control for. One possibility is that DSM/ICD diagnostic criteria are not sensitive to cross-cultural presentations of MDD (Simon et al. Reference Simon, Goldberg, Von Korff and Üstün2002; Wang et al. Reference Wang, Aguilar-Gaxiola, Alonso, Angermeyer, Borges, Bromet, Bruffaerts, de Girolamo, de Graaf, Gureje, Haro, Karam, Kessler, Kovess, Lane, Lee, Levinson, Ono, Petukhova, Posada-Villa, Seedat and Wells2007; Bromet et al. Reference Bromet, Andrade, Hwang, Sampson, Alonso, de Girolamo, de Graaf, Demyttenaere, Hu, Iwata, Karam, Kaur, Kostyuchenko, Lepine, Levinson, Matschinger, Mora, Browne, Posada-Villa, Viana, Williams and Kessler2011). Another is that MDD may be miscoded as depression NOS in less developed countries (Chang et al. Reference Chang, Hahm, Lee, Shin, Jeon, Hong, Lee, Lee and Cho2008; Phillips et al. Reference Phillips, Zhang, Shi, Song, Ding, Pang, Li, Zhang and Wang2009), underestimating prevalence. We recommend that in upcoming GBD burden calculation this limitation be addressed through the inclusion of estimates of depression NOS as was done here.
Ecological factors may also contribute to regional differences in prevalence. Consistently high prevalence in Africa/Middle East and South Asia raises the possibility that conflict in countries such as Afghanistan, Iraq and Sudan increase the prevalence of MDD. This is consistent with literature suggesting that exposure to torture and other trauma in conflict settings increases the prevalence of depression and post-traumatic stress disorder (Steel et al. Reference Steel, Chey, Silove, Marnane, Bryant and van Ommeren2009). Based on this, we also recommend that the effect of conflict status be investigated further.
Whilst we found numerous naturalistic studies of the annual incidence of MDD, very few follow-up studies using representative community samples were available. The GBD 2000 update predicted an average incidence of 3.2% in males and 4.9% in females (Ayuso-Mateos, Reference Ayuso-Mateos2000; Üstün et al. Reference Üstün, Ayuso-Mateos, Chatterji, Mathers and Murray2004), which was higher than our results of 2.7% in males and 3.4% in females. If a duration of 30 weeks for an episode of MDD (Vos et al. Reference Vos, Haby, Barendregt, Kruijshaar, Corry and Andrews2004) is taken into account, there is a clear inconsistency between the few incidence estimates we obtained and our adjusted prevalence estimate, in that incidence was lower than prevalence instead of higher. This problem illustrates the importance of internal consistency between epidemiological parameters. While summaries of individual epidemiological parameters of MDD are useful, they may be inaccurate, particularly where data are limited. In this case, parameters need to be considered simultaneously for an internally consistent epidemiological profile of MDD. The upcoming GBD disease modelling of the epidemiology of MDD will help clarify this (Institute for Health Metrics and Evaluation, 2012). In the meantime, our incidence findings are indicative only. More cross-national data are required for stronger conclusions. Although more data were available for prevalence, there were few good-quality estimates from less developed parts of the world. This prevented us from conducting region-specific analyses of variance. We were also unable to control for all sources of variability in prevalence. Further investigation into other determinants of prevalence, for instance human development indicators outside the scope of this review, is required.
Our literature review addressed a range of issues central to the epidemiology of MDD. It identified the data sources required for burden estimation in the GBD 2010 study. It also provided an epidemiological summary of MDD, considering, where feasible, sources of heterogeneity in the data. We recommend that the statistically significant study-level determinants of prevalence identified be considered when generating other ecological models of MDD prevalence. We were also able to identify salient gaps in the literature that need further consideration. There were very few incidence data and very few studies from non-developed parts of the world across all parameters. We were also unable to comprehensively assess the effect of age on prevalence. Further investigation of these limitations is required for a clearer epidemiological profile of MDD.
Supplementary material
For supplementary material accompanying this paper visit http://dx.doi.org/10.1017/S0033291712001511.
Acknowledgements
Special thanks to Angela Higginson from the Institute for Social Science Research, University of Queensland for providing us with statistical advice. We are also grateful to the contribution of Holly E. Erskine, An Pham and Amanda Brown to data collection and to Roman Scheurer for assistance in generating maps. A.J.F., A.J.B. and H.A.W. are affiliated with the Queensland Centre of Mental Health Research (QCMHR), which receives its core funding from the Queensland Department of Health. A.J.S. was also affiliated with QCMHR during the data collection phase of this paper. T.V. and R.N. have received funding from the Global Burden of Disease project.
Declaration of Interest
None.