Introduction
In recent years, theory and empirical research have shed light on the importance of studying the interplay between genetic and environmental forces as a way of elucidating causal mechanisms in the development of psychopathology (Moffitt, Reference Moffitt2006; Rutter et al. Reference Rutter, Moffitt and Caspi2006). This type of research focuses on identifying those in the population most vulnerable to environmental stressors. There is a long history of research investigating the impact of one important risk factor, socio-economic status (SES), on human development (for a recent review, see Conger & Donnellan, Reference Conger and Donnellan2007), including physical, emotional and behavioral disorders (McLeod & Shanahan, Reference McLeod and Shanahan1996; Berkman & Kawachi, Reference Berkman and Kawachi2000; Bradley & Corwyn, Reference Bradley and Corwyn2002). In particular, SES has often been posited to be a risk factor for mental illness. Across a range of disorders, rates of psychopathology are often higher among individuals from lower SES levels than individuals from higher levels of SES (Faris & Dunham, Reference Faris and Dunham1939; Hollingshead & Redlich, Reference Hollingshead and Redlich1958; Dohrenwend & Dohrenwend, Reference Dohrenwend and Dohrenwend1969; Dohrenwend et al. Reference Dohrenwend, Levav, Shrout, Schwartz, Naveh, Link, Skodol and Stueve1992; Kohn et al. Reference Kohn, Dohrenwend, Mirotznik and Dohrenwend1998; Johnson et al. Reference Johnson, Cohen, Dohrenwend, Link and Brook1999; Kahn et al. Reference Kahn, Wise, Kennedy and Kawachi2000; Chen et al. Reference Chen, Subramanian, Acevedo-Garcia and Kawachi2005). Thus, SES is well suited for further study as an environmental risk factor in studies of gene–environment interplay in psychopathology.
Theoretical perspectives on the relationship between SES and psychopathology
Two theories have been put forward to explain the different prevalence rates of mental illness found between individuals in low versus high SES groups (Dohrenwend et al. Reference Dohrenwend, Levav, Shrout, Schwartz, Naveh, Link, Skodol and Stueve1992). Social causation theory proposes that stressors associated with lower SES (Turner et al. Reference Turner, Wheaton and Lloyd1995) influence the development of psychopathology (Dohrenwend et al. Reference Dohrenwend, Levav, Shrout, Schwartz, Naveh, Link, Skodol and Stueve1992). Social causation theory represents a form of gene×environment interaction (GxE), in which an environmental risk factor moderates etiologic influences on susceptibility to psychopathology. Conversely, social selection (or downward drift) theory posits that individuals with mental illness find themselves at the lowest SES levels (drift down the SES ladder) as a result of the inability to find and maintain consistent employment because of difficulties related to psychopathology. Social selection theory is an example of gene–environment correlation (rGE), in which genetic and environmental influences are correlated and thus people select into certain environments, at least in part, because they are genetically predisposed to do so.
Empirical evidence for the two perspectives
Studies examining social causation and social selection rarely use behavior genetic methods, instead relying on non-experimental and quasi-experimental designs (Dohrenwend et al. Reference Dohrenwend, Levav, Shrout, Schwartz, Naveh, Link, Skodol and Stueve1992; Miech et al. Reference Miech, Caspi, Moffitt, Wright and Silva1999; Wadsworth & Achenbach, Reference Wadsworth and Achenbach2005). Some find support primarily for either social causation (Link et al. Reference Link, Dohrenwend and Skodol1986, Reference Link, Lennon and Dohrenwend1993; Ritsher et al. Reference Ritsher, Warner, Johnson and Dohrenwend2001) or social selection (Levav et al. Reference Levav, Zilber, Aisenberg and Turetsky1987b; Murphy et al. Reference Murphy, Olivier, Monson, Sobol, Federman and Leighton1991; Munk & Mortensen, Reference Munk and Mortensen1992). Wadsworth & Achenbach (Reference Wadsworth and Achenbach2005) found that greater numbers of children from low SES groups developed a variety of psychological complaints (anxious/depressed, aggressive behavior, thought problems, somatic complaints and delinquent behavior) than children from high SES groups, supporting the theory of social causation. Evidence also suggests, however, that the mechanism of action between low SES and psychopathology may differ depending on the form of psychopathology (Dohrenwend et al. Reference Dohrenwend, Levav, Shrout, Schwartz, Naveh, Link, Skodol and Stueve1992; Johnson et al. Reference Johnson, Cohen, Dohrenwend, Link and Brook1999). Miech et al. (Reference Miech, Caspi, Moffitt, Wright and Silva1999) found support for social selection processes for externalizing disorders and support for social causation for anxiety, but no support for either causation or selection for depression.
Evidence from behavior genetics
Two previous studies have examined the psychopathology–SES link utilizing a behavior genetic design and a biometric model, which ‘relate[s] the “latent” or unobserved variables of … structural models to the functional effects of genes’ (Neale & Maes, in press). In a typical univariate biometric twin model, structural equation modeling is used to decompose the variance of a phenotype into additive genetic effects (A), shared or common environmental effects (C) and unique environmental effects, including measurement error (E). Caspi et al. (Reference Caspi, Taylor, Moffitt and Plomin2000) utilized a biometric model that attributes the amount of shared family variance in behavior problems to the effect of an environmental variable. Shared family environment accounted for 20% of the variance in behavior problems, with neighborhood deprivation directly accounting for 5% of that effect or 1% of the total variance in behavioral problems.
The limitation of this model is that it is unable to provide an estimate of genetic and environmental correlations between SES and psychopathology or to determine whether genetic and environmental influences on psychopathology vary as a function of SES (Turkheimer et al. Reference Turkheimer, D'Onofrio, Maes and Eaves2005). Newer biometric modeling techniques are able to overcome these statistical obstacles (Purcell, Reference Purcell2002). Several articles have now shown that components of SES, including income, do moderate the heritability of various individual difference traits, including IQ in children (Turkheimer et al. Reference Turkheimer, Haley, Waldron, D'Onofrio and Gottesman2003) and life satisfaction in adults (Johnson & Krueger, Reference Johnson and Krueger2006). Specific to psychopathology, only one study has examined GxE using SES as the environmental moderator variable. Tuvblad et al. (Reference Tuvblad, Grann and Lichtenstein2006) reported that SES moderates the etiology of antisocial behavior, such that the heritability of antisocial behavior is higher at more advantaged SES levels. However, no study to date has examined the association between SES and internalizing (INT; i.e. anxiety, depression) forms of psychopathology utilizing biometric moderation modeling.
Income, INT psychopathology and behavior genetics
The INT spectrum is an etiologically coherent construct that incorporates mood and anxiety disorders and the personality trait of neuroticism (Kendler et al. Reference Kendler, Prescott, Myers and Neale2003; Watson, Reference Watson2005; Hettema et al. Reference Hettema, Neale, Myers, Prescott and Kendler2006; South & Krueger, Reference South and Krueger2008). Research generally shows the expected association between a greater number of symptoms of INT disorders and lower levels of SES in adults (Bruce et al. Reference Bruce, Takeuchi and Leaf1991; Dohrenwend et al. Reference Dohrenwend, Levav, Shrout, Schwartz, Naveh, Link, Skodol and Stueve1992; Kessler et al. Reference Kessler, McGonagle, Zhao, Nelson, Hughes, Eshleman, Wittchen and Kendler1994) albeit these effects can be small (e.g. odds ratio 1.17–1.34 for depressive disorders; Johnson et al. Reference Johnson, Cohen, Dohrenwend, Link and Brook1999). Indeed, some studies find essentially no link between SES and INT problems (Weissman et al. Reference Weissman, Bruce, Leaf, Florio, Holzer, Robins and Regier1991; Kohn et al. Reference Kohn, Dohrenwend, Mirotznik and Dohrenwend1998; Eaton et al. Reference Eaton, Mutaner, Bovasso and Smith2001); for instance, Cronk et al. (Reference Cronk, Slutske, Madden, Bucholz and Heath2004) found that SES had little impact on the vulnerability to separation anxiety disorder among female twins ranging in age from 13 to 23 years. Although direct SES–INT relations are often modest, evidence supports the role of social causation (Wheaton, Reference Wheaton1978; Dohrenwend et al. Reference Dohrenwend, Levav, Shrout, Schwartz, Naveh, Link, Skodol and Stueve1992; Miech et al. Reference Miech, Caspi, Moffitt, Wright and Silva1999) and social selection (Wender et al. Reference Wender, Kety, Rosenthal, Schlesinger, Ortmann and Lunde1986). Biometric moderation modeling has the potential to extend our understanding of these relations by determining whether SES moderates etiologic influences on INT pathology (GxE) or whether individuals with INT pathology select into a more disadvantaged environment (rGE). Furthermore, because it has been suggested that the SES–psychopathology link for INT syndromes is age-specific and not apparent until adulthood (Miech et al. Reference Miech, Caspi, Moffitt, Wright and Silva1999; Costello et al. Reference Costello, Compton, Keeler and Angold2003; Wadsworth & Achenbach, Reference Wadsworth and Achenbach2005), a focus on adult samples is most appropriate to understand the etiology of the SES–INT association.
Current study
An important and necessary step is to examine the theories of social causation and social selection in the link between INT psychopathology and SES, utilizing behavior genetic modeling in an adult sample. Evidence for GxE involves finding that the estimate of genetic or environmental influences on INT is not a static quantity, but instead varies as a function of income. Such evidence would support a social causation account if, for example, etiologic influences on INT vary based on income level. In addition, if genetic influences link INT and SES, this would support a social selection account of the relationship between mental illness and SES, in the sense that SES and INT share antecedent (genetic) risk factors.
Method
Sample
Participants for the current study were members of the MacArthur Foundation Survey of Midlife Development in the United States (MIDUS), a national study aimed at examining the interplay between physical health, psychological well-being and social responsibilities. The MIDUS sample is a nationally representative survey of persons aged 25–74 years in the non-institutionalized civilian population of the continental United States. The larger MIDUS sample contains a subset of 998 twin pairs (Kessler et al. Reference Kessler, Gilman, Thornton, Kendler, Brim, Ryff and Kessler2004), who were identified using a telephone survey to screen members of approximately 50 000 households. One-seventh (14.8%) of the contacted respondents identified the presence of a twin in the home; of those, 60% agreed to be re-contacted for inclusion in the study. Recruiters from the Institute for Social Research at the University of Michigan invited eligible twin pairs to participate in the MIDUS study. Final response rate for complete twin interviews was approximately 26% (i.e. both members of the twin pair were contacted by an interviewer, agreed to participate and completed a short zygosity screening questionnaire). Respondents who agreed to participate and met eligibility requirements were referred to the full MIDUS recruitment process (Kendler et al. Reference Kendler, Thornton, Gilman and Kessler2000) and completed two mailed questionnaire booklets and a computer-assisted telephone interview (Kendler et al. Reference Kendler, Thornton, Gilman and Kessler2000).
To determine zygosity, participants were queried as to similarity of eye and hair color and degree to which others were confused about their identity during childhood. These techniques are generally more than 90% accurate (Lykken et al. Reference Lykken, Bouchard, McGue and Tellegen1990); however, missing or indeterminate zygosity information forced us to exclude 16 pairs in this sample. Additionally, 263 opposite-gender pairs were excluded from the full MIDUS twin sample, resulting in a sample of 719 pairs: 172 monozygotic (MZ) male pairs, 195 MZ female pairs, 138 dizygotic (DZ) male pairs and 214 DZ female pairs. Average age of the sample was 44.6 (s.d.=12.15, range 25–74). Additional information on the demographic make-up of the sample is given in Johnson & Krueger (Reference Johnson and Krueger2005, Reference Johnson and Krueger2006). Briefly, participants were slightly more wealthy than the population average for the US at that time, but 30% of the sample did have incomes below the national median. Informed consent was obtained from all of the participants and the current study was approved by the first author's local institutional review board.
Measures
The MIDUS study assessed the symptoms of three DSM-III-R disorders from the INT spectrum: major depressive episode, generalized anxiety disorder (GAD) and panic disorder (PD). All symptoms were assessed through a phone interview that used the Composite International Diagnostic Interview Short Form scales (CIDI-SF; Kessler et al. Reference Kessler, Andrews, Mroczek, Ustun and Wittchen1998a). The CIDI-SF is a fully structured diagnostic interview that assesses the 12-month prevalence of mental disorders. Research has shown good total classification accuracy (percentage of respondents whose CIDI-SF classification is the same as their classification of the full CIDI) for the major depressive disorder (MDD) (93%), GAD (99%) and PD (98%) assessments (Kessler et al. Reference Kessler, Andrews, Mroczek, Ustun and Wittchen1998a). The full CIDI also shows good agreement with clinical diagnoses (Wittchen, Reference Wittchen1994; Kessler et al. Reference Kessler, Wittchen, Abelson, Kendler, Knauper, McGonagle, Schwarz and Zhao1998b).
The CIDI-SF uses a stem-branch format, such that a small number of initial diagnostic stem questions are used to screen out people least likely to meet a diagnosis before they are asked further symptom questions. Respondents meet the stem requirement for MDD by endorsing 2 weeks of (1) depressed mood or (2) anhedonia, at least most of the day, for at least almost every day. If either stem is endorsed, participants are queried about additional depression symptoms (e.g. feeling tired, change in weight, trouble with sleep). A MDD score (0–7) is then calculated as the sum of the positive responses to each of these questions. Participants meet the diagnostic stem requirement for generalized anxiety by reporting a period of feeling worried, tense or anxious that lasted at least 6 months. The CIDI-SF also assesses for panic attacks, not PD per se. The interview does not specifically evaluate the DSM-III-R criteria that either four panic attacks occur within a 4-week period or that one or more panic attacks are followed by a 4-week period of persistent fear of having another panic attack.
Included in the MIDUS survey's self-administered questionnaire is a personality measure based on the Five Factor Model (Lachman and Weaver, Reference Lachman and Weaver1997). We utilized the neuroticism scale from the questionnaire (α=0.75). Respondents rated themselves on four adjectives: ‘moody’, ‘worrying’, ‘nervous’ and ‘calm’ (reverse scored) on a scale of 1–4 indicating ‘how well each of the following describes you: a lot, some, a little, not at all,’ with 1 signifying ‘a lot’. A total score for neuroticism was calculated using the mean across these items.
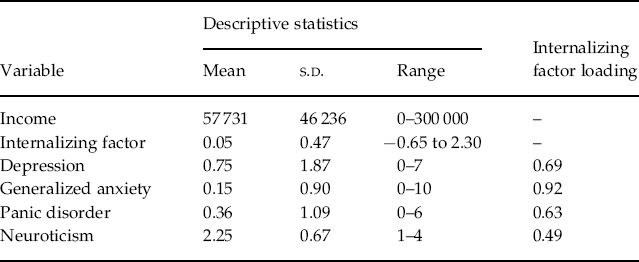
The MIDUS questionnaire inquired about total annual household income, including personal employment earnings, spouses' earnings, government assistance, Social Security and pensions and investments. Total income was capped at $300 000 per year (anyone earning over that amount was listed at 300 000). Average income was $57 731 (s.d.=46, 236, range 0–300 000) per year. Following standard practices, we used a log(10) transformation of total household income to normalize the distribution (Cook & Weisberg, Reference Cook and Weisberg1999); this transformed score was then used in the biometric modeling.
Data analysis
We used biometric modeling to test the social causation and social selection models of the association between SES and INT pathology. Biometric modeling takes advantage of the differences in identical twins, who share 100% of their genes, and fraternal twins, who share, on average, 50% of their genes, to decompose the variance in a trait (phenotype) into the amount due to additive genetic effects (A), common environmental influences (C) and unique environmental influences (E). This univariate ‘ACE’ model can easily be extended to a bivariate decomposition, which estimates the ACE variance components unique to one phenotype and the ACE contributions to the amount of covariance shared between the two variables. As a result, the bivariate model provides estimates of the genetic and environmental correlations between the variables. A genetic correlation is the degree of overlap in the genetic influences on two phenotypes and ranges from −1 to +1; similar types of correlations (i.e. overlap) are estimated for shared and non-shared environmental influences.
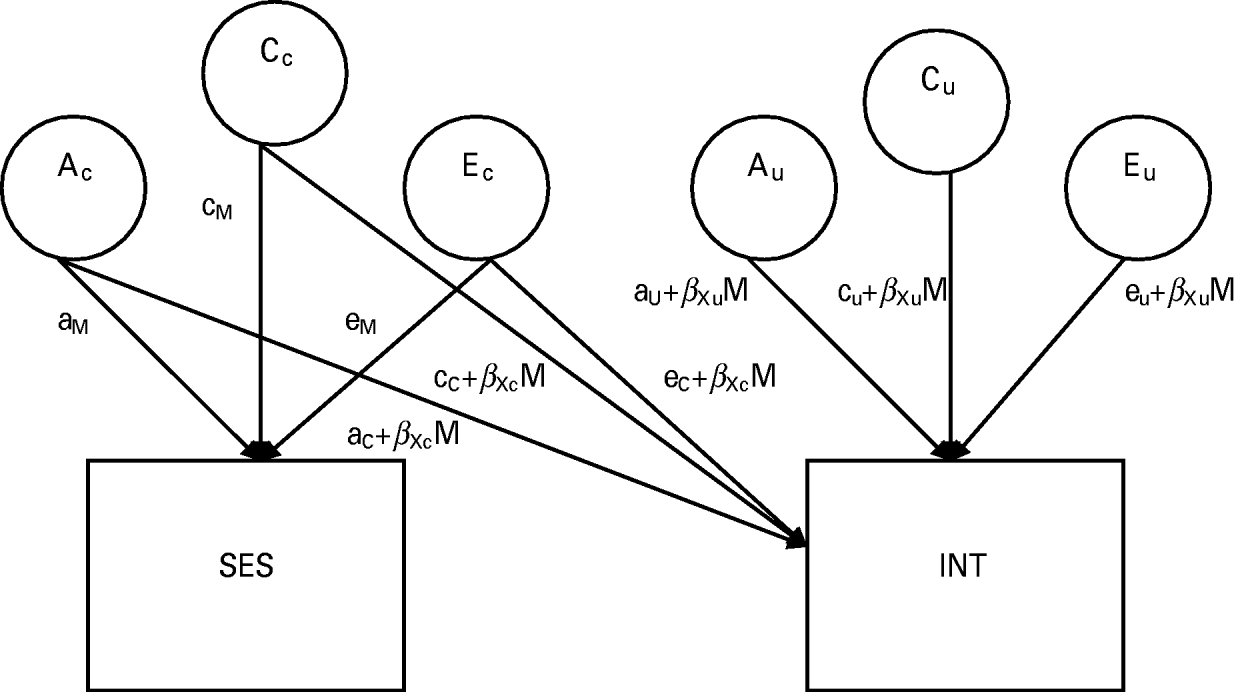
The standard bivariate model does not take into account the possibility that ACE estimates might differ as a function of another variable or trait. Therefore, we utilized a biometric model that allows the ACE variance components and the genetic and environmental correlations between SES and INT to vary as a function of SES (Purcell, Reference Purcell2002). This biometric moderation model (shown in Fig. 1) estimates the extent to which influences acting on INT also exerted influences on SES (rGE) and whether the magnitude of genetic and environmental influences on INT depends on SES (GxE). As shown, there are two pathways from genetic and environmental influences to the phenotypes (SES and INT): one path represents influences common to INT and the moderator (SES) and one path shows influences that are unique to INT. The ACE paths shared in common between the two phenotypes are linear functions of the form a+βM, where a is the parameter for genetic influence on the variable, β is a regression coefficient and M is the level of the moderator variable. There are six paths leading to INT: three represent the variance shared in common between SES and INT (shown as paths with a C subscript), while three represent the variance unique to INT (shown as paths with a U subscript). To calculate the total phenotypic variance in INT, all of the paths leading to it can be squared and summed together:

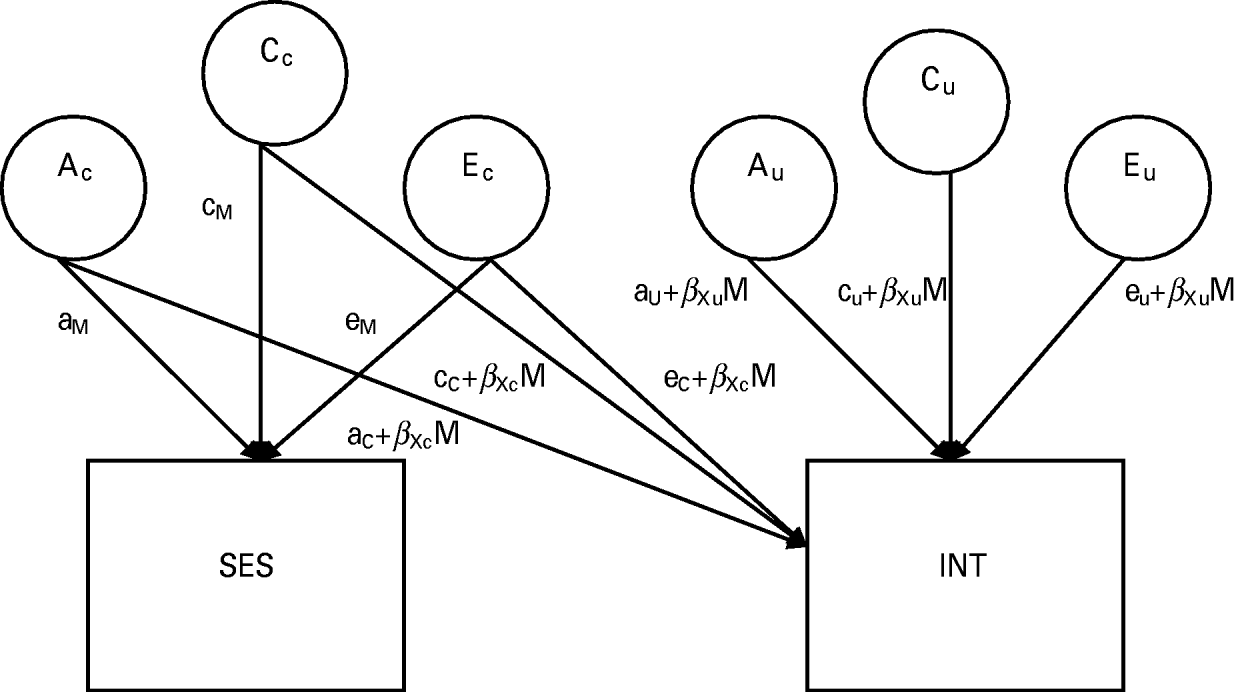
Fig. 1. Full biometric moderation model with socio-economic status (SES) moderating the genetic and environmental influences on a general Internalizing (INT) factor (model is shown for only one member of the twin pair). A signifies influences due to additive genetics, C refers to shared (common) environmental influences and E refers to non-shared (unique) environmental variance. Ac, Cc and Ec represent the variance shared between INT and SES, while Au, Cu and Eu represent any residual variance in INT after accounting for SES. Moderation of INT by SES is represented by the product of a coefficient that indexes the direction and magnitude of moderation (βXc) multiplied by the level of the moderator. The total phenotypic variance in INT can be calculated by squaring and summing all of the paths leading to it: P2=(aC+βXcM)2+(aU+βXuM)2+(cC+βXcM)2+(cU+βXuM)2+(eC+βXcM)2+(eU+βXuM)2.
Biometric moderation models were fit to the raw data in Mx (Neale et al. Reference Neale, Boker, Xie and Maes2003) using full-information maximum-likelihood, a procedure that accounts for missing data as part of the model fitting procedure. Following standard procedures to correct for potential biases in model fitting, the SES and INT scores were regressed on age, age2, age×gender and age2×gender (McGue & Bouchard, Reference McGue and Bouchard1984). Model fit was evaluated using the likelihood ratio test (LRT) and Akaike's Information Criterion (AIC; Akaike, Reference Akaike1987). The LRT, which is distributed as χ2 and computed as the difference in the −2 log-likelihood values for two separate models, is used as a goodness-of-fit index. It represents the degree of fit between the observed data and model-implied data, and a statistically significant change in LRT can be used to determine improvement in the model's fit as a result of adding or omitting parameters. The AIC statistic is an information theoretic fit statistic, which selects the model that best fits the data with the fewest number of parameters. Lower AIC values suggest better fitting models (Markon & Krueger, Reference Markon and Krueger2004).
Results
A confirmatory factor analysis was conducted in Mplus (Muthén, 1998–2007) using the symptom counts for depression, generalized anxiety and panic attacks and the scale score for neuroticism. Raw data were fit to a one-factor model using a weighted least squares estimator with a mean- and variance-adjusted χ2 test statistic to account for the non-normality of the data. Hu & Bentler (Reference Hu and Bentler1999) list the following criteria for acceptable model fit: root mean square error of approximation (RMSEA) <0.06, comparative fit index (CFI) ⩾0.95 and Tucker-Lewis index (TLI) ⩾0.95. The one factor solution here resulted in a RMSEA of 0.01, a CFI of 1.00 and a TLI of 0.99, indicating good fit. Standardized factor loadings for each of the INT syndrome variables are given in Table 1. We extracted factor scores from Mplus to use in the biometric moderation analyses. The INT factor score was significantly negatively related to income (r=−0.06, p<0.05).
Table 1. Descriptive statistics and factor analysis loadings for internalizing syndromes
Biometric modeling was used to examine the interplay between genetic and environmental influences on INT and income. We first fit the full moderation model (−2 log likelihood=7458.60, degrees of freedom=2671, AIC=2116.60) as shown in Fig. 1, which includes six moderation paths (the path common to both income and INT, and the path unique to INT, for genetic, shared environmental and unique environmental influences). We then compared the full moderation model with a no-moderation model, in which all of the moderation parameters were fixed at 0. As shown in Table 2, dropping the moderation paths in the no-moderation model resulted in a significant decrease in fit. Examination of the confidence intervals around the parameter estimates suggests that much of the decrement in fit can be explained by moderation on the unique environmental path, as this is the only confidence interval that does not contain zero (see Table 3). However, because omission of effects by fixing them at precisely zero can bias the estimation of parameters in biometrical models, we present results from the full moderation model with all six moderation paths freely estimated.
Table 2. Fit statistics from the biometric moderation models of socio-economic status and internalizing psychopathology

−2lnL, −2 log likelihood; df, degrees of freedom; AIC, Akaike's Information Criterion.
Table 3. Path estimates and 95% confidence intervals (CI) for the moderation models of internalizing pathology by income

Am, Genetic path estimate for marital quality; Ac, genetic path estimate from marital quality to internalizing; Au, genetic path estimate unique to internalizing; Amc, moderator of genetic path from marital quality to internalizing; Amu, moderator of genetic path to internalizing; Cm, shared environmental path estimate for marital quality; Cc, shared environmental path estimate from marital quality to internalizing; Cu, shared environmental path estimate unique to internalizing; Cmc, moderator of shared environmental path from marital quality to internalizing; Cmu, moderator of shared environmental path to internalizing; Em, non-shared environmental path estimate for marital quality; Ec, non-shared environmental path estimate from marital quality to internalizing; Eu, non-shared environmental path estimate unique to internalizing; Emc, moderator of non-shared environmental path from marital quality to internalizing; Emu, moderator of non-shared environmental path to internalizing.
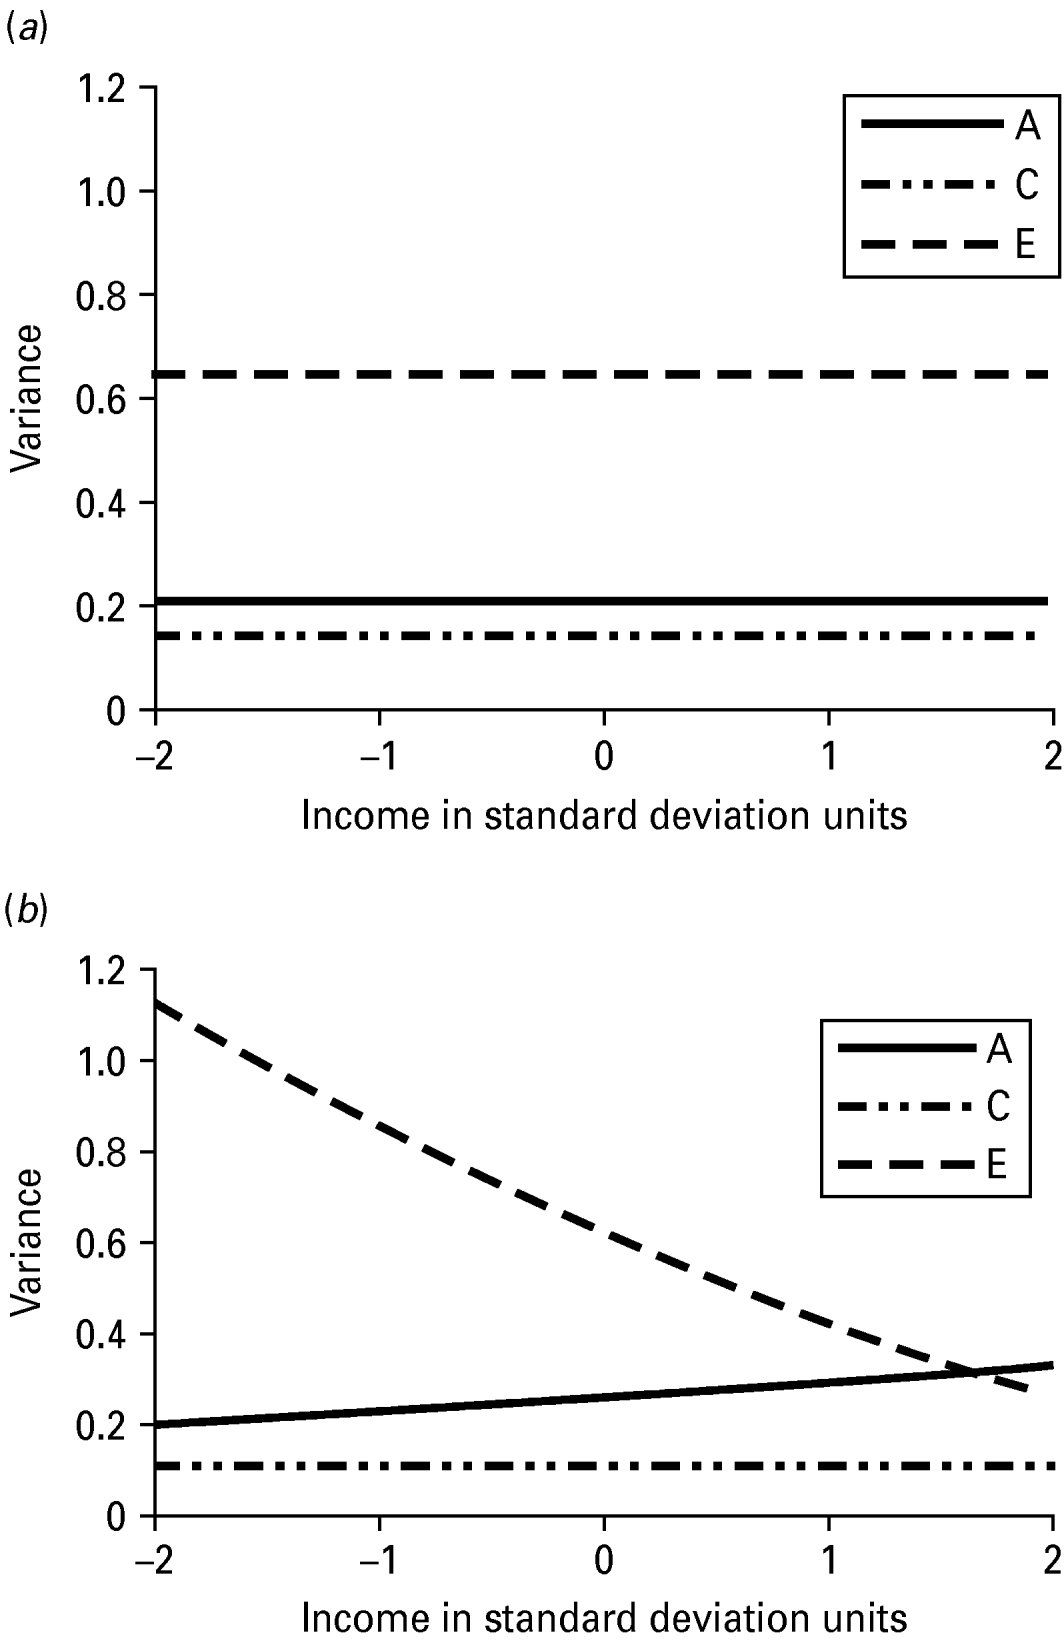
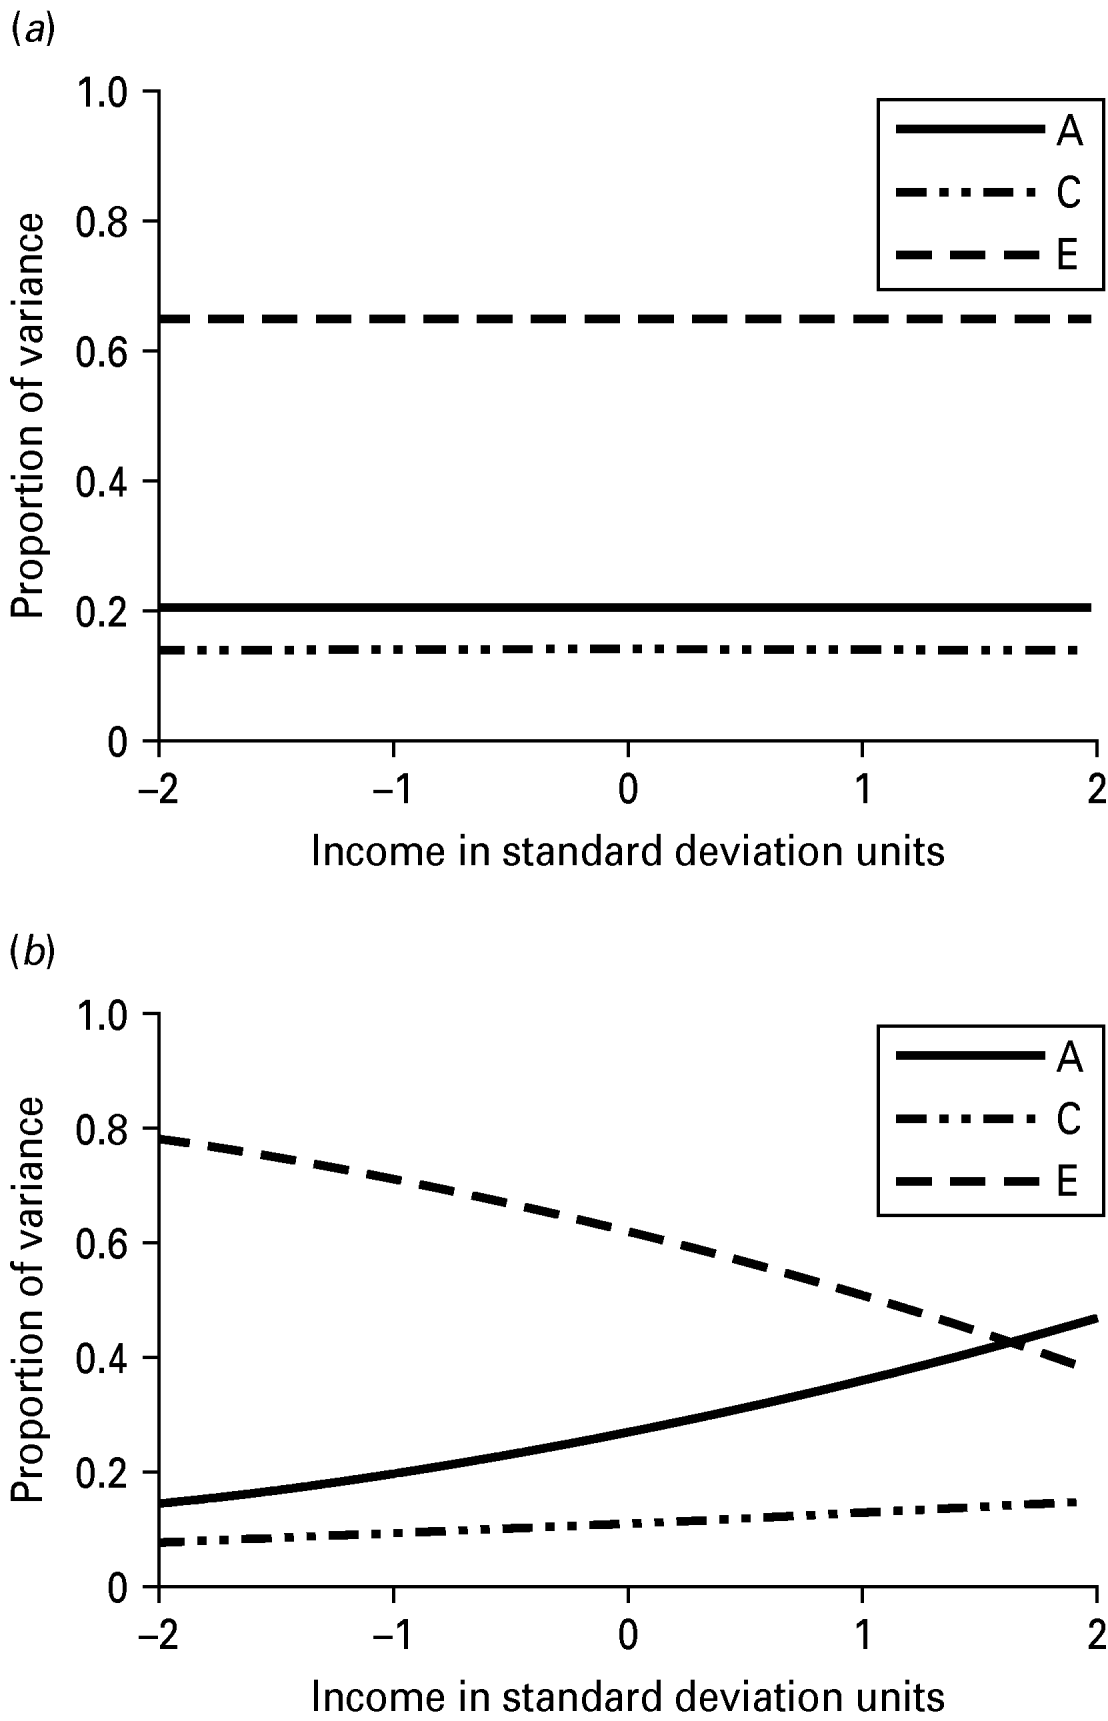
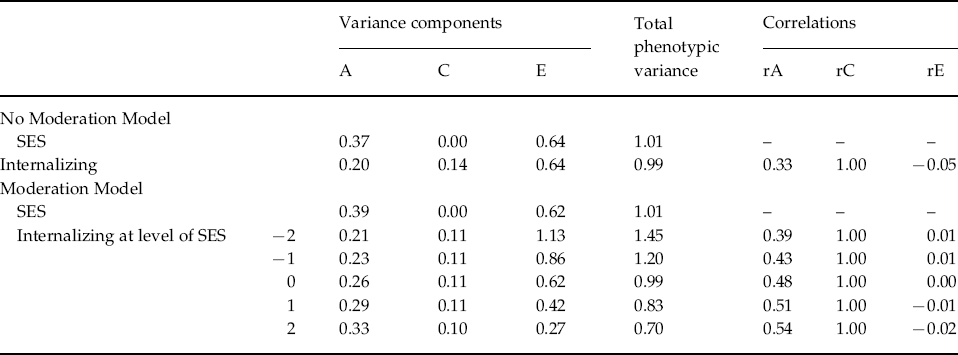
The unstandardized variance components for INT estimated from the no-moderation and full moderation models are shown in Table 4. The variance components from the moderation model could be plotted for any value of income, but for simplicity they are shown at five different levels: −2, −1, 0, 1 and 2 s.d. away from the mean of the moderator. The unique environmental variance was highest at the lowest level of income (1.13) and lowest at the highest levels of income (0.27), while the total phenotypic variance in INT decreased from low to high levels of income. The variance components are also shown graphically in Fig. 2, which again demonstrates that low levels of income seem to accentuate unique (non-shared) environmental influences. The changes in the standardized estimates of the genetic and environmental components of variance in INT as a function of income are shown graphically in Fig. 3. Non-shared environmental effects on INT were most important at the lowest levels of income, while the proportion of variance in INT due to genetic effects increased from low to high levels of income. Examination of the unique environmental correlations between INT and income showed virtually no overlap between the non-shared environmental influences at any level of income.
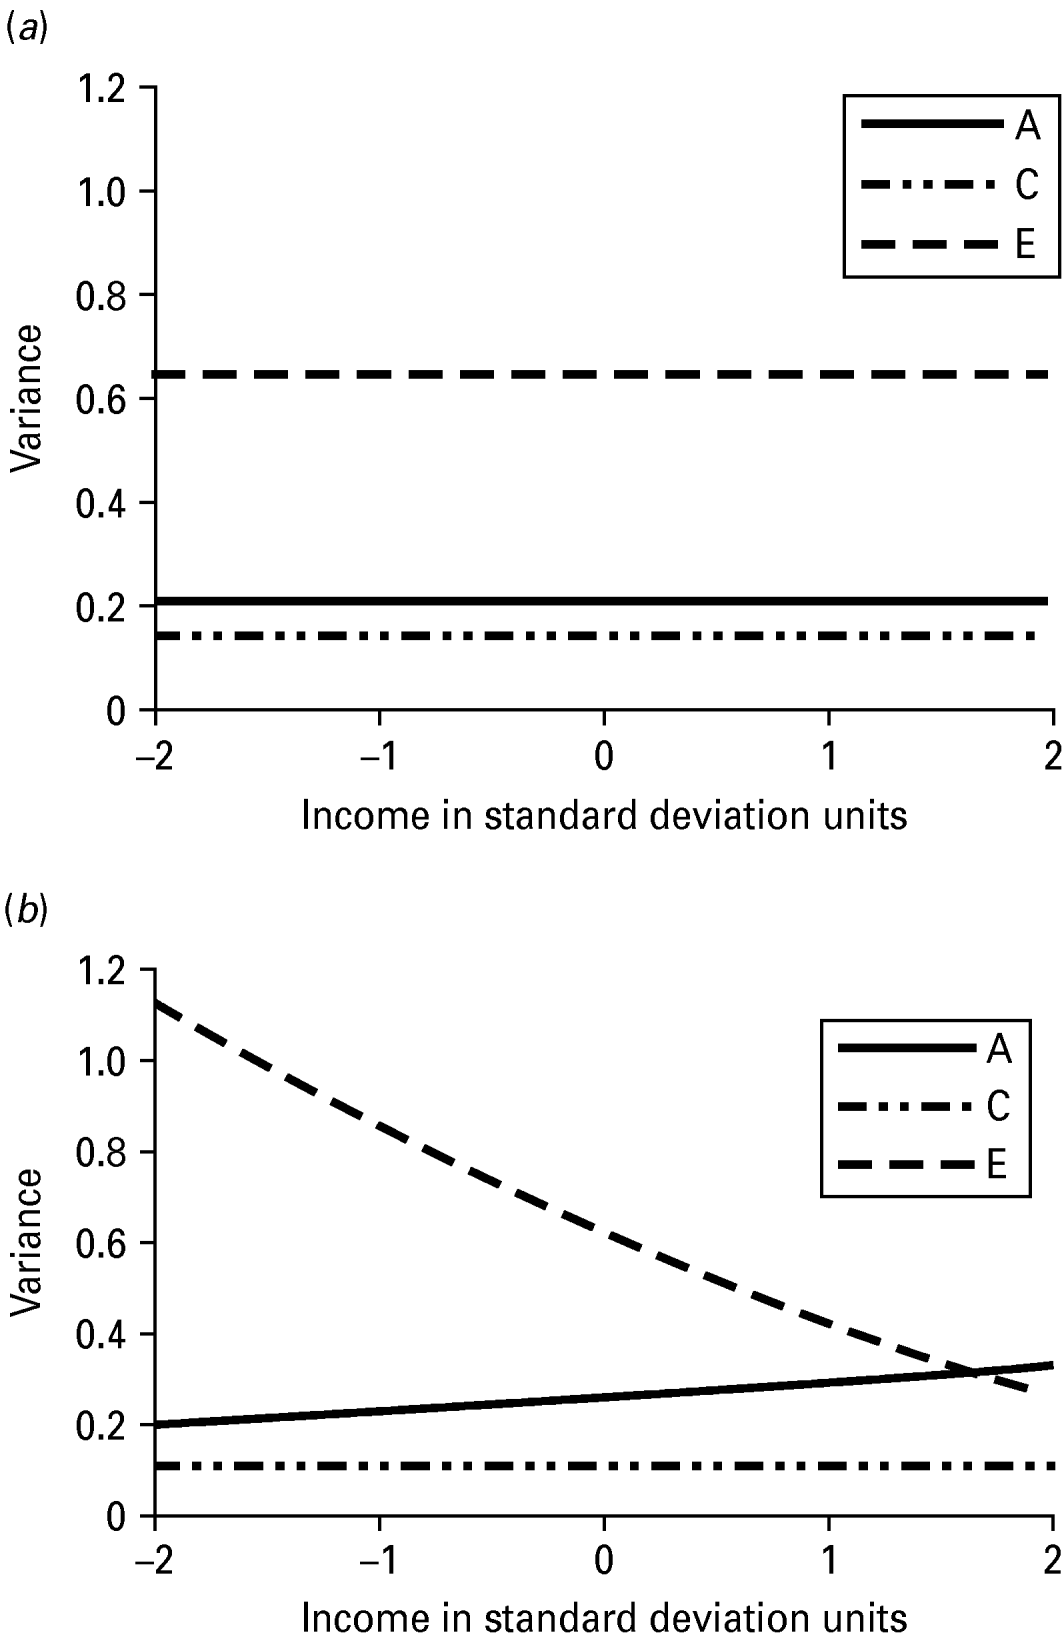
Fig. 2. (a) Variance in Internalizing form the no-moderation model with income. (b) Variance in Internalizing as a function of socio-economic status. A, genetic variance; C, shared environmental variance; E, non-shared environmental variance.

Fig. 3. (a) Proportions of variance in Internalizing form the no moderation model with income. (b) Proportions of variance in Internalizing as a function of socio-economic status. A, standardized genetic variance; C, standardized shared environmental variance; E, standardized non-shared environmental variance.
Table 4. Estimates of unstandardized variance components and genetic and environmental correlations between socio-economic status (SES) and internalizing psychopathology
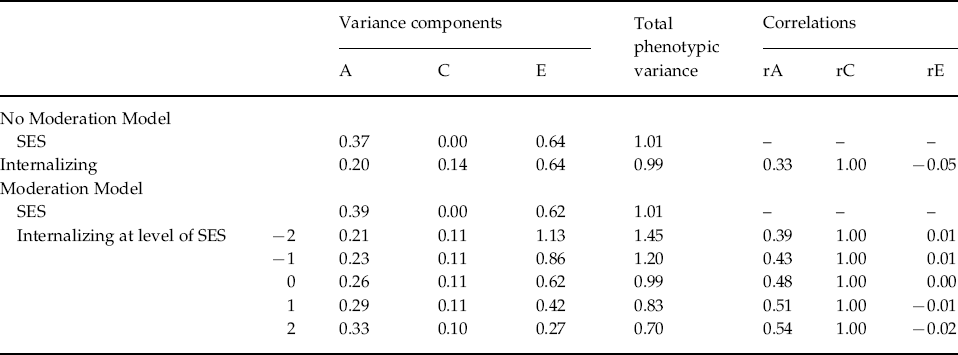
A, Unstandardized genetic variance component; C, unstandardized shared environmental variance component; E, unstandardized nonshared environmental variance component; rA, genetic correlation; rC, shared environmental correlation; rE, non-shared environmental correlation.
Finally, we examined whether the moderating effect of income on the individual INT syndromes differed from the moderating effect on the INT factor. We regressed each of the four INT variables (i.e. depression, generalized anxiety, panic attacks and neuroticism) on the INT factor score to create residual scores, representing unique aspects of each INT indicator (e.g. variance unique to depression, not shared with INT). The intraclass correlations for the resulting residual scores were (MZ/DZ): 0.14/0.03 for depression; 0.04/0.01 for generalized anxiety; 0.00/0.02 for panic attacks; 0.28/0.07 for neuroticism. Only the MZ correlations for depression and neuroticism were significant (p<0.01), indicating residual genetic variance. Subsequent biometric moderation analyses indicated that the moderation model was not a significant improvement over a no-moderation model (all p's non-significant) for any of these four residual scores.
Discussion
Support has been found for both social causation and social selection theories of SES and mental illness (Wheaton, Reference Wheaton1978; Link et al. Reference Link, Dohrenwend and Skodol1986, Reference Link, Lennon and Dohrenwend1993; Wender et al. Reference Wender, Kety, Rosenthal, Schlesinger, Ortmann and Lunde1986; Levav et al. Reference Levav, Zilber, Danielovich, Aisenberg and Turetsky1987a; Murphy et al. Reference Murphy, Olivier, Monson, Sobol, Federman and Leighton1991; Dohrenwend et al. Reference Dohrenwend, Levav, Shrout, Schwartz, Naveh, Link, Skodol and Stueve1992; Munk & Mortensen, Reference Munk and Mortensen1992; Miech et al. Reference Miech, Caspi, Moffitt, Wright and Silva1999; Ritsher et al. Reference Ritsher, Warner, Johnson and Dohrenwend2001). The current study attempted to clarify the role of SES as an environmental stressor that may moderate genetic and environmental influences on INT psychopathology. The application of biometric moderation modeling allowed us to examine the etiology of the income–INT link in a novel way, testing for GxE (i.e. social causation) and rGE (i.e. social selection) in the same model.
Our results support the social causation hypothesis. At the lowest levels of income, environmental effects explained the greatest proportion of variance in INT. Our results are consistent with those of Dohrenwend et al. (Reference Dohrenwend, Levav, Shrout, Schwartz, Naveh, Link, Skodol and Stueve1992), who also found evidence of social causation for MDD. However, contrary to this previous work we also found evidence of social causation for both men and women, although this may be a reflection of differences in sample (Israeli adults versus US adults) or in the type of statistical modeling employed. Using biometric moderation, we found evidence of a significant shift in the etiology of INT psychopathology across levels of income; this fits well within Bronfenbrenner & Ceci's (Reference Bronfenbrenner and Ceci1994) bio-ecological model of development, which posits that environmental influences will be accentuated when the environment is relatively lacking in resources. Given that the greatest influence on the immediate, proximal environment is environmental contexts outside the family home (Bronfenbrenner & Ceci, Reference Bronfenbrenner and Ceci1994), the connection between low SES, a stressful proximal environment and higher levels of environmental influence is consistent with this theory.
Of note, there was only a weak, but significant, phenotypic effect of SES on INT psychopathology in this sample. This, combined with our findings of non-trivial moderation effects and a non-trivial genetic correlation between SES and INT, suggests that SES may be operating not through a main effect on INT forms of pathology, but by impacting the relative influence of genes and environment on the etiology of INT disorders. Our findings are similar to previous work by Tuvblad and colleagues, who also reported a modest phenotypic correlation between externalizing psychopathology and SES (e.g. r=−0.06 between antisocial behavior and family occupational status), again in the presence of significant biometric moderation (Tuvblad et al. Reference Tuvblad, Grann and Lichtenstein2006). Thus, it appears that mixed findings regarding the relative influence of social selection versus social causation may be due to the use of research designs that cannot parse genetic and environmental influences.
As with externalizing forms of psychopathology, it may be that disadvantaged environments mask genetic effects on INT psychopathology, whereas genetic effects can be more clearly detected in enriched environments (Raine, Reference Raine2002; Tuvblad et al. Reference Tuvblad, Grann and Lichtenstein2006), at least in a relatively affluent Westernized industrial country. Greater levels of income may very well act as a buffer against environmental hardships and thus the manifestation of psychopathology among individuals in higher SES will more clearly reflect genetic influences. This can be seen in Fig. 1, where the total variance in INT is diminished at higher levels of income, in the context of relatively constant levels of genetic influence across income. That is, genetic factors represent a greater proportion of the variance in INT at higher levels of income.
Having established the importance of low-income households as an environmental risk factor for the development of INT psychopathology, research must now establish the ways in which the stressors that accompany low SES living conditions can trigger INT syndromes. For instance, financial stress negatively impacts marital functioning, which can, in turn, lead to INT symptoms (South & Krueger, Reference South and Krueger2008). Another consideration is the increasing gap between the rich and the poor over the last several decades in the United States. Greater income inequality may lead to greater social isolation in low-income individuals, thus increasing the risk for mental illness (Kahn et al. Reference Kahn, Wise, Kennedy and Kawachi2000).
Finally, it is necessary to examine the possible influence of externalizing psychopathology on levels of INT symptoms. Certainly, INT and externalizing psychopathology are correlated (Krueger, Reference Krueger1999) and while the current dataset is not well-suited to examining this question (e.g. antisocial behavior and personality was not assessed), it may be that both SES and externalizing psychopathology moderate levels of INT symptoms. Future research will need to utilize a variety of methodologies and strategies to tease apart such causal chains, with an ultimate goal of tailoring interventions to individuals. An obvious implication of the findings from this study is that treatments may differ by SES level (Tuvblad et al. Reference Tuvblad, Grann and Lichtenstein2006). Biological interventions for INT syndromes may work best for those in middle or high SES groups (Cohen et al. Reference Cohen, Houck, Szanto, Dew, Gilman and Reynolds2006), while interventions for those among lower SES groups may need to incorporate case management (Ward, Reference Ward2007) or target entire communities (e.g. child care and mother support groups, job re-training).
With regard to social selection theory of SES and mental illness, overlap in the genetic influences on INT and SES across levels of income is evidence of rGE. Individuals with an INT syndrome may select into a disadvantaged environment, which would be a form of active rGE. However, these data are cross-sectional and cannot speak to the ways in which this process unfolds over time. It is possible that evocative or passive rGE processes are also occurring. The best approach to studying social selection would involve the use of longitudinal genetically informative data, where the process of social drift could be studied as it develops over time.
This study does have several limitations that must be acknowledged. First, this sample was drawn from the American population circa the mid-1990s and thus our results are specific to this culture. Our findings should be replicated using more contemporary and varied samples. Second, we utilized only one index of SES – namely, household income. This was a relatively broad and non-specific index and our findings may change if different indices of SES (e.g. occupation) are used. It is also possible that there were high non-response rates among low income eligible respondents with high rates of INT disorders; this may partly explain the low correlation between income and INT found in the current study. Our sample size may have impacted our ability to find significant moderation by subtype of INT; exploration of specificity could be enhanced with larger sample sizes. Larger sample sizes may also result in additional power to detect significant moderation on genetic and shared environmental effects. In a related vein, future research with a larger sample may be able to include opposite-gender DZ twin pairs, who were excluded from the current study because the biometric moderation model we fit does not accommodate empirical estimation of genetic correlations between twins in these pairs (which, unlike same-gender DZ pairs, could be something other than 0.5).
Finally, INT syndromes were assessed with the CIDI-SF (Kessler et al. 1998 a). While the CIDI-SF is a well-validated measure that shows good sensitivity and specificity in comparison to the full Composite International Diagnostic Interview (Kessler et al. 1998 a), it is a lay-administered diagnostic interview conducted over the phone. Clinician- or in-person interview-ratings of the INT syndromes could be used to replicate and extend the work reported here. Additionally, the stem-branch structure of the CIDI-SF interview may have resulted in a failure to assess the presence of associated symptoms in the absence of depressed mood or anhedonia. However, given that the stem questions are the defining features of the disorders (i.e. DSM requires depress mood or anhedonia for a diagnosis of depressive episode), the CIDI-SF appears to capture the variation in DSM-defined INT syndromes (Kessler et al. Reference Kessler, Andrews, Mroczek, Ustun and Wittchen1998a). Along these lines, it is possible that the enhanced non-shared environmental variance in INT at low levels of income represents enhanced psychometric error, as opposed to ‘true’ stochastic environmental effects; yet, we regard this conclusion as unlikely because our assessment of INT syndromes is known to be relatively reliable.
The current study is the first to utilize biometric moderation models that allow for the joint evaluation of social selection and social causation in the link between SES and INT psychopathology. We found evidence of GxE, such that environmental influences on INT were greater at lower levels of income. Social selection processes also seem to be operating on the INT spectrum, although this finding should be extended with longitudinal data. Overall, our results suggest that social selection and social causation may operate in some joint manner. Individuals with manifest psychopathology may find themselves unable to fulfil important life tasks (social selection), thus exposing them to greater social stressors and hardships, which ultimately exacerbates their mental illness (social causation), leading to a downward spiral (Caspi et al. Reference Caspi, Elder and Bem1987; Miech et al. Reference Miech, Caspi, Moffitt, Wright and Silva1999).
Acknowledgment
This research was supported by the John D. and Catherine T. MacArthur Foundation Research Network on Successful Midlife Development and by a grant from the National Institute on Aging (#AG20166).
Declaration of Interest
None.


