Introduction
Although schizophrenia (SZ) has a highly heterogeneous clinical profile, there is a subset of symptoms, including delusions-of-control, delusions-of-thought-insertion and third-person auditory hallucinations, that are considered especially pathognomonic (Schneider, Reference Schneider1957). These symptoms have all been conceptualized as reflecting a difficulty in distinguishing between internally and externally generated events (Frith, Reference Frith1992). Third-person auditory hallucinations, for example, have been argued to reflect a failure to recognize the self-generated origins of one's own cognitions, leading to them being misperceived as an externally generated voice (Frith, Reference Frith1992).
The idea that patients with SZ have difficulty in distinguishing between internally and externally generated events raises the question as to what neural mechanism(s) are normatively involved in making this distinction. It has been suggested that corollary discharges (CDs) may form the basis of such a mechanism. CDs refer to neural signals that originate in frontal action–initiation regions, which are coincident with self-generated movements, and which often act to suppress the sensory consequences of these self-generated movements (Crapse & Sommer, Reference Crapse and Sommer2008b). Although the primary functions of CDs are thought to include the protection of sensory neurons from desensitization resulting from overstimulation, and the prevention of undesired motor reflexes in response to self-generated movements (Poulet & Hedwig, Reference Poulet and Hedwig2007), it has also been suggested that CDs may play a role in ‘tagging’ willed actions as self-generated, thereby enabling a distinction to be made between sensations resulting from self-generated movements and sensations resulting from changes in the external world (Neuweiler, Reference Neuweiler2003; Poulet & Hedwig, Reference Poulet and Hedwig2007; Crapse & Sommer, Reference Crapse and Sommer2008a). It has been suggested, for example, that CDs may play a role in suppressing the somatosensory cortical activity associated with tactile self-stimulation, and hence may underpin why healthy people cannot tickle themselves (Blakemore et al. Reference Blakemore, Wolpert and Frith1998, Reference Blakemore, Wolpert and Frith2000b).
In vivo evidence for CDs in primates has been provided by Eliades & Wang (Reference Eliades and Wang2003), who recorded from intracranial electrodes in the auditory cortex of marmosets and found that the activity of these neurons was substantially suppressed when the animals engaged in willed vocalization. These results are consistent with electroencephalography (EEG) evidence of auditory cortex suppression during willed speech in humans. Several studies have reported the amplitude of the N1 component of the auditory-evoked potential (a standard metric of auditory cortex excitation; Taub & Raab, Reference Taub and Raab1969; Pantev et al. Reference Pantev, Bertrand, Eulitz, Verkindt, Hampson, Schuierer and Elbert1995) to be reduced when listening to real-time feedback of self-generated speech, as compared to when listening passively to the same pre-recorded speech (Ford et al. Reference Ford, Mathalon, Heinks, Kalba, Faustman and Roth2001b, Reference Ford, Gray, Faustman, Roach and Mathalon2007). Of note, suppression of the auditory cortex has also been observed in a task in which participants performed a willed motor action (i.e. pressed a button) to deliver a burst of pre-recorded speech (Ford et al. Reference Ford, Gray, Faustman, Roach and Mathalon2007) or tones (Schafer & Marcus, Reference Schafer and Marcus1973; McCarthy & Donchin, Reference McCarthy and Donchin1976; Martikainen et al. Reference Martikainen, Kaneko and Hari2005), compared to the condition in which they listened passively to the same sounds played back. Thus it seems as though the activity of the auditory cortex is normally suppressed in response to self-generated auditory stimulation, regardless of whether the auditory sensations are evoked directly (i.e. as when engaging in willed speech) or indirectly (i.e. as when pressing a button to evoke an auditory stimulus).
Feinberg (Reference Feinberg1978) and Frith (Reference Frith1992) first developed the idea that the symptoms of SZ might be underpinned by abnormal CD signaling causing a disruption in patients' ability to distinguish between internally and externally generated events, with the characteristic ‘passivity experiences’ being the most obvious clinical manifestation. Consistent with this ‘self-monitoring’ theory, SZ patients have consistently been found to exhibit subnormal amounts of N1 suppression to self-generated speech (Ford et al. Reference Ford, Mathalon, Kalba, Whitfield, Faustman and Roth2001a, Reference Ford, Mathalon, Heinks, Kalba, Faustman and Rothb, Reference Ford, Gray, Faustman, Roach and Mathalon2007; Heinks-Maldonado et al. Reference Heinks-Maldonado, Mathalon, Houde, Gray, Faustman and Ford2007). SZ patients have also been found to exhibit subnormal N1 suppression to auditory stimulation evoked indirectly by a willed motor action (Ford et al. Reference Ford, Gray, Faustman, Roach and Mathalon2007). Thus there is evidence that SZ patients exhibit physiological abnormalities when distinguishing between internally and externally generated sensations, putatively because of irregularities in CD mechanisms.
If the symptoms of SZ are indeed underpinned by CD abnormalities, then the question arises as to what are the neural bases of these abnormalities. One possibility, investigated in the present study, is that the ‘self-monitoring’ deficits associated with SZ are caused by damage to the white-matter (WM) fiber bundles along which the CDs initiated by willed actions travel. WM is constituted primarily of bundles of myelinated axons that connect spatially disparate populations of neurons. A primary function of WM is to increase the transmission velocity of action potentials by electrically insulating axons (Baumann & Pham-Dinh, Reference Baumann and Pham-Dinh2001) and, consequently, damage to the WM has typically been found to result in conduction delays (Cowan et al. Reference Cowan, Rothwell, Dick, Thompson, Day and Marsden1984). The arcuate fasciculus is a WM fiber bundle that connects the speech/motor initiation areas of the frontal lobe (e.g. Broca's area) with the auditory cortex in the temporal lobe (e.g. Wernicke's area) (Petrides & Pandya, Reference Petrides and Pandya1988; Catani et al. Reference Catani, Howard, Pajevic and Jones2002). In light of its connections, the arcuate has been proposed as a likely route for a CD sent from the frontal speech/motor initiation areas to suppress the activity of the auditory cortex (Paus et al. Reference Paus, Perry, Zatorre, Worsley and Evans1996). Structural abnormalities in the arcuate have been consistently reported in patients with SZ, both in post-mortem microscopy studies (Uranova et al. Reference Uranova, Vostrikov, Vikhreva, Zimina, Kolomeets and Orlovskaya2007) and in vivo with structural magnetic resonance imaging (MRI) and diffusion tensor imaging (DTI) (Kanaan et al. Reference Kanaan, Kim, Kaufmann, Pearlson, Barker and McGuire2005; Kubicki et al. Reference Kubicki, McCarley, Westin, Park, Maier, Kikinis, Jolesz and Shenton2007; Whitford et al., Reference Whitford, Kubicki, Shenton, Shenton and Turetskyin press). Given the transmission delays typically associated with WM damage, it is feasible that structural damage to the arcuate could cause conduction delays in CDs traveling along this bundle. Such delays could potentially result in these CDs arriving at the auditory cortex after the auditory-evoked activity, that is too late to suppress the auditory-evoked activity. Following this argument, it is feasible that structural damage to the arcuate could underpin why SZ patients show subnormal levels of N1 suppression to self-generated auditory stimulation.
If this model were correct, then it might be possible to rectify patients' subnormal levels of N1 suppression by imposing a delay between the initiation of the audition-evoking action and the consequent auditory feedback, as this delay would lead to the simultaneous arrival of the sensory-evoked activity and the suppressing CD in the auditory cortex. Conversely, such a delay would be predicted to result in reduced levels of N1 suppression in healthy control (HC) participants, as the delay would cause the CD to arrive in the auditory cortex prior to the arrival of the sensory-evoked activity. Furthermore, it might also be expected that delaying the auditory feedback beyond a certain point would result in both HC participants and SZ patients exhibiting subnormal levels of N1 suppression, as such a delay would cause the CD to arrive in the auditory cortex prior to the sensory-evoked activity in both groups. Finally, if the inferred CD delays were caused by structural damage to the arcuate fasciculus, then it should be possible to predict the structural integrity of participants' arcuate fasciculus on the basis of their pattern of N1 suppression to undelayed versus delayed auditory feedback; that is, a participant exhibiting low levels of N1 suppression to undelayed auditory feedback but high levels of suppression to delayed feedback would be expected to (a) show poor structural integrity in the arcuate fasciculus and (b) be a SZ patient.
Although the issue of bone conduction to the inner ear precluded the possibility of delaying the sensory consequences of willed vocalizations directly (Edgerton et al. Reference Edgerton, Danhauer and Beattie1977), the present study tested the above model by using a modified version of the button-press task used by Ford et al. (Reference Ford, Gray, Faustman, Roach and Mathalon2007). In addition to the original, ‘undelayed’ condition in which participants pressed a button at will and immediately received a burst of pre-recorded speech, the present study also included two ‘delayed’ conditions in which a delay of 50 ms (the ‘delayed 50-ms’ condition) or 100 ms (the ‘delayed 100-ms’ condition) was imposed between when participants pressed the button and when the pre-recorded speech was delivered. Based approximately on the conduction delays typically observed in patients with multiple sclerosis (Cowan et al. Reference Cowan, Rothwell, Dick, Thompson, Day and Marsden1984; Jones, Reference Jones1993; Brusa et al. Reference Brusa, Jones and Plant2001), it was hypothesized that the 50-ms delay, but not the 100-ms delay, would result in improved levels of N1 suppression in the SZ patients. Specifically, it was predicted that:
(1) SZ patients would show low levels of N1 suppression in the undelayed condition, high levels of N1 suppression in the delayed 50-ms condition and low levels of N1 suppression in the delayed 100-ms condition. Conversely, HCs were predicted to show high levels of N1 suppression in the undelayed condition but low levels of suppression in the delayed 50-ms and delayed 100-ms conditions.
(2) HCs would show higher levels of fractional anisotropy (FA; a common DTI metric of WM integrity) in the arcuate fasciculus than the SZ patients.
(3) There would be a relationship between participants' FA in the arcuate fasciculus and their pattern of N1 suppression such that participants with low levels of arcuate FA would show low levels of N1 suppression in the undelayed condition but high levels of N1 suppression in the delayed 50-ms condition, and vice versa for participants with high arcuate FA.
Method
Participants
Twenty-one patients with chronic SZ were recruited for EEG testing from in-patient, out-patient and community mental health centers of the Veterans Affairs (VA) Healthcare System in Palo Alto and San Francisco, California, USA. Twenty-five HC participants, matched to the SZ patients on age, gender, years of education and parental socio-economic status, were recruited by newspaper advertisements and word of mouth. Of the 21 SZ patients and 25 HCs who participated in the EEG study, 15 SZ patients and 17 HCs also underwent DTI scanning. The clinical criteria, demographic details, clinical ratings and exclusion criteria for all participants are presented in Table 1. This study was approved by the Human Subjects Committees of the VA Healthcare System of Palo Alto and San Francisco, and the Brigham and Women's Hospital, Boston. After a detailed description of the study, all subjects gave written informed consent to participate.
Table 1. Demographic details of the subjects who participated in the electroencephalography (EEG) and diffusion tensor imaging (DTI) components of the study
BPRS, Brief Psychiatric Rating Scale (scoring from 1=not present to 7=extremely severe); CPZ, chlorpromazine; s.d., standard deviation; M, male; F, female.
All patients with SZ met DSM-IV criteria for SZ, based on the Structured Clinical Interview for DSM-IV (SCID; First et al. Reference First, Spitzer, Gibbon and Williams1997), which was conducted by a clinical psychologist. All patients were on stable, therapeutic doses of antipsychotic medication at the time of scanning. HCs were screened for the presence of an Axis-I disorder using the SCID Non-Patient Screening Module (First et al. Reference First, Spitzer, Gibbon and Williams2002). Exclusion criteria for both groups were a history of neurological disorder including epilepsy, a history of head injury causing a loss of consciousness, a history of substance abuse within the past 30 days, and left-handedness.
a HC v. SZ, p=0.88. b HC v. SZ, p=0.05. c Average of both parents before participant was 18 years old (HC v. SZ, p=0.82). d Three patients were receiving depot medications of typical antipsychotics and no dose information was available. e HC v. SZ, p=0.96. f HC v. SZ, p=0.03. g Average of both parents before participant was 18 years old (HC v. SZ, p=0.57). h HC v. SZ, p=0.07.
Experimental tasks
Auditory stimulus
Participants were instructed to repeatedly vocalize the syllable ‘ah’ into an audio headset with attached microphone. Subjects were trained to pronounce the syllable ‘ah’ in a clear and crisp manner, such that the vocalization was less than 300 ms in duration and less than 85 dB in intensity. Following training, a series of ‘ahs’ were recorded from each participant. A single sample ‘ah’ was selected from the series provided by each participant, edited to eliminate background noise and saved as a Windows.WAV file. The intensity and duration of the selected sample ‘ahs’ did not differ significantly between the SZ patients and the HCs. Each participant's own sample ‘ah’ was used as the auditory stimulus when they performed the button-press experiment, as described below.
Button-press experiment
Participants were instructed to press a button at will, while EEG was recorded continuously. Pressing the button caused each participant's own pre-recorded sample ‘ah’ to be played back to them binaurally. There were six experimental conditions each consisting of 60 randomly presented trials. In the undelayed button-press condition, the sample ‘ah’ was delivered immediately following the button-press. In the delayed 50-ms button-press condition, the sample ‘ah’ was delivered 50 ms after the button-press. The delayed 100-ms button-press condition was calculated similarly. These three conditions were each compared to a passive-listening condition in which the sample ‘ah’ was delivered to the participant without them pressing the button. A seventh control condition was also included in which participants were instructed to press the button at approximately the same pace that they had for the undelayed and delayed conditions, except that no stimulus was delivered. The purpose of the control condition was to enable the EEG activity associated with simple button pressing to be subtracted from the EEG activity evoked by the two experimental conditions, as done previously (Schafer & Marcus, Reference Schafer and Marcus1973; McCarthy & Donchin, Reference McCarthy and Donchin1976; Martikainen et al. Reference Martikainen, Kaneko and Hari2005; Ford et al. Reference Ford, Gray, Faustman, Roach and Mathalon2007).
Data acquisition and analysis
EEG acquisition and processing
EEG data were acquired with a Neuroscan SynAmps system (0.05–100 Hz band-pass filter, 1000 Hz analog-to-digital conversion rate, 12 dB/octave roll-off) from 42 sites referenced to the nose. During pre-processing, data were re-referenced to the mastoid electrodes, to minimize talking artifacts from the nose. Additional electrodes were placed on the outer canthi of both eyes and above and below the right eye to measure eye movements and blinks (vertical and horizontal electro-oculogram; VEOG, HEOG). High- and low-frequency signals were attenuated with a 0.5–15 Hz band-pass filter. The EEG data were segmented into 500-ms epochs, with each epoch consisting of the 100 ms prior to and the 400 ms subsequent to the onset of the ‘ah’. VEOG and HEOG data were used to correct EEG for eye movements and blinks by using a regression-based algorithm (Gratton et al. Reference Gratton, Coles and Donchin1983). Trials containing motor artifacts (classified as voltages exceeding ±50 μV) were rejected. The artifact-free trials in the undelayed, delayed 50-ms and delayed 100-ms conditions were averaged separately for each participant. The number of artifact-free trials did not differ between the SZ patients and the HCs for either the button-press or passive-listening subconditions for any of the three delay conditions (all p values >0.15). The artifact-free trials in the control condition were also averaged for each participant, and the resultant event-related potential (ERP) waveform was subtracted from the averaged ERP waveforms for the three delay conditions (Ford et al. Reference Ford, Gray, Faustman, Roach and Mathalon2007). The N1 component was then identified on the adjusted undelayed, delayed 50-ms, delayed 100-ms and passive-listening ERP waveforms as the most negative local minimum potential between 50 and 175 ms following the onset of the stimulus. The amplitude of the N1 component was measured relative to the average of a 100 ms pre-stimulus baseline for each condition, and its polarity was inverted for ease of analysis. N1 suppression was calculated as the N1 amplitude of the auditory-evoked potential to button-press elicited speech (i.e. in the undelayed, delayed 50-ms and delayed 100-ms conditions) subtracted from the N1 amplitude elicited in the passive-listening condition. The amount of N1 suppression at electrode Cz was used for statistical analysis given that (a) a large N1 component is typically observed at Cz in response to bilateral auditory stimulation, and (b) Cz was the electrode for which N1 suppression was maximal in the Ford et al. (Reference Ford, Gray, Faustman, Roach and Mathalon2007) study, on which the current protocol is based.
DT image acquisition
Diffusion-weighted images were collected with an echo–planar imaging sequence on a 3-T GE Signa system (General Electric Medical Systems, USA). Fifty-five axial slices providing whole-brain coverage were acquired parallel to the AC–PC line. As was standard at the commencement of participant recruitment, the parameters for DTI were: 12 gradient directions (b=850 s/mm2) and 1 b0 image per excitation, number of excitations (NEX)=6, matrix=128×128 mm, field of view (FOV)=250 mm, slice thickness=3.1 mm with a 0.4 mm gap. DT images were constructed from the diffusion-weighted images using a least-squares estimation method.
Extraction of the arcuate fasciculus
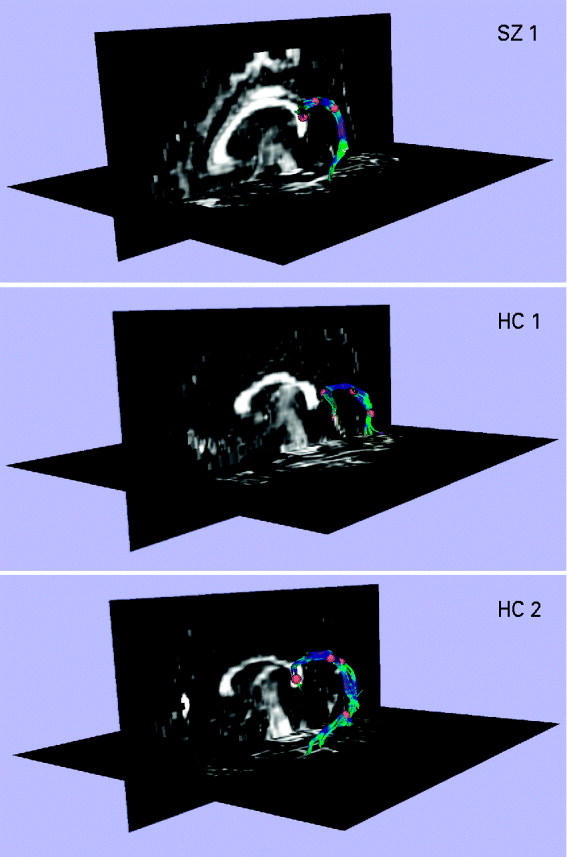
The left arcuate fasciculus was extracted from the DT images using deterministic tractography (Rosenberger et al. Reference Rosenberger, Kubicki, Nestor, Connor, Bushell, Markant, Niznikiewicz, Westin, Kikinis, Saykin, McCarley and Shenton2008), implemented in the Slicer-3 software package (www.slicer.org). The left arcuate was chosen for analysis because the arcuate fasciculus is often poorly defined in the right hemisphere (Parker et al. Reference Parker, Luzzi, Alexander, Wheeler-Kingshott, Ciccarelli and Lambon Ralph2005). The protocol used for tractography and extraction is described and illustrated in Fig. 1. Once the fibers of the arcuate fasciculus had been extracted, a binary label map was generated for each subject by labeling those voxels through which any fibers passed. FA (Basser & Pierpaoli, Reference Basser and Pierpaoli1996) was calculated for every voxel in each subject's label map, and was multiplied by 1000 for ease of presentation. The mean FA of all voxels in the label map was calculated for each subject, and this value was used in the statistical analysis.

Fig. 1. Extracting the left arcuate fasciculus from participants' diffusion tensor (DT) images with deterministic (streamline) tractography. The extracted arcuates of three representative participants, one patient with schizophrenia (SZ) and two healthy controls (HCs), are shown overlaid onto a sagittal and axial slice of their fractional anisotropy (FA) image. The first step in the tractography procedure involved manually placing a cubic region of interest (i.e. a fiducial) of side 3.5 mm in the dorsal longitudinal fibers of the arcuate fasciculus, according to the protocol of Catani et al. (Reference Catani and Thiebaut de Schotten2008). The voxels defined by this fiducial were then used as seedpoints for deterministic (streamline) tractography, which followed the direction defined by the principal eigenvector. A step size of 1.5 mm was used, and tractography was terminated upon reaching a voxel of FA <0.25 (the stopping criterion). The small number of voxels defined by the fiducial meant that immediate feedback was available as to the legitimacy of the fiducial's location. The spatial position of the fiducial was then adjusted until the distinctive ventrally projecting, curved fibers of the arcuate fasciculus became apparent. Additional fiducials (typically between 1 and 3) were then placed along the length of the arcuate to augment the fiber bundle. The fiducials for all participants were placed by a single rater who was blind to subject diagnosis.
Statistical analysis
All analyses were performed in SPSS version 17 (www.spss.com). A repeated-measures ANOVA, with one within-group factor (delay; undelayed v. delayed 50-ms v. delayed 100-ms) and one between-group factor (diagnosis; SZ v. HC), was used to investigate the effect of delay condition on level of N1 suppression at electrode Cz. In the case of a significant interaction or main effect, one-tailed t tests were used to investigate the underlying simple effects, given the directional hypotheses. An independent-samples t test was used to investigate whether SZ patients exhibited FA reductions in the left arcuate fasciculus, relative to the HCs. Linear regression was used to investigate whether participants' FA in the arcuate could be predicted on the basis of their level of N1 suppression in the undelayed, delayed 50-ms and delayed 100-ms conditions.
Results
EEG results
The repeated-measures ANOVA revealed a significant interaction between diagnosis (SZ v. HC) and delay condition (undelayed, delayed 50-ms and delayed 100-ms) in the amount of N1 suppression at electrode Cz [F(2, 88)=3.751, p=0.027] (see Fig. 2. As predicted, the SZ patients exhibited significantly lower amounts of N1 suppression in the undelayed condition compared to the HCs [t(44)=1.762, p=0.042]. Conversely, the SZ patients exhibited significantly higher amounts of N1 suppression in the delayed 50-ms condition compared to the HCs [t(44)=1.910, p=0.031]. There was no significant difference between the SZ patients and HCs in amount of N1 suppression in the delayed 100-ms condition [t(44)=0.533, p=0.597]. The SZ patients showed a non-significant trend for reduced N1 amplitudes, across the three delay conditions, in both the passive-listening [F(1, 44)=3.717, p=0.060] and button-press subconditions [F(1, 44)=3.618, p=0.064]. Similarly, the SZ patients showed a non-significant trend for increased N1 latencies across the three delay conditions in the button-press subcondition [F(1, 44)=3.601, p=0.064], but not the passive-listening subcondition [F(1, 44)=1.869, p=0.179].

Fig. 2. The relationship between delay condition (i.e. undelayed v. delayed 50-ms v. delayed 100-ms) and level of N1 suppression in 21 patients with schizophrenia (SZ; –▪–) and 25 matched healthy controls (HC; –○–). The vertical axis shows the level of N1 suppression (i.e. the amplitude of the N1 component of the auditory-evoked potential induced by the pre-recorded speech elicited by the willed button-press subtracted from the amplitude of the N1 component of the evoked potential induced by listening passively to the pre-recorded speech). Thus an N1 suppression value of 2 μV would indicate that the subject exhibited an N1 amplitude to the passively presented speech that was 2 μV larger that their N1 amplitude to the same speech induced by the willed button-press. The error bars show the standard error of the mean.
DTI results
The SZ patients were observed to exhibit significantly reduced levels of FA in the arcuate fasciculus, relative to the HCs [t(30)=2.134, p=0.041] (see Fig. 3).

Fig. 3. The average fractional anisotropy (FA; ×1000) of the left arcuate fasciculus in 15 patients with schizophrenia (SZ; ▪) and 17 matched healthy controls (HCs;
![]() ). The average FA was calculated for each subject by averaging the FA of all voxels through which any tractography defined fibers passed. The error bars show the standard error of the mean.
). The average FA was calculated for each subject by averaging the FA of all voxels through which any tractography defined fibers passed. The error bars show the standard error of the mean.
Relationship between EEG and DTI
Linear regression was used to investigate whether participants' FA in the arcuate (i.e. the dependent variable) could be predicted on the basis of their level of N1 suppression in the undelayed, delayed 50-ms and delayed 100-ms conditions (i.e. the predictor variables). The dummy variable ‘diagnosis’ was also entered into the model. The model:
accounted for a significant proportion (39.4%) of the variance in FA [F(4, 31)=4.395, p=0.007]. To control for the possibility that the slopes of the three predictor variables differed between the patients and controls, the three diagnosis×delay interaction terms were included in the model in a separate block. Adding these interaction terms did not significantly augment the amount of variance accounted for by the model [R 2 change=0.087, F change(3, 24)=1.335, p=0.286], indicating that the slopes of the three delay conditions did not differ between the patient and control groups. The interaction terms were subsequently dropped from the model, as was delayed 100-ms, given that it was the weakest predictor variable (β=−0.166, p=0.328) and dropping it did not result in a significant reduction in the variance accounted for by the model [R 2 change=0.022, F change(1, 27)=0.991, p=0.328]. The revised model:
accounted for 37.2% of the variance in FA [F(3, 31)=5.532, p=0.004]. As evidenced by the signs of the coefficients, the revised model indicated that participants with high amounts of N1 suppression in the undelayed condition but low levels of N1 suppression in the delayed 50-ms condition were likely to exhibit high levels of FA in the arcuate fasciculus. This point was illustrated by the significant positive correlation observed between participants' arcuate FA and their N1 suppression in the undelayed condition minus their N1 suppression in the delayed 50-ms condition, across diagnosis [partial r(29)=0.502, p=0.004] (see Fig. 4).

Fig. 4. Correlation between fractional anisotropy (FA; ×1000) in the arcuate fasciculus and N1 suppression level in the undelayed condition minus N1 suppression level in the delayed 50-ms condition for 15 patients with schizophrenia (SZ; ▪) and 17 matched healthy controls (HCs; ○). The dashed-and-dotted line labeled ‘SZ’ shows the line of best fit (LOBF) for the SZ patients alone. The dashed line labeled ‘HC’ shows the LOBF for the HC participants alone. The solid black line labeled ‘Combined LOBF’ shows the LOBF for both groups combined. The vertical line shows the line at which a participant's level of N1 suppression in the undelayed condition was equal to their level of N1 suppression in the delayed 50-ms condition [i.e. N1 suppression (undelayed) – N1 suppression (delayed 50-ms)=0].
Discussion
All three hypotheses were supported by the results. As predicted, the SZ patients exhibited subnormal levels of N1 suppression to self-initiated undelayed auditory stimuli, supranormal levels of N1 suppression to self-initiated 50-ms delayed auditory stimuli and comparably low levels of N1 suppression to self-initiated 100-ms delayed auditory stimuli, relative to the matched HCs. The SZ patients also exhibited subnormal levels of FA in the arcuate fasciculus. Given that the arcuate fasciculus represents a likely route for a frontally generated CD projecting to the auditory cortex, and in light of the observed association between participants' FA in the arcuate and their pattern of N1 suppression across delay conditions, this result suggests a possible anatomical basis for the N1 suppression abnormalities exhibited by the SZ patients.
The findings of this study are significant in several respects. First, these results add to the growing body of literature indicating that SZ patients exhibit abnormally high levels of cortical activity in response to self-generated sensory stimuli, in contrast to their typically low levels of cortical activity to externally produced stimuli (Shelley et al. Reference Shelley, Silipo and Javitt1999). As discussed previously, SZ patients have been shown to exhibit abnormally large amplitudes of the N1 component of the auditory-evoked potential in response to both willed speech (Ford et al. Reference Ford, Mathalon, Heinks, Kalba, Faustman and Roth2001b, Reference Ford, Gray, Faustman, Roach and Mathalon2007; Heinks-Maldonado et al. Reference Heinks-Maldonado, Mathalon, Houde, Gray, Faustman and Ford2007) and button-press-elicited auditory stimuli (Ford et al. Reference Ford, Gray, Faustman, Roach and Mathalon2007). However, there is also evidence indicating that SZ patients show abnormal suppression of self-generated sensations in other sensory domains. Blakemore et al. (Reference Blakemore, Smith, Steel, Johnstone and Frith2000a), for example, found that actively psychotic SZ patients rated self-generated tactile sensations as being equally ticklish to externally generated tactile sensations, in contrast to HCs who rated self-generated sensations as less ticklish. Thus, the subnormal levels of N1 suppression exhibited by the SZ patients in the present study add to the evidence that SZ patients have physiological difficulties in differentiating between internally and externally generated sensations, putatively because of abnormalities in the CD mechanisms customarily involved in making this distinction.
Second, the results of this study provide an insight into the nature of the CD dysfunctions proposed to exist in patients with SZ. It seems feasible that for a CD to be effective in suppressing the cortical activity associated with a self-generated sensory stimulus, its arrival at the sensory cortex must be approximately concurrent with the sensory-evoked activity. Based on this assumption, the fact that the subnormal levels of N1 suppression exhibited by the SZ patients in the undelayed condition could be normalized by imposing a 50-ms delay between the button-press (and the putative initiation of the CD) and the auditory stimulus suggests that the CD was abnormally late in arriving at the sensory cortex in the undelayed condition, and was consequently unable to suppress the activity evoked by the self-generated auditory stimulus. This would also explain why the 50-ms delay resulted in a significant reduction in the amount of N1 suppression exhibited by the HCs, as the delay would have caused the usually punctual CD to arrive at the auditory cortex too early to suppress the sensory-evoked activity. This would also explain why both the SZ patients and HCs exhibited similarly low levels of N1 suppression in the delay 100-ms condition, as the delayed auditory feedback would arrive at the auditory cortex approximately 100 ms after the CD in the HCs and approximately 50 ms after the CD in the SZ patients. This model is consistent with the findings of Aliu et al. (Reference Aliu, Houde and Nagarajan2009), who found that whereas undelayed, button-press elicited auditory stimuli induced significant suppression of the M100 (the magnetoencephalography equivalent of the N1) in healthy subjects, M100 suppression was not observed when a 100-ms delay was imposed between the button-press and the stimulus delivery. This model is also consistent with the findings of Blakemore et al. (Reference Blakemore, Wolpert and Frith2000b), who observed that whereas healthy subjects rated self-initiated tactile sensations (generated indirectly by a robotic arm) to be less ticklish than externally initiated sensations, they rated the sensations as equally ticklish if a delay was introduced between when subjects instructed the arm to tickle and when it actually executed the instruction.
With respect to the question as to why the SZ patients would exhibit abnormally delayed CDs, the fact that these patients exhibited subnormal levels of FA in the arcuate fasciculus, combined with the fact that a linear relationship was observed between participants' FA in the arcuate and their pattern of N1 suppression across delay conditions, suggests that the inferred CD delays could have been caused, at least in part, by structural damage to this fiber bundle. Structural damage to the WM can often result in conduction delays observable with EEG. Patients with multiple sclerosis who experience demyelination of the optic nerve, for example, typically exhibit delays of between 10 and 50 ms in the latency of the P100 component of the visually-evoked potential (Cuypers et al. Reference Cuypers, Dickson, Pinckers, Thijssen and Hommes1995; Kesselring, Reference Kesselring1997). Although FA is a relatively non-specific index of fiber integrity, insofar as FA reductions have been found to be associated with demyelination, dysmyelination and damage to the axon membrane (Beaulieu, Reference Beaulieu2002), subnormal levels of FA are generally thought to reflect WM pathology. Thus, the fact that the SZ patients exhibited subnormal levels of FA in the arcuate fasciculus, which is a fiber bundle that directly connects the putative frontal sites of CD initiation with the auditory cortex, suggests a possible anatomical basis for the inferred CD delays in these patients.
A major finding of the present study was that SZ patients' characteristically subnormal levels of N1 suppression could be normalized by imposing a 50-ms, but not a 100-ms, delay between their performance of a willed motor action and their receipt of auditory feedback. We have suggested that the 50-ms delay may have been ‘special’ in that it may have approximated the time by which the action-initiated CD was delayed in its arrival to the auditory cortex in the SZ patients. However, in the absence of a comprehensive investigation into the effects of a variety of delay periods on N1 suppression in SZ patients, which is, we suggest, a worthwhile aim for future research, this remains speculation. A second limitation of the present study common to the vast majority of SZ research studies relates to the fact that almost all of the SZ patients were currently being treated with neuroleptic medications, which have been suggested to influence both brain structure and psychophysiology (Konopaske et al. Reference Konopaske, Dorph-Petersen, Sweet, Pierri, Zhang, Sampson and Lewis2008). Although there is little evidence to suggest that antipsychotic medications affect conduction velocity directly (e.g. Reznik et al. Reference Reznik, Volchek, Mester, Kotler, Sarova-Pinhas, Spivak and Weizman2000; Dong et al. Reference Dong, Jia, Lu, Zhou, Cohen-Williams, Hodgson, Li and Priestley2008), Faravelli et al. (Reference Faravelli, Di Bernardo, Ricca, Benvenuti, Bartelli and Ronchi1999) did observe conduction delays in the peripheral nervous system in bipolar patients chronically treated with lithium. In light of these findings, the results of this study should be treated as preliminary until they can be replicated in neuroleptic-naive SZ patients.
In addition to providing support for the ‘disconnection hypothesis’ of SZ (i.e. the idea that SZ is fundamentally underpinned by abnormal interactions between brain regions as opposed to abnormal brain regions per se; Friston, Reference Friston1999), this study provides evidence for the idea that SZ is underpinned by physiological abnormalities in distinguishing between internally and externally generated events (Feinberg, Reference Feinberg1978; Frith, Reference Frith1992; Fletcher & Frith, Reference Fletcher and Frith2009) that potentially result from white-matter abnormalities in fibers connecting regions of action initiation with regions involved in processing their sensory consequences. Aside from their theoretical implications as to the etiology of SZ, the results of this study also have implications for potential future treatment strategies, such as the possibility of using remyelinating medications in the treatment of the disorder (Bartzokis, Reference Bartzokis2002), and the possibility of using biofeedback to help modulate patients' cortical responsivity to self-generated sensory stimuli (Gruzelier, Reference Gruzelier2000).
Acknowledgments
T.J.W. is supported by an Overseas-Based Biomedical Training Fellowship from the National Health and Medical Research Council of Australia (NHMRC 520627), administered through the University of Melbourne. M.K. is supported by grants from the National Institutes of Health (NIH) (R03 MH068464-0; R01 MH 50747 to MES), the Harvard Medical School (Milton Award), and the National Alliance for Research on Schizophrenia and Depression. J.S.S. is supported by a fellowship from the NIH (T32 MH 016259). M.E.S. is supported by grants from the NIH (K05 MH 070047 and R01 MH 50747), the Department of Veterans Affairs (VA Merit Award, VA Research Enhancement Award Program and VA Schizophrenia Research Center Grant), and the Boston Center for Intervention Development and Applied Research (CIDAR) funded through a center grant mechanism (P50 MH 080272). S.B. is supported by grants from the NIH (RO1 MH 082918) and the Center for Integration of Medicine and Innovative Technology Soldier in Medicine Award. R.A.A. is supported by grants from the NIH (R01 DA 027802), Sloan Foundation, Esther A. & Joseph Klingenstein Fund, Dana Foundation, and the National Alliance for Research on Schizophrenia and Depression. D.H.M. is supported by the Department of Veterans Affairs and the NIH (R01 MH076989). J.M.F is supported by the Department of Veterans Affairs and the NIH (R01 MH058262, K02 MH067967).
Declaration of Interest
None.