


Introduction
Determining whether a patient is underweight is a crucial step in eating disorder evaluation. Indeed, ‘refusal to maintain body weight at or above a minimally normal weight for age and height (e.g. weight loss leading to maintenance of body weight less than 85% of that expected)’ is listed as the first diagnostic criterion for anorexia nervosa (AN) in DSM-IV (APA, 2000, p. 589). Although the 85% weight cut-off is intended to represent a ‘suggested guideline’ for diagnosis (APA, 2000, p. 584), investigators who enroll eating disorder patients in clinical trials (Dare et al. Reference Dare, Eisler, Russell, Treasure and Dodge2001; Powers et al. Reference Powers, Santana and Bannon2002) and insurance companies that determine treatment eligibility typically adhere to this percentage when assessing underweight. The 85% criterion is also frequently used to calculate AN prevalence in epidemiological studies (Walters & Kendler, Reference Walters and Kendler1995; Garfinkel et al. Reference Garkfinkel, Lin, Goering, Spegg, Goldbloom, Kennedy, Kaplan and Woodside1996), which inform the perceived public health significance of the disorder. The widespread use of the 85% criterion probably reflects a desire to standardize diagnosis across diverse settings. However, because DSM-IV provides only general guidelines on expected body weight (EBW) calculation, researchers and clinicians have used several different methods to create the denominator of the 85% equation, including various versions of the Metropolitan Life Insurance Tables (Metropolitan Life Insurance Company, 1959, 1983) and the 1979 Department of Health, Education, and Welfare standards (DHEW, 1979). The degree to which these methods converge remains unknown, and the field may not fully appreciate the potential impact of EBW calculation on differential diagnosis because the ubiquitous citation of the 85% criterion creates a sense of false consensus.
Data from clinical and non-clinical samples suggest that eating disorder not otherwise specified (EDNOS) is the most prevalent of DSM-IV eating disorders, and individuals who meet all criteria for AN except the weight cut-off represent a common subtype of this group (Watson & Andersen, Reference Watson and Andersen2003; McIntosh et al. Reference McIntosh, Jordan, Carter, McKenzie, Luty, Bulik and Joyce2004). A computer simulation of 193 eating-disorder treatment seekers indicated that the prevalence of AN would increase significantly if the weight criterion were relaxed from 85% to 90% of EBW (Thaw et al. Reference Thaw, Williamson and Martin2001). It is therefore likely that if some clinics use more lenient methods of calculating EBW, they will diagnose a greater proportion of their patients with AN and a relatively smaller proportion of patients with EDNOS, even if they consistently apply an 85% cut-off.
The calculation of EBW plays an important role in eating disorder treatment as well as diagnosis. According to recent guidelines produced by the National Institute for Clinical Excellence (NICE, 2004), evidence-based treatments differ substantially across eating disorders, which are in part defined by degree of underweight. NICE strongly recommends individual cognitive behavioral therapy for the treatment of adult bulimia nervosa (BN) (individuals>85% EBW) and tentatively recommends family-based treatment for adolescent AN (individuals<85% EBW). However, in the absence of data, no firm recommendations could be made for the treatment of EDNOS (individuals of variable body weight). Furthermore, the American Psychiatric Association Work Group on Eating Disorders suggests that in-patient hospitalization or residential treatment should be considered for eating disorder patients who weigh<85% of healthy body weight (APA, 2006), and a major third-party health-care provider requires that patients weigh<80% of EBW in order to receive residential treatment reimbursement. The decision to move from one phase of treatment to another is also informed by percentage EBW. Howard et al. (Reference Howard, Evans, Quintero-Howard, Bowers and Andersen1999) recommended discharging AN in-patients from the hospital at 90% of EBW, and Lock et al. (Reference Lock, Le Grange, Agras and Dare2001) used the same 90% threshold to determine when to shift food choices from parents to patients in their family-based AN treatment. Thus, differential EBW calculation across clinical sites could result in eating disorder patients with identical height-and-weight profiles receiving very different treatment approaches, despite attempts to adhere to evidence-based practice.
Therefore, the purpose of the present study was threefold: (1) to identify different methods investigators have used for determining whether patients meet the weight criterion for AN, (2) to evaluate the degree of discrepancy across methods, and (3) to determine the extent to which these discrepancies impact the proportion of individuals who meet the weight criterion for AN in both population-based and treatment-seeking samples. Because diagnosing underweight requires different procedures for children versus adults (i.e. children must be evaluated with growth charts that account for projected height and weight increases over time), the present study focused on the assessment of the AN weight criterion among individuals aged ⩾18 years.
Method
Study population and inclusion criteria
To identify studies that provided descriptive information on how AN diagnoses are determined in clinical and research settings, we targeted two distinct empirical literatures. First, we identified studies comparing AN to subclinical eating disorders (i.e. EDNOS) because clinicians seeking to assign full versus partial eating disorder diagnoses must assess each diagnostic criterion. EDNOS studies were included if they applied the same diagnostic methods to assess (and thus differentiate between) AN and EDNOS subjects, and assessed current rather than past symptoms (to make it more likely that diagnostic methods would be specifically described in the article). Second, we identified treatment outcome studies of adult AN because investigators must apply the AN weight criterion to evaluate trial eligibility and treatment efficacy. As the 85% criterion was introduced in DSM-III-R, EDNOS studies and AN treatment trials were eligible for inclusion if they were published between January 1987 and February 2007 and used DSM-IV, DSM-III-R or ICD-10 criteria for AN. Only English-language reports were included.
Study search strategy
EDNOS studies
Because the EDNOS literature has not yet been comprehensively reviewed, we conducted an original literature search. Eligible studies were identified by four steps. First, five electronic databases (PsycINFO, Medline, EMBASE, PubMed and CINAHL) were searched with the terms ‘EDNOS’ and ‘eating disorder not otherwise specified’. Four databases that feature the capability to search for adjacent words within the body of an article (PsycINFO, Medline, EMBASE and CINHAL) were additionally queried with the terms ‘eating disorders’, ‘anorexia’, ‘bulimia’ and ‘binge eating disorder’ adjacent within five words to the terms ‘atypical’, ‘partial’, ‘residual’, ‘subclinical’, ‘subthreshold’, ‘subsyndromal’, ‘continuum’, ‘unspecified’, ‘non-specified’, ‘NOS’ or ‘non-classified’. Second, all issues published between January 1987 and February 2007 of the four journals determined by the SCOPUS database to publish the greatest number of eating disorder studies were hand-searched for eligible articles. These journals included the International Journal of Eating Disorders, European Eating Disorders Review, Eating and Weight Disorders, and American Journal of Psychiatry. Third, the online database Interdisciplinary Dissertations & Theses was queried with ‘anorexia nervosa’, ‘EDNOS’ and ‘eating disorders not otherwise specified’ to locate unpublished studies. Fourth, the reference sections of studies retrieved through these first three methods were searched for eligible citations. At the end of this process, 88 EDNOS articles met eligibility criteria for the present study.
AN treatment trials
Because this literature has already been comprehensively reviewed, we identified a list of controlled and uncontrolled psychotherapy and medication treatment trials for AN from two recent reviews (Le Grange & Lock, Reference Le Grange and Lock2005; Bulik et al. Reference Bulik, Berkman, Brownley, Sedway and Lohr2007). Of these, 11 articles evaluating treatments for adult AN were included in the present study. (This gave an overall total of 99 articles included in the present study, available in the online Appendix.)
Study coding
Two master's-level clinical psychology doctoral students coded the 99 studies by identifying the method investigators had used to determine whether subjects met the weight criterion for AN. Coders agreed on the methods used in 93 (94.0%) of the 99 studies and came to a mutual consensus through discussion on the remaining six (6.0%), inter-rater reliability κ=0.90.
Database of AN weight thresholds
After ascertaining how each study calculated the AN weight cut-off, we re-created a distribution of AN weight thresholds for individuals of each height and sex. To calculate 85% of EBW, we referred to the original normative weight tables cited by study authors. When weight tables provided ranges rather than point estimates, the midpoint of the range was defined as the EBW. When tables provided different weight ranges for small, medium and large frames, the midpoint of the medium-frame range was used because approximately 50% of the population is classified as medium frame (Metropolitan Life Insurance Company, 1983). If study authors used age-adjusted weights, we created separate sets of weight thresholds for each age group. Because some tables provided clothed and others provided unclothed weights, all weights were standardized to represent weight without clothes and height without shoesFootnote 1Footnote †. Once we adjusted for age and clothing, we multiplied the distribution of EBWs derived through each method by 0.85 to determine the respective AN weight thresholds.
Participants
To determine the impact of discrepancies in the AN weight threshold on the proportion of individuals meeting the weight criteria for AN, we applied each set of weight thresholds to a nationally representative and treatment-seeking sample.
Nationally representative sample
Participants were drawn from the publicly available National Health and Nutrition Examination Survey (NHANES) 1999–2004 database, which provides a representative sample of the non-institutionalized civilian US population (CDC, 2007). Of the 12962 participants aged 18–65 years who underwent the NHANES medical examination, 12001 (mean age=38.4 years, s.d.=14.60) provided height and weight data. Participants included 5651 (47.1%) males and 6350 (52.9%) females. Twenty-six per cent self-identified as Mexican American, 25.9% as non-Hispanic White, 22.3% as other Hispanic, 21.9% as non-Hispanic Black, and 4.2% as multi-racial or other race. Health technicians measured participants' weight in paper gowns using a digital scale, and participants' height using a digital stadiometer. The National Center for Health Statistics Institutional Review Board reviewed and approved the data collection, and written informed consent for NHANES was obtained from each participant.
Treatment-seeking sample
Participants comprised 189 females aged 18–65 (mean=28.62, s.d.=8.39) years who telephoned the Eating Disorders Research Unit at the New York State Psychiatric Institute seeking treatment for AN from January 2005 to March 2007. Participants seeking treatment exclusively for BN or binge eating disorder were excluded. Participants self-reported their height, weight and other clinical information during a telephone screen. When subjects reported a weight range, we recorded the average as a point estimate. Because of the brevity of telephone screening, ethnicity data were unavailable. The Institutional Review Board at the New York State Psychiatric Institute approved the collection of these data and their use in the present study.
Data analysis
For participants in both samples, body mass index (BMI) was calculated as weight in kilograms divided by height in meters squared (kg/m2). After BMI was calculated, measurements were converted to the Imperial system and heights were rounded to the nearest inch for use with normative weight tables. To assess the degree of correlation among weight cut-offs produced through each method, we calculated a series of bivariate correlation coefficients. To evaluate discrepancies across methods, we subtracted the lowest cut-off from the highest cut-off produced for each height, and calculated the mean and standard deviation of these valuesFootnote 2.
Participants whose height fell outside the range provided by a normative weight table were excluded from analyses using that particular weight table because no AN weight cut-off could be calculated. To assess the prevalence of individuals in the NHANES sample who met the weight cut-off for AN under each method, we used the SAS proc surveymeans procedure (SAS Institute, Cary, NC, USA) to account for oversampling of minority groups, survey non-response, and other stratification factors. We calculated 6-year sampling weights for use in all statistical analyses so that results are reflective of the demographic breakdown of 2000 US Census data. To evaluate whether the proportion of participants who met the AN weight criterion differed by EBW calculation, we conducted a series of McNemar tests to assess for significant differences between dependent proportions. We set the overall α level to 0.001 to provide a Bonferroni correction for family-wise error rate across the (nine choose two) 36 unique pairwise comparisons within each sample.
Results
Methods of determining the AN weight threshold
Sixty-three (63.6%) of the 99 articles in the study population did not describe how authors calculated EBW, and a further nine studies reported using percentage of EBW but did not cite a specific table. Another three studies (Vandereycken & Pieters, Reference Vandereycken, Pieters, Herzog, Deter and Vandereycken1992; Klibanski et al. Reference Klibanksi, Biller, Schoenfeld, Herzog and Saxe1995; Cachelin & Maher, Reference Cachelin and Maher1998) cited the Metropolitan Life Insurance Tables but did not specify which version, and one study (Fairburn et al. Reference Fairburn, Cooper, Doll and Davies2005) described using BMI but did not cite which value.
The remaining 23 studies (22.3%) described their methods in sufficient detail so that specific weight cut-offs could be recalculated for use in the present study. Seven of the 23 studies (Clinton & Norring, Reference Clinton and Norring1999; Lee et al. Reference Lee, Lee, Ngai, Lee and Wing2001, Reference Lee, Chan and Hsu2003; Solenberger, Reference Solenberger2001; Turner & Bryant-Waugh, Reference Turner and Bryant-Waugh2004; McIntosh et al. Reference McIntosh, Jordan, Carter, Luty, McKenzie, Bulik, Frampton and Joyce2005; Abbate-Daga et al. Reference Abbate-Daga, Piero, Gramaglia, Gandione and Fassino2007) created an absolute BMI cut-off, and another study (Strokosch et al. Reference Strokosch, Friedman, Wu and Kamin2006) described using the 10th percentile BMI for gender and age based on Hebebrand et al. (Reference Hebebrand, Himmelmann, Heseker, Schafer and Remschmidt1996). The other 15 studies (Lee et al. Reference Lee, Ho and Hsu1993; Gowers et al. Reference Gowers, Norton, Halek and Crisp1994; Schork et al. Reference Schork, Eckert and Halmi1994; Fullerton et al. Reference Fullerton, Wonderlich and Gosnell1995; Carlat et al. Reference Carlat, Camargo and Herzog1997; Attia et al. Reference Attia, Haiman, Walsh and Flater1998; Schaefer et al. Reference Schaefer, Maclennan, Yaholnitsky-Smith and Stove1998; Mizes et al. Reference Mizes, Christiano, Madison, Post, Seime and Varnado2000, Reference Mizes, Heffner, Madison and Varnado-Sullivan2004; Kaye et al. Reference Kaye, Toshihiko, Weltzin, Hsu, Sokol, McConaha, Plotnicov, Weise and Deep2001; Williamson et al. Reference Williamson, Womble, Smeets, Netemeyer, Thaw, Kutlesic and Gleaves2002; Pike et al. Reference Pike, Walsh, Vitousek, Wilson and Bauer2003; Miller et al. Reference Miller, Grieco and Klibanski2005; Levine et al. Reference Levine, Gur, Loewenthal, Vishne, Dwolatzky, Van Beynum, Sela, Vered, Yoseff and Stein2007; Roberto et al., Reference Roberto, Steinglass, Mayer, Attia and Walsh2008) calculated 85% of EBW based on specific tables of norms, including Kemsley's (Reference Kemsley1951/2) Average Body Weights; 1959 Metropolitan Life Insurance Tables; 1983 Metropolitan Life Insurance Tables; the 1975 Fogarty Table of Desirable Weights (Bray, Reference Bray1975); 1979 Department of Health, Education, and Welfare norms (DHEW, 1979); and Chiu's (Reference Chiu1978) norms for Chinese adults. In sum, coders identified 10 distinct methods for determining whether individuals met the weight criterion for AN (see Table 1 for a brief description of each method). Because one study (Lee et al. Reference Lee, Chan and Hsu2003) used weight tables available only in Chinese (Chiu, Reference Chiu1978), the following analyses are based on nine different English-language methods cited in the recent literature as representing possible weight cut-offs for AN.
Table 1. Nine methods used in the recent literature for calculating the AN weight criterion and the cut-offs derived from each method for a 20-year-old female and male of average height

AN, Anorexia nervosa; EBW, expected body weight; lb, pounds.
Degree of discrepancy across methods
Figs 1 and 2 depict AN weight cut-offs derived through each method across a full range of heights for females and males. Because all methods produced progressively higher cut-offs for individuals of increasing heights, cut-offs correlated positively with one another across methods for both males and females (all r's⩾0.92). However, point estimates differed substantially. Table 1 provides example AN weight cut-offs for a 20-year-old female of average height (5′ 4″) and a 20-year-old male of average height (5′ 9″). The mean difference between the lowest and the highest AN weight cut-off for each height was 15.03 (s.d.=2.38) lb for females and 25.88 (s.d.=5.29) lb for males.

Fig. 1. Anorexia nervosa (AN) weight cut-offs (y axis) for females 4′ 10″ to 5′ 11″ (x axis) ascertained through nine different methods recently used in the empirical literature.

Fig. 2. Anorexia nervosa (AN) weight cut-offs (y axis) for males 5′ 2″ to 6′ 3″ (x axis) ascertained through nine different methods recently used in the empirical literature.
Proportion of the nationally representative sample meeting the weight criterion for AN
Table 2 presents the percentage of individuals in the nationally representative sample who met the AN weight criterion under each of the nine methods. Using the lowest weight cut-off (BMI<16.5), only 0.23% met the weight criterion, whereas the prevalence increased 43-fold to 10.10% under the highest cut-off (DHEW, 1979). McNemar tests for all 36 unique pairwise comparisons indicated that the majority of methods produced proportions that differed significantly from one another at α=0.001 (see Table 2). The only methods that produced statistically indistinguishable proportions in the nationally representative sample were BMI<18.0 and Fogarty (1975); BMI<18.0 and Kemsley (Reference Kemsley1951/2); Kemsley (Reference Kemsley1951/2) and Fogarty (1975); Kemsley (Reference Kemsley1951/2) and Metropolitan Life Insurance (1959); and Fogarty (1975) and Metropolitan Life Insurance (1959) (all p's>0.001).
Table 2. Nine methods used in the recent literature for calculating the AN weight cut-off and the percentage (±standard error) of a population-based and treatment-seeking sample meeting the AN weight criterion under each method
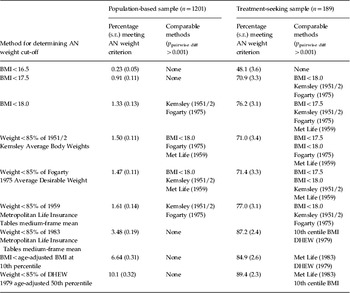
AN, Anorexia nervosa; BMI, body mass index; DHEW, Department of Health, Education, and Welfare; Met Life, Metropolitan Life Insurance Company.
Within each row, ‘comparable methods’ represent methods that did not exhibit significant differences in proportions based on pairwise McNemar tests with α set to 0.001 to control for family-wise error.
Proportion of the treatment-seeking sample meeting the weight criterion for AN
Table 2 also displays the percentage of individuals in the treatment-seeking sample who met the weight criterion for AN under each method. Forty-eight per cent met the weight criterion using the lowest cut-off (BMI<16.5), whereas nearly twice as many (89.4%) met the criterion using the highest cut-off (DHEW, 1979). Pairwise McNemar tests demonstrated that BMI<16.5 classified a significantly lower proportion of treatment seekers as underweight than all other methods (all p's<0.001). The proportion meeting BMI<17.5 was similar to BMI<18.0, Kemsley (Reference Kemsley1951/2) and Fogarty (1975) (all p's>0.001) but significantly lower than all other methods (all p's<0.001), with the exception of BMI<16.5. The proportion with BMI<18.0 did not differ from Fogarty (1975), Kemsley (Reference Kemsley1951/2) and the 1959 Metropolitan Life Insurance Tables but was significantly higher than BMI<16.5 and BMI<17.5 (all p's<0.001). The 1983 Metropolitan Life Insurance Tables, age-adjusted BMI at the 10th percentile, and DHEW (1979) produced higher proportions than the other six methods (all p's<0.001) but did not differ significantly from one another (all p's>0.001).
Discussion
There is considerable variation across studies in the determination of the weight cut-off for AN diagnosis. Most of the 99 articles focusing specifically on distinctions between eating disorder diagnostic categories and AN treatment efficacy did not report their methods for assessing degree of underweight. Of the 23 studies that did describe calculation methods, coders identified 10 distinct methods of establishing the weight criterion. Applying nine of these methods to nationally representative and treatment-seeking samples produced large and statistically reliable differences in the proportion of individuals who were classified as underweight. Our disparate prevalences highlight substantial discrepancies in the pool of individuals who would be eligible for the AN diagnosis if other diagnostic criteria were met.
The finding that investigators use different weight criteria for AN has important implications for eating disorder diagnosis, treatment, research and insurance reimbursement. Our results raise the possibility that a patient of a particular height, weight and symptom profile could receive a diagnosis of AN at one treatment center and a diagnosis of BN or EDNOS at another, and be eligible for one investigator's AN treatment outcome study but not another. On average, discrepancies are possible within a 15-lb weight range for females and a 25-lb weight range for males, and could occur even if the assessing clinicians at each treatment center referred to the same DSM-IV criteria to assign diagnoses. If each clinician then attempted to recommend an evidence-based treatment, the patient diagnosed by the stricter weight cut-off and therefore classified as BN or EDNOS might receive out-patient therapy whereas the patient diagnosed by the more lenient weight cut-off and therefore classified as AN might receive a more intensive intervention (e.g. in-patient care) because of the perception that he or she is more underweight.
Discrepancies in the application of the weight criterion may stem in part from a well-intentioned clinical desire to account for the unique presentation of each individual case. Indeed, DSM-IV encourages clinicians to account for patient variables such as height and age in the calculation of EBW. However, our data suggest that, at present, the application of the weight cut-off for AN varies at the level of the individual study rather than the level of the individual patient. The inconsistent application of myriad weight thresholds ultimately undermines rather than enhances the ideal of idiographic assessment. Each of the nine methods explored in the present study differs in the extent to which it accounts for patient variables (i.e. gender and age), and future research is needed to elucidate which variables may be most important to consider. For example, normative weight tables present different weight ranges for each sex whereas BMI calculation remains constant across sex.
Similarly, DHEW (1979), Hebebrand et al. (Reference Hebebrand, Himmelmann, Heseker, Schafer and Remschmidt1996) and Kemsley (Reference Kemsley1951/2) yield higher weight recommendations for older adults whereas the other six methods do not. Because weight gain is desirable from infancy to adolescence, age-specific guidelines are important for ascertaining degree of underweight in children. However, children grow at different rates, and it is unclear whether underweight should be defined nomathetically, as <85% of the age-adjusted 50th percentile BMI or<the age-adjusted 5th percentile BMI, or idiographically, by comparing children to their own projected growth trajectories. Furthermore, children reach developmental milestones (e.g. puberty, growth spurts) at different velocities, creating phase differences that may temporarily make late bloomers appear underweight. Moreover, many different versions of childhood growth charts are widely used. Future work should catalogue methods for ascertaining childhood underweight, evaluate whether proposed trajectories converge, and determine which are most appropriate for juvenile AN diagnosis. Although children who fail to make anticipated weight gains are classified as underweight in DSM-IV, the desirability of weight gain throughout the adult lifespan is less clear. Because adults typically continue to gain weight after achieving full stature, at least two normative weight tables (Kemsley, Reference Kemsley1951/2; DHEW, 1979) provide higher expected weights for successively older adult age groups. However, available data suggest that even relatively modest weight gains (i.e. 11–22 lb) after age 18 are associated with increased risk for heart disease and hypertension (Willet et al. Reference Willett, Dietz and Colditz1999). Thus, weight tables that provide normative adult weights graduated by age ranges may overdiagnose underweight among older adults. In sum, we recommend that the optimal weight cut-off for AN should increase with age until early adulthood but remain constant throughout the remainder of the lifespan.
The adoption of a mutually agreed upon weight cut-off for DSM-V would enhance the diagnostic reliability of AN. If a universal criterion were adopted, several considerations should factor into its selection, including ease of calculation, applicability to individuals of wide-ranging heights, and empirical relationship to morbidity and mortality. Normative weight tables exhibit many disadvantages from the standpoint of these criteria. First, some tables are difficult to interpret because they provide weight ranges rather than point estimates, and tables that provide clothed weights are not directly comparable to those that provide unclothed weights. Furthermore, Keys (Reference Keys and Bray1977) and others have criticized the Metropolitan Life Insurance Tables because their creators did not measure frame size, which directly informs weight recommendations, in the reference population. A second disadvantage of normative weight tables is that they do not provide weight recommendations for individuals of all possible heights, and therefore fail to classify very tall and very short individuals. In the current study, the DHEW and 1983 Metropolitan Life Insurance Tables methods could not classify 6.9% and 1.3% of NHANES participants respectively.
A final consideration when using normative weight tables is that recommended weights have increased over time; our results indicate that the 1983 Metropolitan Life Insurance Tables and the 1979 DHEW guidelines produce higher weight cut-offs than the 1959 Metropolitan Life Insurance Tables or Kemsley's 1951/2 Average Body Weights. This upward trend reflects the continued increase in obesity at the population level (Hedley et al. Reference Hedley, Ogden, Johnson, Carroll, Curtin and Flegal2004). If ‘expected’ body weight continues to be equated with ‘average’ body weight in DSM-V, then the weight criterion for AN may continue to rise. Mean weights skewed to reflect normative overweight may lead clinicians and researchers to speciously pathologize individuals whose weights fall below a new, higher average, but who do not in fact experience increased morbidity and mortality. Taking a constant percentage of increasingly heavier average body weights could create a longitudinal drift in the AN phenotype that would greatly reduce the generalizability of extant knowledge to future research and clinical practice.
BMI cut-offs circumvent many of the limitations presented by normative weight tables. Specifically, BMI can be applied to persons of any height, it can be calculated unambiguously with a single formula, and the designation of a universal BMI cut-off would be invulnerable to upward pressures emanating from increasing population body weights. Indeed, the ICD-10 (WHO, 1992–1994) sets a BMI of⩽17.5 as the weight criterion for AN. Unfortunately, available data do not provide definitive evidence for one BMI cut-off (i.e. 16.5, 17.5 or 18.0) over another. Low weight may be confounded with smoking status or chronic disease in large population-based studies, thus artificially elevating associated mortality rates (Willett et al. Reference Willett, Dietz and Colditz1999). Therefore, there is considerably less empirical support for defining 19.0 as the lower bound of the normative BMI range than for defining 25.0 as the upper bound (Willett et al. Reference Willett, Dietz and Colditz1999). Multiple classes of studies are needed to determine which BMI cut-off would be most informative for the AN diagnosis. First, cross-sectional studies could use non-linear methods to identify whether a specific BMI is associated with discontinuities in eating pathology severity, functional impairment or physical complications among individuals with heterogeneous eating disorder presentations. Second, eating disorder treatment studies could stratify groups by proposed BMI cut-offs to conduct moderator analyses identifying the BMI at which treatment becomes least effective. Third, prospective studies could determine which of the proposed BMI cut-offs best differentiates between individuals with favorable versus unfavorable long-term outcomes.
The present study should be interpreted in light of the following limitations. First, three of the four diagnostic criteria for AN (amenorrhea, fat phobia and body image disturbance) were not assessed in either the nationally representative or treatment-seeking samples. Furthermore, the weight criterion for AN requires that individuals deliberately refuse to maintain a minimally normal weight for height. Because AN represents only one of many reasons for underweight in the general population, including chronic disease and genetic factors, it is likely that the influence of weight cut-off calculation method would be diminished if all other diagnostic criteria were applied. A second limitation is that not all prospective patients in our treatment-seeking sample ultimately enrolled in clinical trials. Thus, the accuracy of their self-reported weights could not be assessed. A third limitation is that, because many of the articles in our study set did not describe their EBW calculation methods, it is possible that they used methods other than the 10 that we identified. Indeed, we are aware of adolescent-focused studies that have used still other calculation methods (e.g. 85% of the 50th BMI percentile for sex and age, cf. Peebles et al. Reference Peebles, Wilson and Lock2006) that did not appear in the study population. It is also possible that authors who referenced the same normative tables arrived at different EBWs. For example, the Metropolitan Life Insurance Tables provide weight ranges rather than point estimates, and it would be defensible to define the lower weight limit, mean weight, or some other in-range weight as the ‘expected’ number. However, this possibility provides further support for our observation of the lack of consensus in the field.
In conclusion, our data indicate that investigators interpret the AN weight criterion in myriad ways, and their differential interpretations lead to significant discrepancies in the pool of individuals who are eligible for AN diagnosis. Unresolved discrepancies in the interpretation of the weight criterion could exert even greater influence on eating disorder diagnosis in the future if recommendations to omit the amenorrhea criterion (Mitchell et al. Reference Mitchell, Cook-Myers and Wonderlich2005) come to fruition in DSM-V. Such discrepancies also render recommendations to relax the AN weight criterion (Andersen et al. Reference Andersen, Bowers and Watson2001; McIntosh et al. Reference McIntosh, Jordan, Carter, McKenzie, Luty, Bulik and Joyce2004) difficult to evaluate empirically. Altering the numerator of the EBW equation will have indeterminate impact if the denominator fluctuates across studies. Therefore, efforts to adopt a mutually acceptable weight cut-off for AN diagnosis would not only enhance short-term diagnostic reliability and treatment disposition but also inform long-term improvements to our nosological system.
Note
Supplementary material accompanies this paper on the Journal's website (http://journals.cambridge.org).
Acknowledgments
This project was sponsored by National Institute of Mental Health grant 1F31 MH078394 to J. J. T.
Declaration of Interest
None.


