Introduction
Legalized gambling is increasing world-wide, including electronic gambling machines (e.g. slots) in local venues, large destination casino resorts and, most recently, online gambling sites. When gambling opportunities are made available to the public in a given jurisdiction, some individuals participate occasionally and others more frequently. Among frequent gamblers, some individuals develop problematic involvement and some do not. The current study addresses the association among demographic and social risk factors, frequency of gambling, and gambling disorder. Gambling disorder is the term proposed to replace pathological gambling in the DSM-5 (Petry, Reference Petry2010). In this study, gambling disorder includes pathological gambling and also the alternative, often slightly broader, category of problem gambling often used in the literature (Hodgins et al. Reference Hodgins, Stea and Grant2011).
Several studies provide evidence that increased gambling availability increases overall participation, which, in turn, increases the prevalence of gambling disorders. For example, research has documented increased participation and problem prevalence following the introduction of new forms of gambling within a geographic location (Room et al. Reference Room, Turner and Ialomiteanu1999; Abbott & Volberg, Reference Abbott and Volberg2000; Grun & McKeigue, Reference Grun and McKeigue2000; Ladouceur et al. Reference Ladouceur, Jacques, Sevigny and Cantinotti2005). A relationship between geographic proximity of gambling venues and participation and problem prevalence has also been identified (Gerstein et al. Reference Gerstein, Murphy, Toce, Hoffman, Palmer, Johnson, Larison, Chuchro, Buie, Engelman, Hill, Volberg, Harwood, Tucker, Christiansen, Cummings and Sinclair1999; Welte et al. Reference Welte, Barnes, Wieczorek, Tidwell and Parker2001; Sevigny et al. Reference Sevigny, Ladouceur, Jacques and Cantinotti2008). For example, Welte et al. (Reference Welte, Barnes, Wieczorek, Tidwell and Parker2001), using data from a US national sample, showed greater prevalence of problems among individuals living within 10 miles of a casino. This relationship between availability and prevalence of disorders is complex. There is evidence, for example, that social adaptation takes place over time that limits problem incidence within a region so that further gambling expansion does not increase prevalence (Abbott et al. Reference Abbott, Williams and Volberg1999; Abbott, Reference Abbott, Smith, Hodgins and Williams2007; Shaffer & Martin, Reference Shaffer and Martin2011); that is, the population seems to adapt to ready access to gambling opportunities.
Additional factors clearly moderate and mediate the relationship between gambling availability, involvement and problems, including individual, social, economic and other contextual characteristics. Understanding the factors that influence the development of gambling-related problems has large implications for prevention and treatment. One line of inquiry has been to examine correlates or risk factors for problem development (Toneatto & Nguyen, Reference Toneatto, Nguyen, Smith, Hodgins and Williams2007). Numerous studies have reported associations between individual characteristics and problem gambling, typically through cross-sectional comparisons of social gamblers or non-gamblers with problem gamblers. Johansson et al. (Reference Johansson, Grant, Kim, Odlaug and Gotestam2008) have provided a comprehensive review in this area with the aim of identifying ‘well-established’ and ‘probable’ risk factors in different domains, based on the strength of the findings in peer-reviewed research. In the domain of demographic characteristics, they found that younger age and male gender are well-established demographic correlates and unemployment, lower socio-economic status, living in a large urban centre and lower academic achievement are probable demographic risk factors. Cultural group was also important; three studies conducted in the USA found higher problem rates for some non-Caucasian and immigrant groups compared with Caucasians. Mental health co-morbidity was another domain with several well-established and probable risk factors (Johansson et al. Reference Johansson, Grant, Kim, Odlaug and Gotestam2008). Alcohol and other drug problems and obsessive–compulsive disorder were considered well established, and depression, anxiety and personality disorders were considered probable risk factors. The existence of cognitive distortions concerning gambling probabilities was found to be well established and, in the domain of personality, delinquency and illegal acts involvement was found to be well established, with impulsivity, poor coping styles and sensation seeking as probable risk factors.
The results of the Johansson et al. (Reference Johansson, Grant, Kim, Odlaug and Gotestam2008) review of the peer-reviewed literature are generally consistent with earlier reviews by Raylu & Oei (Reference Raylu and Oei2002) and Tonetto & Nguyen (Reference Toneatto, Nguyen, Smith, Hodgins and Williams2007), which also included non-peer-reviewed literature. These latter reviews concluded that personality, cognitions, psychological states and biological factors interact in determining gambling involvement and gambling problems. However, Raylu & Oei (Reference Raylu and Oei2002) called for research specifically focused on distinguishing social gamblers (i.e. those who can stop gambling at will) from gamblers who continue to gamble despite losses. Much of the existing research, including these review papers, fails to differentiate risk factors predicting heavy gambling involvement from those that predict gambling disorder. A different set of risk factors may predict disordered gambling among individuals who already gamble heavily. Raylu & Oei (Reference Raylu and Oei2002) also recommended the development of multidimensional models integrating the various factors.
Gambling disorders have been conceptualized from a variety of aetiological frameworks including impulse control and obsessive–compulsive spectrum disorders and, most commonly, addictive behaviours (Mudry et al. Reference Mudry, Hodgins, el-Guebaly, Wild, Colman, Patten and Schopflocher2011). Integrative models have been proposed focusing on shared vulnerability factors for substance use, gambling and other addictive disorders such as eating disorders (Orford, Reference Orford2001; West, Reference West2001). Shaffer and co-workers proposed a syndromal model in which specific additive disorders associated with different ‘objects of addiction’ are outward expressions of the same underlying process related to psychological, neurobiological and social factors (Shaffer et al. Reference Shaffer, LaPlante, LaBrie, Kidman, Donato and Stanton2004; Shaffer & Martin, Reference Shaffer and Martin2011). Others theorists have specified this underlying process in terms of neurobiological (Goodman, Reference Goodman2008; Iacono et al. Reference Iacono, Malone and McGue2008; Koob & Le Moal, Reference Koob and Le Moal2008) or decision-making systems (Redish et al. Reference Redish, Jensen and Johnson2008). The high rates of co-morbidity between gambling and substance use disorders (Lorains et al. Reference Lorains, Cowlishaw and Thomas2011) are consistent with these models.
A popular multidimensional model of the aetiology of gambling problems is the pathways model (Blaszczynski & Nower, Reference Blaszczynski and Nower2002). This model posits three types of gambling problems: a relatively less severe type, a type associated with mood dysregulation, and an antisocial, impulsivist type. All three of these problem types are initiated by behavioural conditioning: the variable reinforcement schedule inherent in gambling activities promotes both habitual gambling and cognitive distortions about personal skill and the probability of winning. According to this model, frequent gamblers will at least intermittently meet diagnostic criteria for pathological gambling, although impairment of control will be minimal if there are no pre-existing vulnerabilities. The latter two more severe types of gambling problems evolve when there are pre-existing vulnerabilities such as mood disorders, substance abuse and impulsive personality styles in addition to the behavioural conditioning (Blaszczynski & Nower, Reference Blaszczynski and Nower2002).
Implicit in the pathways model is the assumption that everyone who has frequent exposure to gambling will inevitably develop at least the less severe type of disordered gambling because of conditioning processes. We posit that this might not necessarily be the case and therefore a primary purpose of this investigation is to determine what might distinguish individuals who are social gamblers from those who are disordered gamblers, with special attention to high-frequency gamblers. A second aim is to distinguish both these groups (i.e. social and disordered gamblers) of individuals from that much larger group who are not high-frequency gamblers. The baseline assessment wave from an ongoing longitudinal panel study of gambling (Leisure, Lifestyle and Lifecycle Project, LLLP) provides data that can be used to examine this issue in a cross-sectional design (el-Guebaly et al. Reference el-Guebaly, Casey, Hodgins, Smith, Williams, Schopflocher and Wood2008). The sample is sufficiently large and variable to allow for comparison among individuals of varying degrees of involvement in gambling who do and do not report gambling disorders. Moreover, most of the risk factors identified in previous research, contrasting non-gamblers and social gamblers with disordered gamblers, are assessed in this cohort.
Method
Participants
Random digit dialling was used to recruit five volunteer age cohorts for a 5-year longitudinal study of gambling involvement in the province of Alberta, Canada. Details of the LLLP design and recruitment are provided in el-Guebaly et al. (Reference el-Guebaly, Casey, Hodgins, Smith, Williams, Schopflocher and Wood2008) . Relatively high-frequency gamblers (above the 70th percentile for their age cohort) were oversampled. To account for this complex sampling and because the recruitment rate was low (5–10% depending on definitions), the sample was weighted by age, sex and geographic region using administrative data from the Alberta Ministry of Health and Wellness to be broadly representative of the provincial population in terms of these dimensions (el-Guebaly et al. Reference el-Guebaly, Casey, Hodgins, Smith, Williams, Schopflocher and Wood2008). For each participant, interviews were conducted in part by telephone, face-to-face and computer administration to provide a comprehensive psychosocial profile. In this report, four adult age cohorts are included (n=1372). The sample was 56% female, 89% Caucasian and 88% urban dwelling.
For the variable age of first gambling, participants' current age was used for individuals who indicated that they had never gambled (n=119). One participant had a visual disability and therefore did not complete the matrix subtest of the Wechsler Abbreviated Scale of Intelligence (WASI; PsychCorp, 1999) so her intelligence score was estimated from the vocabulary subtest. Mean substitution was used with missing values for three variables: percentage of close friends who gamble (44 missing), sibling gambling (14 missing) and parents gambling with you (three missing). We repeated the analysis excluding participants with missing values and examination showed that there was no substantive difference in the results.
Measures
Demographic characteristics
Participants were asked their gender, age, family income and marital status (married, common-law, living as married, widowed, divorced, separated, and never married). We categorized marital status into ‘single, never married’ versus other groups. Participants were also asked about their current employment (full-time, part-time or not employed at this time) and current education (full-time, part-time or not attending school, college or university). Individuals were also asked to describe their racial/ethnic group. Because of the large proportion of our sample who identified as Caucasian, we categorized participants into ‘Caucasian’ or ‘non-Caucasian’ groups. Participants' location of residence was categorized into rural or urban.
Mental health co-morbidity
Current tobacco use (categorized into ‘smoker’ or ‘occasional smoker’ and ‘non-smoker’) and lifetime alcohol and other drug dependence (dichotomous) were assessed with questions from the Canadian Community Health Survey (Statistics Canada, 2002). Lifetime obsessive–compulsive disorder was also assessed dichotomously using the CIDI (WHO, 1997). The Personality Assessment Inventory (PAI; Morey, Reference Morey1991) was used to assess current depression, anxiety and antisocial features. Each of these continuous scales shows good internal test–retest reliability and validity in clinical samples (Morey & Hopwood, Reference Morey, Hopwood and Strack2006). The Revised Neuroticism–Extroversion–Openness Personality Inventory (NEO-PI-R; Costa & McCrae, Reference Costa and McCrae1992) provided continuous measures of impulsivity and excitement-seeking traits. These scales showed good internal and test–retest reliability and good convergent validity with similar measures in a community sample.
Cognitive
Gambling-related cognitive distortions were measured using the 10-item Gambling Fallacies Scale (Williams, Reference Williams2003) developed for use in community surveys. Higher scores indicate less use of gambling fallacies. Intelligence was estimated using the two subtest versions (vocabulary and matrix reasoning) of the WASI (PsychCorp, 1999) administered by trained research assistants. The WASI IQ estimate shows good correlation (r=0.87) with the Wechsler Adult Intelligence Scale (WAIS)-III full-scale IQ (Wechsler, Reference Wechsler1997).
Gambling history and disorders
Using questions from the Canadian Problem Gambling Index (Ferris & Wynne, Reference Ferris and Wynne2001), participants estimated the age they first gambled for money and also indicated the frequency that their parents gambled with them growing up (never, occasionally, sometimes, often). They also reported whether their parents and siblings ever gambled regularly and estimated the percentage of their friends who gamble. Participants also estimated the number of times they had participated in different types of gambling over their lifetime (never, 1–10 times, >10 times). In terms of gambling disorders, the nine-item Problem Gambling Severity Index (PGSI; Ferris & Wynne, Reference Ferris and Wynne2001) and the 12-item CIDI (Kessler et al. Reference Kessler, Hwang, LaBrie, Petukhova, Sampson, Winters and Shaffer2008) provide continuous measures of severity of problem and also categorical indicators of disorder. Both have been validated for use in community surveys. The PGSI assesses gambling in the past 12 months and the CIDI has a lifetime time-frame.
Other
Religiosity was measured using the Rohrbaugh Jessor Religiosity Scale (Rohrbaugh & Jessor, Reference Rohrbaugh and Jessor1975), an eight-item scale that provides an internally reliable measure of religious participation and orientation. Finally, childhood and adolescence physical and sexual abuse and neglect were assessed with the continuous total score of the Childhood Trauma Questionnaire (Bernstein et al. Reference Bernstein, Ahluvalia, Pogge and Handelsman1997; Bernstein & Fink, Reference Bernstein and Fink1998). The validity of this 28-item self-completion scale has been established in many community and clinical samples (Bernstein et al. Reference Bernstein, Ahluvalia, Pogge and Handelsman1997; Scher et al. Reference Scher, Stein, Asmundson, McCrearly and Forde2001).
Analysis
The analysis consisted of three stages. The first phase used canonical correlational analysis to investigate the relationship between a set of hypothesized risk variables and indicators of gambling involvement and gambling disorder. Canonical analysis calculates canonical variates, linear combinations of variables within each set that maximize the relationships between the sets. The results provide a correlation between the canonical variates from each set and the correlations of the variables within each set with the canonical variate. This provides an indication of which variables contribute most highly to each canonical variateFootnote 1 Footnote †. To aid in the interpretation of the canonical analysis, a graphical biplotFootnote 2 (ter Braak, Reference ter Braak1990) was constructed. In the second phase, variables representing categorical groups of relatively higher-frequency gamblers who did and did not report gambling disorders and a variable representing a group of lower-frequency gamblers were correlated with the canonical variates and located on the biplot as axes representing these correlations. This biplot reveals which variables are associated with differences among the three groups of interest. In the third stage, follow-up univariate analyses were conducted on variables identified by the canonical analysis as potentially separating the two higher-frequency gambler groups as well as lifetime involvement in various types of gambling activities. These analyses were performed using bootstrap-estimated standard errors as described previously (el-Guebaly et al. Reference el-Guebaly, Casey, Hodgins, Smith, Williams, Schopflocher and Wood2008).
Included in the canonical correlation analysis conducted for the first stage were a set of risk factors (gender, age, marital status, ethnicity, geographic location, employment status, religiosity, intelligence, childhood trauma, smoking, alcohol and other drug problems, depression, anxiety, impulsivity, excitement seeking, antisocial personality, obsessive–compulsive personality, age of gambling onset, family and friend gambling involvement, and gambling fallacies) and a set of gambling variables including gambling frequency and problem gambling severity, both measured as continuous variables.
For the second stage of analysis, discrete categorical groups were formed based on gambling frequency and gambling problem severity. Relatively higher-frequency gambling was defined as gambling once a week or more in a typical month on any of a range of gambling activities (casino games, bingo, instant win tickets, electronic gaming machines, horse races, raffle tickets, high-risk stocks, sports betting, but excluding lottery tickets). This definition of frequent gambling is widely used (e.g. Corless & Dickerson, Reference Corless and Dickerson1989; Abbott & Volberg, Reference Abbott and Volberg1999; Productivity Commission, 1999; Lynch et al. Reference Lynch, Maciejewski and Potenza2004) and has been identified as an indicator of higher-risk gambling in community samples in Canada (Currie et al. Reference Currie, Hodgins, Wang, el-Guebaly, Wynne and Chen2006, Reference Currie, Hodgins, Wang, el-Guebaly, Wynne and Miller2008). In our sample 199 participants fell into this group and they represented individuals above the 86th percentile of the sample. Disordered gambling was defined as meeting five or more DSM criteria for pathological gambling on the lifetime version of the CIDI (Kessler et al. Reference Kessler, Andrews, Mroczek, Ustun and Wittchem1998) or scoring in the problem gambling range for the past 12 months on the PGSI (i.e. ⩾8). Sixty of the higher-frequency gamblers were categorized as problem gamblers. Seventy-six of the higher-frequency gamblers fell into the non-problem gambling group, which was defined as meeting none of the DSM criteria and scoring zero on the PGSIFootnote 3 .
Results
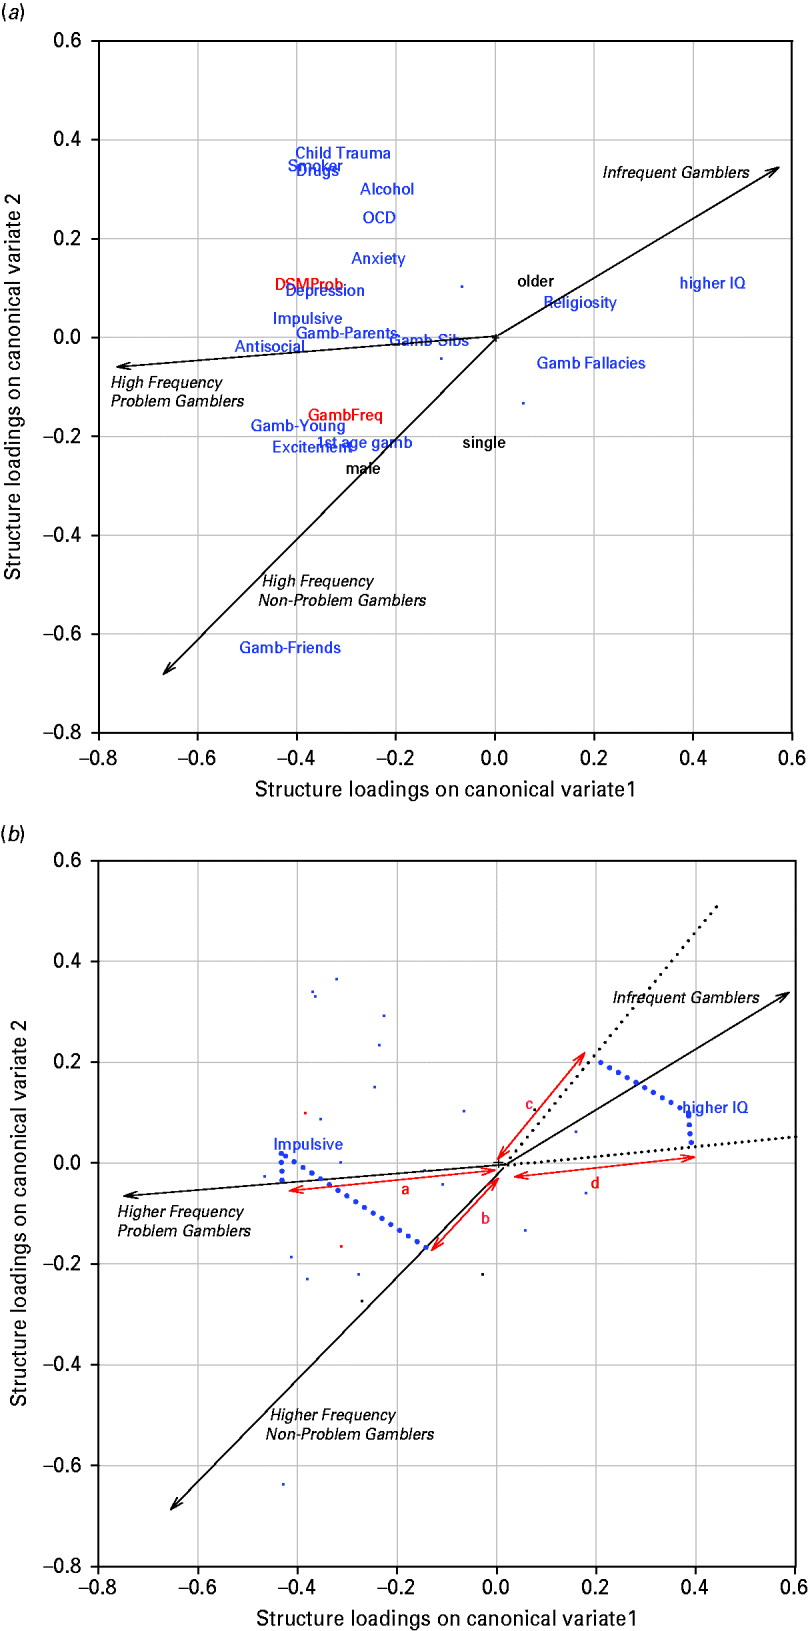
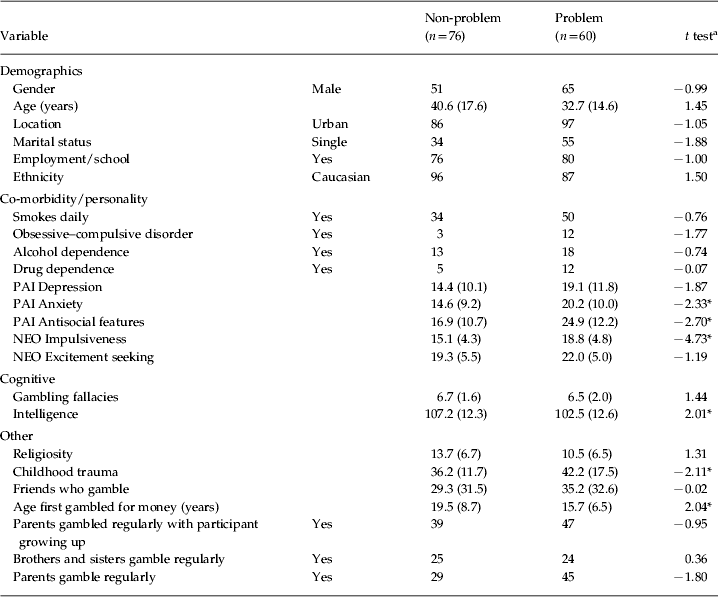
The canonical analysis revealed that the first canonical correlation was 0.44 and the second was 0.23. The model was significant with both canonical correlations included [χ2(48)=365.5, p<0.0001] and with the first canonical correlation removed [χ2(23)=73.2, p<0.0001]. Table 1 presents the correlations (loadings) between the canonical variates and the individual variables included in the analysis along with the correlations for variables representing relatively high-frequency disordered gamblers, high-frequency non-disordered gamblers and the remaining relatively infrequent gamblers with the canonical variates.
Table 1. Correlations of variables with canonical variates for an adult community sample (n=1372)
PAI, Personality Assessment Inventory; NEO, Neuroticism–Extroversion–Openness Inventory.
a Canonical variates calculated from risk factor variables. Correlations with absolute values >0.07 are statistically significant at p<0.01.
b Higher score indicates fewer fallacies.
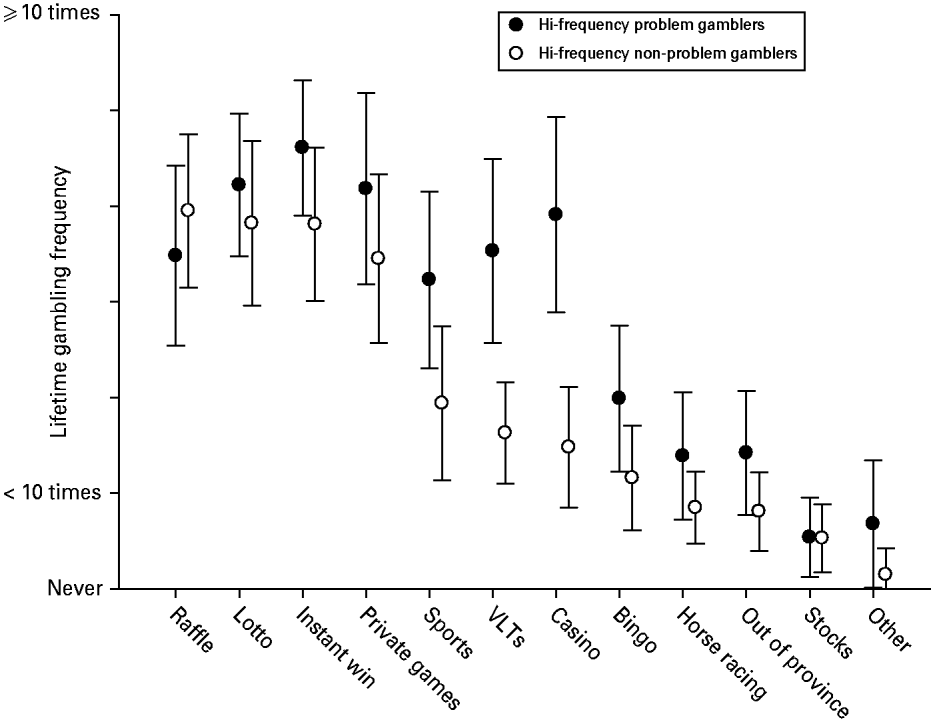
Figure 1 a presents the relationships between the variables and the canonical variates as a biplot and includes axes for the three groups distinguished by gambling. The three axes show the direction along which individuals are increasingly more likely to belong to the group by which the axis is labelled (infrequent gamblers, higher-frequency non-problem gamblers and higher-frequency disordered gamblers). The orthogonal (90°) projections from the points representing the risk variables to these axes indicate variables for which high scores characterize the different groups. The further from the origin in the direction of the arrow this projection falls, the more characteristic of this group would be high scores on the variables, whereas the further away from the origin in the opposite direction, the less characteristic of this group would be scores on the variables. For example, in Fig. 1 b, both higher-frequency gambling groups are characterized by lower scores on IQ (distances c and d). Both higher-frequency gambling groups are also characterized by higher scores on impulsivity (distances a and b) although the disordered gamblers have higher scores than the non-problem gamblers (distance a >distance b).

Fig. 1. (a) Variables projected onto canonical variates. To maximize clarity, three variables with low loadings on both canonical variates were not plotted (see Table 2). These variables were location, employment and ethnicity. (b) Interpreting the biplot. Gamb=Gambling.
Overall, it is only age, IQ, lack of gambling fallacies and religiosity on which infrequent gamblers have higher scores than the frequent gamblers (Fig. 1 a). All other variables have relatively lower scores in the infrequent gambler group and higher scores in the frequent gambler groups. The major differences between the two higher-frequency gambling groups are seen with the variables in the upper left quadrant, which have relatively higher scores for the disordered gambling group than for the non-problem group. This group of variables includes all the mental health indicators in addition to childhood trauma and parental gambling.
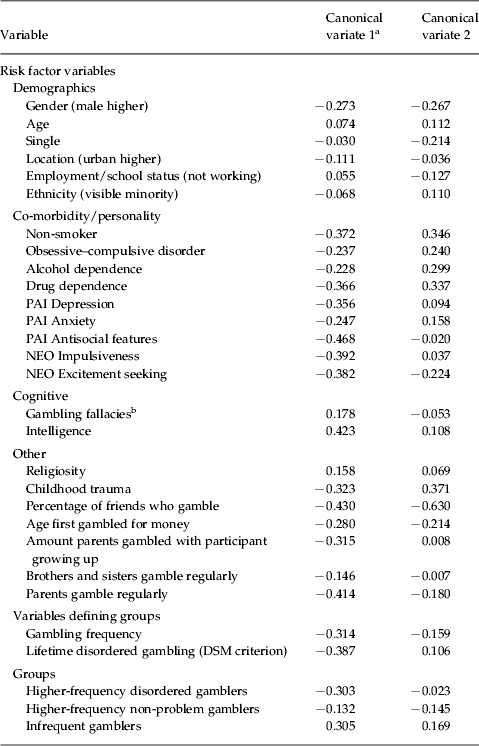
In Table 2, follow-up descriptive analyses were conducted to compare higher-frequency non-problem gamblers (n=76) with higher-frequency disordered gamblers (n=60). Except for the involvement of siblings in gambling, all risk factors were more likely or were stronger in the disordered gambler group, although not necessarily statistically significant because of the limited cell sizes. The results show that the mean scores on the NEO Impulsivity and Excitement-seeking scale and the PAI Depression, Anxiety and Antisocial Personality Features scales were high compared to the adult US normative group. For the non-problem group the impulsivity and excitement-seeking mean fell at the 74th and 87th percentile and for the problem group the means fell at the 88th and 96th percentiles respectively (Costa & McCrae, Reference Costa and McCrae1992). For the PAI scales, for the non-problem group, depression, anxiety and antisocial means fell at the 66th, 67th and 73rd percentiles and for the problem group the means fell at the 76th, 76th and 89th percentiles respectively (Morey, Reference Morey1991). In a further follow-up analysis shown in Fig. 2, the disordered gamblers showed significantly more involvement in certain forms of gambling (slots and video lottery terminals and casino table games) compared with the non-problem gamblers.

Fig. 2. Gambling frequencies by gambler type. Note bootstrap-estimated 95% confidence intervals.
Table 2. Potential risk factors among problem and non-problem higher-frequency gamblers
PAI, Personality Assessment Inventory; NEO, Neuroticism–Extroversion–Openness Inventory.
a Using bootstrap-estimated standard error of the difference (non-problem minus problem).
Values given as percentage or mean (standard deviation).
* p<0.05.
Discussion
These analyses revealed that different sets of risk factors are associated with relatively higher gambling involvement compared with gambling disorders in a community sample. Previous research has generally failed to differentiate predictors of heavy gambling involvement from predictors of disordered gambling. Figure 1 shows that many of the variables assumed to be associated with risk of gambling problems, based up previous research, did distinguish between higher- and lower-frequency gamblers independent of problem status. Individuals with higher intelligence, older individuals and more religious individuals were less frequent gamblers. Males, single individuals and those exposed to gambling environments (friends and family who gamble) and those who started to gamble at a younger age were more frequent gamblers. Excitement-seeking personality traits were also higher among more frequent gamblers.
Whereas these latter variables were associated with gambling frequency, another group of individual characteristics was correlated with gambling disorders among the high-frequency gamblers. These variables included all of the mental health indicators in addition to our index of childhood maltreatment and parental gambling involvement. Among higher-frequency gamblers, individuals who smoke cigarettes, those with a diagnosis of alcohol or drug dependence or obsessive–compulsive disorder, those with higher anxiety or depression, those with higher impulsivity and antisocial personality traits and those who experienced childhood trauma were more likely to report gambling-related problems. The fact that all of the mental health indicators included in the analysis were associated with gambling disorders among higher-frequency gamblers suggests that having any mental disorder may make an individual more vulnerable to a gambling disorder. As shown in Table 2, the base rate of the mental health disorders in the high-frequency gamblers group ranged from very low (e.g. drug dependence, obsessive–compulsive disorder) to moderately high (daily smoking). Despite this variability, however, they are all moderately intercorrelated and overall they indicate poorer functioning. It is possible that high-frequency gambling when combined with any type of emotional vulnerability will lead to gambling problems.
Recent attempts to model the associations among various co-morbid mental disorders have suggested a generality model in which individual disorders represent specific instances of a more general process (Iacono et al. Reference Iacono, Malone and McGue2008; Markon, Reference Markon2010; Kessler et al. Reference Kessler, Ormel, Petukhova, McLaughlin, Green, Russo, Stein, Zaslavsky, Aguilar-Gaxiola, Alonso, Andrade, Benjet, de Girolamo, de Graaf, Demyttenaere, Fayyad, Haro, Hu, Karam, Lee, Lepine, Matchsinger, Mihaescu-Pintia, Posada-Villa, Sagar and Ustun2011). Although these previous reports have not specifically considered disordered gambling, a general externalizing process including problems with disinhibition is linked to disorders such as substance abuse and dependence and antisocial personality disorder. Anxiety and depression are linked to a general internalizing process characterized by struggles with negative emotions (Kessler et al. Reference Kessler, Ormel, Petukhova, McLaughlin, Green, Russo, Stein, Zaslavsky, Aguilar-Gaxiola, Alonso, Andrade, Benjet, de Girolamo, de Graaf, Demyttenaere, Fayyad, Haro, Hu, Karam, Lee, Lepine, Matchsinger, Mihaescu-Pintia, Posada-Villa, Sagar and Ustun2011).
In the present analyses, variables representing both of these externalizing and internalizing processes were elevated in the disordered gambling group. These two processes resemble the hypothesized mood dysregulation (e.g. depression, anxiety) and antisocial, impulsivist pathways to gambling disorders (Blaszczynski & Nower, Reference Blaszczynski and Nower2002). Given that these variables were elevated in the disordered gamblers, it is possible that some individuals may have followed the depression–anxiety pathway and others the antisocial–impulsivist pathway. The longitudinal data collected in subsequent phases of this project will be helpful in further untangling these influences.
The impulsivity construct has garnered a great deal of attention recently among gambling researchers (Toneatto & Nguyen, Reference Toneatto, Nguyen, Smith, Hodgins and Williams2007; Rogers et al. Reference Rogers, Moeller, Swann and Clark2010). Whereas the research on most risk factors is limited to cross-sectional studies, at least two longitudinal studies have found a link between adolescent impulsivity scores and later gambling problems (Vitaro et al. Reference Vitaro, Arseneault and Tremblay1997; Slutske et al. Reference Slutske, Caspi, Moffitt and Poulton2005). However, impulsivity is a variably defined, multidimensional construct. In this study we used the NEO PI-R impulsivity scale, which measures urgency to act. Whiteside & Lynam (Reference Whiteside and Lynam2001) have argued that other NEO scales capture other independent aspects of impulsivity such as low premeditation, low perseverance and sensation seeking. Other researchers have distinguished between choice impulsivity and response or motor impulsivity, each of which is differentially associated with brain function (Potenza et al. Reference Potenza, Sofuoglu, Carroll and Rounsaville2011). Which specific facets of impulsivity drive what aspects of gambling and gambling impairment is not clear and requires further examination (Rogers et al. Reference Rogers, Moeller, Swann and Clark2010).
A history of childhood trauma was also associated with gambling problems among the high-frequency gamblers. An early theory of the aetiology of addictive behaviours, including gambling, proposed that childhood trauma, when it occurs in individuals who are characterlogically hyper- or hypo-aroused, sets a stage for strong needs to seek dissociative-type experiences such as gambling and substance use (Jacobs, Reference Jacobs1986). Petry & Steinberg (Reference Petry and Steinberg2005) showed that childhood trauma severity predicted earlier onset of gambling and greater severity of gambling problems among a treatment-seeking sample of pathological gamblers. Analysis of the present data set indicated that childhood trauma was independently associated with gambling problem severity when mental health factors were controlled (Hodgins et al. Reference Hodgins, Schopflocher, el-Guebaly, Casey, Smith, Williams and Wood2010). Research has started to look into biological-based effects of childhood abuse on a range of adult mental and physical health outcomes (Weiss & Wagner, Reference Weiss and Wagner1998; Andersen et al. Reference Andersen, Tomada, Vincow, Valente, Polcari and Teicher2008).
Many non-problem higher-frequency gamblers were found in this community sample, although our definition of higher frequency (gambling at least weekly on more than lottery tickets) was arguably liberal. This definition has often been used in previous research and has been shown to be a relatively sensitive and specific cut-point for low- versus high-risk gambling involvement (Currie et al. Reference Currie, Hodgins, Wang, el-Guebaly, Wynne and Chen2006). Our definition of ‘non-problem’ was conservative, with individuals required to report no indication of either current or past problems. The existence of a relatively large group of frequent gamblers who have never had problems seems inconsistent with one of the pathways model's assumptions: that frequent gambling will be associated with at least intermittent gambling-related problems (Blaszczynski & Nower, Reference Blaszczynski and Nower2002). However, further examination of the specific types of gambling involvement of these frequent gamblers showed that individuals with problems were more likely to play slots, video lottery terminals and casino table games. Slots and video lottery terminals, together referred to as electronic gaming machines (EGMs), have been identified as particularly likely to be associated with the development of gambling problems and treatment seekers typically cite EGMs as the major source of their struggles even though they gamble relatively frequently on all other types of gambling when compared with non-problem gamblers (e.g. Hodgins et al. Reference Hodgins, Currie, Currie and Fick2009). Welte et al. (Reference Welte, Barnes, Tidwell and Hoffman2008), in their US national community sample, found that casino gambling, lotteries and card games, in addition to EGMs, were most likely to be associated with gambling-related problems. It is assumed that forms of gambling providing rapid cycles of feedback and play are most problematic (Griffiths, Reference Griffiths1999; Welte et al. Reference Welte, Barnes, Tidwell and Hoffman2008) although definitive confirmation is lacking (Dowling et al. Reference Dowling, Smith and Thomas2005). In short, gambling is an umbrella term for a heterogeneous group of activities that need to be understood individually even though individuals tend to be involved in multiple types of gambling. Perhaps the behavioural conditioning pathway of Blaszczynski & Nower's (Reference Blaszczynski and Nower2002) model is limited to individuals who engage in specific types of gambling frequently versus any type of gambling.
A major limitation of the current data is that they are obtained from a volunteer sample, are cross-sectional and are a mixture of retrospective and current status measures. Moreover, all measures were self-reported, with the exception of IQ. Despite these limitations, these results help to formulate hypotheses that can be tested in longitudinal data sets. The participants in this study are being followed for at least a 5-year period and the accelerated longitudinal design means that we have individuals moving through the major developmental phases over the course of the study (el-Guebaly et al. Reference el-Guebaly, Casey, Hodgins, Smith, Williams, Schopflocher and Wood2008). It will be important to determine whether the high-frequency gambling individuals who are not yet experiencing gambling problems continue to function well over time.
In summary, analysis of this community sample across a wide range of potential risk factors resulted a model showing that some individual characteristics (e.g. gender, intelligence, gambling exposure, exciting-seeking personality) influence gambling involvement but not necessarily gambling problems. The model further predicts that, for frequent EGM and casino table game gamblers, the presence of mental health or personality vulnerabilities promotes gambling disorders. In the absence of these vulnerabilities, continued non-problematic gambling is possible. Although this model needs to be replicated in other samples, it is likely that efforts to provide prevention programming and policies that are focused on the more vulnerable groups of individuals will be more successful.
Acknowledgements
We thank A. McEwen, A. Filiack and A. Mossière for assistance with data collection. Funding for this study comes from the Alberta Gambling Research Institute (AGRI).
Declaration of Interest
None.