Whether human variations should be understood as differences of degree or of kind is a fundamental question in psychology and psychiatry. Advocates of the former view argue that differences between people are best seen as quantitative variations along a continuum. Advocates of the latter view propose that some differences between people are qualitative, discrete, or typological. This distinction between dimensional and categorical models of variation arises in many fields. Personality researchers debate the existence of personality types, mental health researchers dispute the merits of categorical v. dimensional diagnosis, and social theorists question whether categories involving sexuality, race, and gender are truly discrete.
The distinction between dimensional and categorical accounts of human diversity has substantial implications for research, theory, and practice. In the psychiatric domain, whether mental disorders are viewed as discrete categories or as arbitrarily defined regions on an underlying continuum has a bearing on classification (categorical v. dimensional taxonomy), assessment (dichotomous diagnosis v. quantitative measurement), research (statistical searches for latent classes v. factors), clinical prediction [differential validity of dichotomous v. continuous measures (Markon, Chmielewski, & Miller, Reference Markon, Chmielewski and Miller2011)], causal explanation (specific etiologies v. multifactorial causation), and public stigma (Schomerus, Matschinger, & Angermeyer, Reference Schomerus, Matschinger and Angermeyer2013). Challenges to categorical models have intensified in recent years with the incorporation of dimensional features in DSM-5 (APA, 2013; Helzer, Kraemer, & Krueger, Reference Helzer, Kraemer and Krueger2008) and the development of explicitly dimensional alternative frameworks such as RDoC (Insel et al., Reference Insel, Cuthbert, Garvey, Heinssen, Pine, Quinn and Wang2010) and HiTOP (Kotov et al., Reference Kotov, Krueger, Watson, Achenbach, Althoff, Bagby and Eaton2017).
Taxometric methods were developed as a means of adjudicating between categorical and dimensional models of latent variables by Meehl (Reference Meehl1995). Initially, they were used to test Meehl's conjecture that a discrete latent variable or ‘taxon’ (plural ‘taxa’) underlay vulnerability to schizophrenia (Golden & Meehl, Reference Golden and Meehl1979). A distinctive feature of taxometric methodology is the use of multiple mathematically independent procedures (e.g. MAMBAC, MAXCOV, MAXEIG, L-Mode), often examining patterns of covariation among indicators of a putative latent variable. Structural conclusions are based on convergence among procedures, usually judged by visual inspection of plots rather than statistical tests. Since the 1990s, taxometric studies have become increasingly popular and have explored a great diversity of psychological and other variables (Ruscio, Haslam, & Ruscio, Reference Ruscio, Haslam and Ruscio2006). They have often yielded taxonic findings for variables that had previously been assumed dimensional (e.g. Gangestad & Snyder, Reference Gangestad and Snyder1985).
A new, systematized approach to taxometric inference was introduced by Ruscio, Ruscio, and Meron (Reference Ruscio, Ruscio and Meron2007), who developed a procedure whereby taxometric plots based on observed data were compared to plots from parallel analyses of matched simulated comparison datasets generated from taxonic or dimensional latent structures. Their Comparison Curve Fit Index (CCFI) quantified the relative fit of the observed plot to plots based on the respective simulated data. A value of 0.5 indicated an equally good fit to the taxonic and dimensional simulations, a value >0.55 represented better fit to the taxonic simulations, and a value <0.45 represented a better fit to the dimensional simulations (values 0.45–0.55 are judged ambiguous). Extensive Monte Carlo research (Ruscio & Kaczetow, Reference Ruscio and Kaczetow2009; Ruscio, Walters, Marcus, & Kaczetow, Reference Ruscio, Walters, Marcus and Kaczetow2010; Ruscio et al., Reference Ruscio, Ruscio and Meron2007) establishes that the CCFI is very accurate in detecting taxonic and dimensional data under parameters prevailing in behavioral science, and that it has no significant bias in favor of taxonic or dimensional conclusions. For example, Ruscio et al. (Reference Ruscio, Walters, Marcus and Kaczetow2010) showed that when CCFI values generated by multiple taxometric procedures were averaged, their mean value correctly identified taxonic and dimensional data 99.4% of the time. Since then the simulated comparison data method has become almost universally adopted by taxometric researchers.
Taxometric research was last comprehensively examined by Haslam, Holland, and Kuppens (Reference Haslam, Holland and Kuppens2012), who reviewed 177 articles that used ⩾1 taxometric procedures to evaluate the latent structure of an observed, unmanipulated variable. They extracted 311 distinct findings, each representing a binary judgment about the latent structure of one variable in one sample. Articles and findings were coded on several methodological attributes and their variables were classified into 10 construct domains: seven related to psychopathology (mood disorders, anxiety disorders, eating disorders, substance use disorders, other externalizing disorders, schizotypy, and other personality disorders), two related to other individual differences (normal personality and ‘other’), and one miscellaneous domain included all variables that did not involve psychological or psychiatric variation. Multilevel logistic regression analyses identified several methodological choices – including low overall study quality – associated with a higher likelihood of taxonic findings. Taxonic findings were significantly less likely to be obtained in the domains of anxiety, eating, and personality disorders, and in normal personality. No domain of psychopathology was associated with a significantly heightened likelihood of taxonic findings relative to a ‘miscellaneous’ domain of non-psychological variables. Strikingly, studies employing the CCFI were much less likely to generate taxonic findings than those that did not. Although the authors of the original research had concluded that 38.9% of all findings were taxonic, Haslam et al.'s (Reference Haslam, Holland and Kuppens2012) analysis estimated that the true rate would be 14.0%.
The present review built on Haslam et al. (Reference Haslam, Holland and Kuppens2012) but represents an advance in three respects. First, the taxometric literature has grown substantially in the 8 years since the previous literature search. Second, the CCFI has become standard practice in taxometric research since the previous review and the number of findings employing it has steeply risen since. Third, the greater availability of CCFI-based findings allows meta-analytic procedures to be applied for the first time, affording a quantitative effect size metric rather than a crude binary taxonic/dimensional distinction. These procedures permit a more refined analysis of construct domain and methodological factors associated with taxonicity.
The current study applied multi-level meta-analytic procedures (findings nested within studies nested within articles) to determine the prevalence and distribution of taxa in the taxometric literature. The meta-analysis was restricted to studies providing CCFIs but a further analysis compared the findings of these studies with those that did not employ the CCFI. We predicted that evidence for taxa would be scarce, and that CCFI-based findings would be taxonic much less than others, thereby casting doubt on some taxonic findings in the pre-CCFI literature. We also examined whether 17 construct domains – 11 representing forms of psychopathology and five representing forms of normal psychological variation – were consistently taxonic or non-taxonic, and whether there were systematic differences in support for taxa across domains. For example, we compared the evidence for taxa between normal and psychopathological constructs and between subsets of psychopathological constructs. As a final, more fine-grained step in the analysis, we aimed to locate any constructs that might be taxonic on the strength of replicated taxometric findings.
Method
Literature search
An exhaustive literature search was conducted using the same parameters as Haslam et al. (Reference Haslam, Holland and Kuppens2012), who obtained 177 articles in a search concluded in April 2011. Using multiple publication databases (Google Scholar, PsycINFO, and Web of Science, as in the earlier review, and adding Scopus), the present search was conducted iteratively from 2014 until January 1 2020. Search terms were ‘taxometric*’, ‘taxon*’, ‘MAXCOV’, ‘MAMBAC’, ‘MAXEIG’, and ‘L-Mode’. All articles had to (1) be published or ‘in press’ in a peer-reviewed journal (for consistency with the earlier review and for quality control), (2) employ one or more established taxometric procedure (i.e. L-Mode, MAMBAC, MAXCOV, MAXEIG, MAXSLOPE), and (3) examine observed variables rather than simulated or experimentally manipulated data. By this means, 102 new taxometric articles were added to the previous 177, yielding a total of 279 (i.e. a 57.6% increase). As in Haslam et al. (Reference Haslam, Holland and Kuppens2012), findings from the articles were defined as conclusions drawn about the latent structure of a single construct based on ⩾1 taxometric procedures in one sample. An article could contain multiple findings if it investigated ⩾1 construct and/or examined ⩾1 sample (i.e. ‘study’). By this definition, the 279 articles reported 502 findings (mean = 1.80), a 61.4% increase over Haslam et al. (Reference Haslam, Holland and Kuppens2012). In the multi-level data analyses that follow, findings are treated as nested within studies, which are nested in articles.
Coding process
The 102 new articles were coded in an almost identical fashion to the 177 articles from Haslam et al. (Reference Haslam, Holland and Kuppens2012) and merged into a single dataset. The first author coded all articles. Codes recorded sample properties (N, and whether it was drawn from undergraduate, clinical/forensic, community, or child/adolescent populations); characteristics of the indicator variables (self-report, interviews, observer ratings, number of indicators employed in the analysis, use of single-item indicators, use of dichotomous indicators, presence or absence of reported evidence of indicator validity); and aspects of the data analysis (use/non-use of MAXCOV, MAMBAC, MAXEIG, MAXSLOPE, L-Mode, and other, and use/non-use of the CCFI-generating simulated comparison data method). For findings where no CCFIs were generated, each finding was recorded as taxonic or non-taxonic based on the authors' conclusion. For findings where CCFIs were generated, they were recorded for each taxometric procedure and an average CCFI was calculated.
One change to the previous coding protocol was the addition of two new codes intended to capture possible sources of invalid taxonic conclusions caused by the use of compound samples. By admixing two or more distinct subsamples, compound sampling may generate ‘institutional pseudotaxa’ (Cole, Reference Cole2004), in effect building categorical structure into the sample. The new codes distinguished additive and subtractive forms of compound sampling. In the former (type A), two distinct samples were admixed, whereas in the latter (type B), two subgroups were extracted from a single sample and combined, removing the remainder. These codes were applied to all 502 findings.
To evaluate coding reliability, 20 articles reporting 29 findings were blind coded by the second author on 26 features. Overall agreement between coders was 95.6%. The lowest agreement (82.1%) was found for average CCFI, which accumulates minor errors of recording and calculation across multiple CCFI values, and in no case changed the taxonic or non-taxonic conclusion (mean discrepancy = |0.036|). All disagreements were resolved by discussion. Table 1 presents a summary of coded properties of the 502 findings.
Table 1. Descriptive statistics on finding-level codes (N = 502)

Construct domain definition
The 502 findings were classified into 17 construct domains to enable systematic comparison. Eight of the 10 domains employed in Haslam et al. (Reference Haslam, Holland and Kuppens2012) were retained for the present analysis but two domains were subdivided to enable more differentiated explorations of psychopathological and normal variation, mindful of the growth of taxometric literature in particular domains. The previous broad ‘other individual differences’ domain was divided into separate domains of childhood disorders, psychotic disorders, somatoform disorders, other psychopathology, sexuality, response biases, and a narrower residual ‘other individual differences’ domain. The previous ‘normal personality’ domain was divided into normal personality and gender domains. The new set of 17 construct domains therefore included 11 domains of psychopathology, five domains of normal psychological variation, and one miscellaneous. The psychopathology domains, which included recognized mental disorders as well as subtypes, associated symptoms, and vulnerability factors, are detailed below. Domains 1–3 were conceptualized as internalizing disorders, domains 4–5 as externalizing disorders, and domains 6–7 as personality disorders.
(1) Mood disorders (e.g. depression, dysthymia, mania, depression subtypes, depression-proneness, prolonged grief)
(2) Anxiety disorders (e.g. GAD, PTSD, social anxiety disorder, worry, OCD subtypes, agoraphobia, anxiety sensitivity, fear of pain, hypochondriasis, health anxiety, distress intolerance)
(3) Eating disorders (e.g. anorexia nervosa, bulimia nervosa, binge eating disorder, body dissatisfaction, dietary restraint, subtypes of anorexia and bulimia nervosa)
(4) Substance use disorders (e.g. alcohol, nicotine, cannabis, and hallucinogen abuse or dependence)
(5) Other externalizing disorders (e.g. intermittent explosive disorder, oppositional defiant disorder, criminal lifestyle, bullying perpetration, problem gambling)
(6) Schizotypy (e.g. magical ideation, perceptual aberration, social anhedonia, schizotypal personality disorder). This domain was defined separately from other personality disorders because it has been the specific focus of a large taxometric literature.
(7) Other personality disorders (e.g. avoidant, borderline, dependent, antisocial, obsessive-compulsive, paranoid, schizoid and narcissistic PDs, psychopathy)
(8) Childhood disorders (e.g. ADHD and autism and their subtypes, childhood sleep problems, dyslexia subtypes, specific language impairment)
(9) Psychotic disorders (e.g. psychotic symptoms, paranoid delusions, negative schizophrenia)
(10) Somatoform disorders (e.g. somatic complaints, somatization)
(11) Other psychopathology (e.g. dissociation, suicide risk, self-injury, dementia)
The five ‘normal’ domains included psychological constructs not usually conceptualized as forms of psychopathology.
(12) Personality (e.g. traits and attachment styles)
(13) Sexuality-related constructs (e.g. hypersexuality, sexual orientations, sociosexuality, sexual attitudes, mate selectivity, sexual sadism, pedophilia)
(14) Gender-related constructs (e.g. femininity, sex-stereotyped activities)
(15) Response styles and biases (e.g. impression management, malingering, symptom over-reporting, health complaint exaggeration, feigned neurocognitive deficit)
(16) Other individual differences (e.g. religious fundamentalism, interest in science, racist attitudes, vocational calling)
A residual category included constructs that are not psychological variations between people.
(17) Miscellaneous (e.g. biological sex, handedness, prostate cancer risk, marital discord, flashbulb memories, metabolic syndrome, functional dyspepsia, relationship types and quality, envy and jealousy, diabetes, tardive dyskinesia)
Results
Descriptive findings
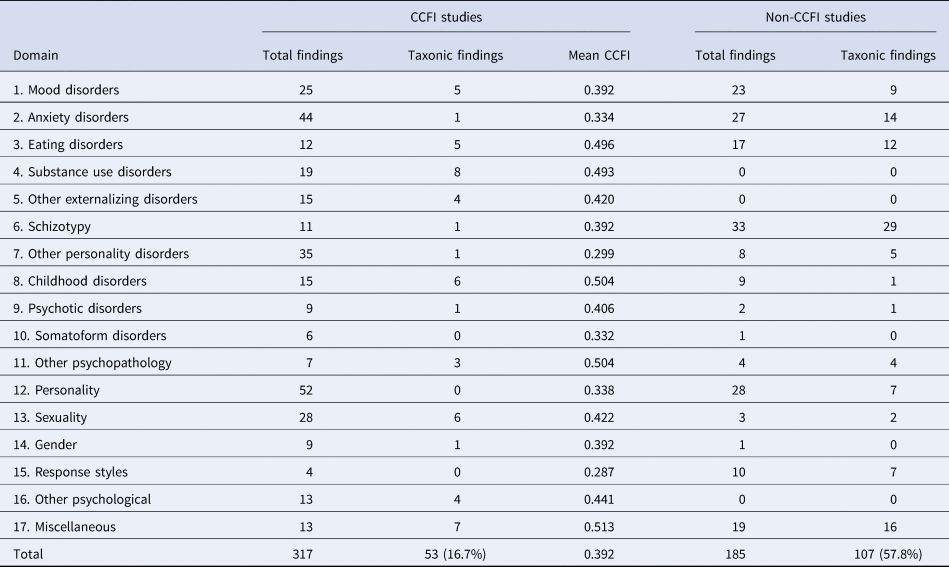
The mean sample size for the 502 findings was 2848.9 (median 964.5). Table 2 presents a breakdown of taxonicity-related findings for the 17 construct domains, stratified by use/non-use of the CCFI. Taxonic findings are much rarer among findings in which the CCFI was used (16.7%) than when it was not used (57.8%). The overall mean CCFI (0.392) is consistent with dimensionality and only two non-miscellaneous construct domains have mean CCFIs above the CCFI midpoint. The overall proportion of taxonic findings is lower than in Haslam et al. (Reference Haslam, Holland and Kuppens2012) (31.9% v. 38.9%), probably reflecting the increased recent adoption of the CCFI (i.e. 93.6% of taxometric articles published since 2010). Figure 1 presents the distribution of average CCFI values for the 317 relevant findings and shows evidence of bimodality: 75.71% of findings are unambiguously non-taxonic, 16.72% are unambiguously taxonic, and 7.57% are ambiguous.

Fig. 1. Distribution of average CCFI values for the 317 findings.
Table 2. Taxonicity-related findings for each construct domain as a function of use or non-use of the CCFI technique

Note: Taxonic findings for CCFI studies represent CCFI > 0.55.
Meta-analysis
Meta-analyses were performed to determine the overall support for dimensional v. taxonic findings, differences in support across the 17 construct domains, and the impact of potential moderators. The meta-analysis was restricted to the 317 findings, drawn from 243 studies reported in 183 articles, in which the CCFI was employed (a 133% increase over the comparable findings from Haslam et al., Reference Haslam, Holland and Kuppens2012), based on the desirability of a continuous metric and the index's demonstrated validity. The average CCFI calculated across multiple taxometric procedures (M = 2.74) used to generate each finding served as our effect size metric, as this has been shown to enhance the validity of the CCFI (Ruscio et al., 2007). We estimated multilevel meta-analytic regression models where findings are considered to be nested in studies, which are nested in articles. We treated the CCFI values as proportions because they can be considered to reflect the proportion of distances between the observed data and data generated under a taxonic model v. distances between the observed data and data generated under a dimensional model. Consequently, we logit-transformed the CCFI values and used these as a criterion variable for the analyses. As for proportions, the sampling variance of the CCFI values was estimated as 1/n(logit(CCFI)(1 − logit(CCFI))) with n being a constant to be estimated by the model to allow the true sampling variance of CCFI values to deviate with some order of magnitude from the sampling variance of ordinary proportions.
For ease of interpretation, when presenting our meta-analytic findings, we report back-transformed CCFI values with associated confidence intervals (CIs) rather than the model coefficients, which cannot easily be interpreted by themselves. We first estimated an empty, unconditional model on all data. The estimated intercept was −0.418 (s.e. = 0.056), which corresponds to an overall estimated CCFI of 0.40 (95% CI 0.37–0.42). This finding indicates that there is substantially stronger evidence for dimensions than taxa in the taxometric literature. The model intercept showed heterogeneity across articles (s.d. = 0.652), across findings in studies in articles (s.d. = 0.379), but not across studies in articles (s.d. = 0.000), as well as residual variation (s.d. = 2.878). This means that the systematic heterogeneity in all findings can be decomposed into 75% variation in CCFI values between articles, 0% of the variance between studies within articles, and 25% variation in findings within studies within articles.
We next analyzed the CCFI values as a function of the 17 construct domains. The estimated model indicated overall strong moderation by domain [χ2(df = 16) = 58.879, p < 0.001]. Figure 2 presents a forest plot with the estimated CCFI values and associated 95% CI by domain. There is strong evidence for the dimensionality of response styles, personality disorder, anxiety disorder, normal personality, mood disorder, other individual differences, and sexuality-related variables. The domains of somatoform disorder, schizotypy, psychotic disorder, other externalizing disorder, and gender-related variables have average CCFI values below 0.5, favoring dimensionality, but without excluding 0.5 in their CI. The eating disorder, childhood disorder, other psychopathology, substance use, and miscellaneous domains show average values just above 0.5 but including it in their CI. No domain has a CCFI value clearly supporting taxonicity.

Fig. 2. Forest plot with estimated average CCFI (and associated 95% CI) by construct domain.
We next contrasted CCFI estimates between significant domain groupings. First, we contrasted all psychopathology domains (domains 1–11) with all domains reflecting normal variation (domains 12–16). The corresponding CCFI values were 0.42 (95% CI 0.39–0.46) and 0.36 (95% CI 0.31–0.42), with the difference non-significant [χ2(df = 1) = 3.285, p = 0.070]. Thus, evidence for taxonicity in psychopathology is not significantly stronger than in the domain of normal psychological variation. Second, we contrasted internalizing [domains 1–3; CCFI = 0.41 (95% CI 0.35–0.46)] and externalizing disorders [domains 4–5; CCFI = 0.49 (95% CI 0.42–0.55)], yielding no significant difference [χ2(df = 1) = 3.124, p = 0.077]. Third, we contrasted abnormal personality [domains 6–7; CCFI = 0.35 (95% CI 0.28–0.42)] to all other forms of psychopathology [domains 1–5 and 8–11; CCFI = 0.44 (95% CI 0.40–0.48)]. Here the difference was significant [χ2(df = 1) = 4.879, p = 0.027], indicating that personality disorders show even stronger evidence of dimensionality than other forms of psychopathology. Finally, given the longstanding interest in schizotypy in taxometric research, we contrasted it [domain 6; CCFI = 0.40 (95% CI 0.27–0.54)] to other forms of abnormal personality [domain 7; CCFI = 0.30 (95% CI 0.25–0.36)], yielding no significant difference [χ2(df = 1) = 1.681, p = 0.195].
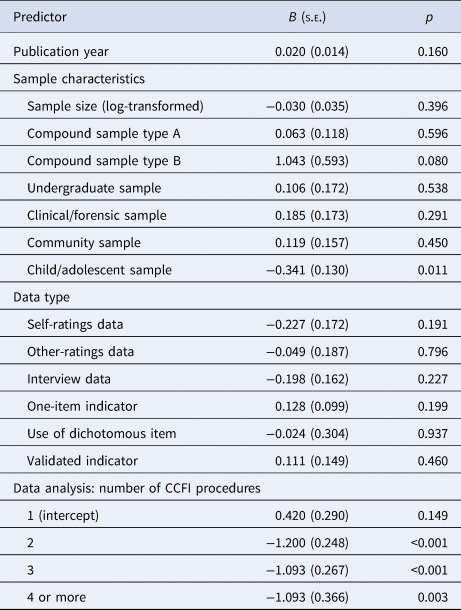
We next examined possible moderators. We first estimated a series of models with groups of associated moderator variables as predictors in separate models. In each analysis, we controlled for construct domain as certain moderators may occur more in some domains than others. The results of this series of models are presented in Table 3. There was minimal evidence for significant moderation by sample or other methodological factors. CCFI was unrelated to publication year, sample size, or use of a compound sample (although the use of the subtractive type B form was marginally associated with higher CCFI values). CCFI values did not significantly vary depending on sample type [χ2(df = 4) = 9.204, p = 0.056], although they were marginally lower when the sample consisted of children or adolescents compared to not. CCFI values were also unrelated to the use of self-ratings or other types of data [χ2(df = 3) = 2.310, p = 0.511]. The number of procedures used did moderate the obtained CCFI values, with those using more than one procedure, as recommended, obtaining lower CCFI values than the six effects based on a single procedure [χ2(df = 3) = 23.598, p < 0.001].
Table 3. Findings of single-predictor multilevel logistic regression analyses predicting CCFI values in studies involving simulations (moderators)
Comparison with non-CCFI studies
We examined to what extent the conclusions from taxometric studies based on simulation procedures and yielding CCFI values diverge from the conclusions of other studies. We ran a binomial linear mixed model on a binary outcome variable indicating a dimensional (0) or taxonic (1) conclusion. The dimensional findings included 240 where CCFI <0.45 and 53 from non-CCFI studies, and the taxonic findings included 53 where CCFI >0.55 and 107 from non-CCFI studies. Ambiguous CCFI values between 0.45 and 0.55 (n = 24) were considered missing. The binary outcome variable was predicted by a binary variable indicating whether the conclusion was based on simulations (1) or not (0), controlling for construct domain. The results indicated that taxonic v. dimensional conclusions differ based on whether or not findings were based on simulation procedures (B = −1.763, s.e. = 0.387, p < 0.001). This result indicates that the probability of a dimensional conclusion is 4.88 times higher when using the CCFI than when not, controlling for construct domain.
Identifying potential taxa
As a final step in the analysis, we attempted to identify variables that may be taxonic based on the best available taxometric evidence. In view of the apparent pro-taxonic bias in findings that do not employ the CCFI, we restricted our search to the CCFI-based findings. We sought variables whose taxonic status had been independently and preponderantly replicated, applying three search criteria: (1) a taxonic result (CCFI >0.55) had been replicated at least once for the variable of interest; (2) the taxonic result had been replicated by different research groups; and (3) the majority of findings for the variable supported taxonicity. Applying these criteria, the 53 taxonic CCFI-based findings contained replications of 13 variables. For two of these (depression, autism subtypes), taxonic findings were outnumbered by non-taxonic findings. Of the remaining 11 candidate taxonic variables, four (alcohol dependence, nicotine addiction, sexual orientation, religious fundamentalism) had not been replicated by different research groups (replications for the last three had all occurred across studies reported in a single article). Consequently, seven variables were identified as plausibly taxonic based on the current taxometric literature.
Our analysis suggests that alcohol dependence, intermittent explosive disorder, problem gambling, autism, suicide risk, pedophilia, and biological sex are plausibly taxonic based on current taxometric evidence. It should be noted that the plausibility hurdle was not high. Apart from pedophilia (three replications) and biological sex (two replications) the plausible taxonic findings have only been replicated a single time, the four taxonic findings for pedophilia narrowly outnumber non-taxonic findings four to three, and the suicide risk finding would be ruled out if a non-taxonic finding for suicidal ideation rather than risk were counted. Nevertheless, the seven variables demonstrate independently replicated, preponderantly taxonic findings generated by well-validated taxometric procedures.
Discussion
This study, the first meta-analysis of the substantial taxometric literature, allows us to draw several broad conclusions about the latent structure of psychological variation. First, it suggests that most individual difference variables implicate latent dimensions rather than categories. Dimensional findings overwhelmingly outnumbered taxonic findings, and no construct domain was reliably taxonic. Second, although evidence of taxa differs across construct domains, latent categories are no more prevalent in the realm of psychopathology than in the realm of normal psychological variation. By implication, categories are no more appropriate for diagnosing mental disorders than they are for describing personalities. Third, the study does not rule out the possibility that some taxa exist and indicates where some might be found. Finally, it confirms the prior conclusion (Haslam et al., Reference Haslam, Holland and Kuppens2012) that studies which did not use the simulated comparison data method, mostly published some time ago, deliver taxonic results at an elevated rate. As extensive Monte Carlo evidence shows that the CCFI has no significant bias for or against taxonic inferences, studies which did not use it appear to have a large pro-taxonic bias. That bias calls into question the disproportionately taxonic findings of much early taxometric research.
The preponderance of dimensional findings demonstrated in our analysis might raise the opposite concern that there is an anti-taxonic bias in the recent taxometric literature. For example, it could be argued that some studies may lack the power to detect low base-rate taxa, such as mental disorders with low population prevalence, and thus draw dimensional conclusions because almost all research participants fall in the complement class. There are four reasons to doubt this possibility. First, the sample size requirements for detecting low base-rate taxa are well known among taxometric researchers. Second, average sample sizes have increased in recent studies relative to those reviewed in Haslam et al. (Reference Haslam, Holland and Kuppens2012), while findings have increasingly supported dimensional conclusions. Third, in the current analysis, larger samples were associated with non-significantly lower (i.e. more dimensional) CCFI values, contrary to what would be expected if under-powered samples were biasing findings against finding taxa. Fourth, a follow-up analysis restricted to findings for psychopathological variables found no difference between the mean CCFI of findings obtained in community samples (0.410) and those in clinical samples (0.401), where base-rates of mental disorders would be substantially higher [t(153) = 0.30, p = 0.77]. We believe it is therefore unlikely that the predominance of dimensional findings reflects a failure to detect low base-rate taxa.
Many of the conclusions of the present review must remain qualified, as taxometric procedures are not the only methods for deciding between categorical and dimensional models (Borsboom et al., Reference Borsboom, Rhemtulla, Cramer, van der Maas, Scheffer and Dolan2016). However, they reinforce the disenchantment with categorical diagnosis that has taken place in recent decades. Growing recognition of the importance of quantitative variation in expressions of particular disorders, the spectrum relationships among ostensibly different disorders, the compatibility of known genetic influences with latent continuity (Smoller et al., Reference Smoller, Andreassen, Edenberg, Faraone, Glatt and Kendler2019), and the utility of dimensional systems for capturing variation in psychopathology has led to many proposals for change. Some have been revisionist, such as the move to include dimensional diagnosis in the personality disorder domain in DSM-5 (Lilienfeld & Treadway, Reference Lilienfeld and Treadway2016). Others have been revolutionary, such as the dimensional HiTOP classification (Kotov et al., Reference Kotov, Krueger, Watson, Achenbach, Althoff, Bagby and Eaton2017). Considerations of latent structure should not be the sole bases for choosing between categorical and dimensional classifications, but the findings of this meta-analysis strongly support the basic assumptions of dimensional diagnosis.
Although the meta-analytic findings indicate that most psychological variation is dimensional, it also tentatively supports the existence of a few taxa. No construct domain was particularly taxon-heavy, and the domains of normal and abnormal personality were particularly taxon-light, but seven potential taxa were identified. Six of these – alcohol use disorder, intermittent explosive disorder, problem gambling, autism, suicide risk, and pedophilia – fell in the broad psychological realm. Four additional variables – alcohol dependence, nicotine addiction, sexual orientation, and religious fundamentalism – also yielded a preponderance of taxonic findings but have not been independently replicated. It is noteworthy that these candidate taxa do not include any of the most widely researched mental disorders, autism notwithstanding. It is also noteworthy that many involve addiction or an addiction-like dynamic (i.e. problem gambling) and sexuality. Indeed, with the exception of autism, all are closely linked to specific behaviors (alcohol and nicotine consumption, gambling, suicidal self-harm, anger outbursts), preferences (attractions to same-sex or other-sex adults or children), or beliefs (fundamentalist religion). It might be speculated that psychiatric taxa tend to involve distinct learning trajectories or dynamic category formation processes, shaped by specific motivational attractors. Meehl (Reference Meehl1992) speculated on the existence of such ‘environment-mold taxa’ and in the psychiatric realm they may be more common than taxa of the ‘natural kind’ sort, which spring from specific biological etiologies (Haslam, Reference Haslam, Kincaid and Sullivan2014).
Any such speculations must be made cautiously, because current evidence for the candidate taxa is slender. Although 279 taxometric articles have been published, they have explored such diverse phenomena that their coverage of many variables has been too thin to generate reliable structural conclusions (e.g. robust meta-analytic effect estimates). It is for this reason that the bulk of our analysis focused on 17 broad construct domains rather than more than 100 specific constructs. Future taxometric research should deepen that evidence base by focusing on the candidate taxa to determine whether they replicate consistently. Conversely, this meta-analysis strongly suggests that there is little value in conducting future taxometric studies of normal and abnormal personality, response styles, mood disorders, and anxiety disorders. Findings in these domains have been extensive and overwhelmingly dimensional. Schizotypy presents a possible exception as there remains substantial disagreement in the literature. There have been 44 taxometric findings for schizotypy-related variables: of the 33 findings not based on the CCFI, 29 drew a taxonic conclusion, and of the 11 employing it, only one finding did so (mean CCFI = 0.392). With non-CCFI findings shown to have a strong pro-taxonic bias and this meta-analysis finding that CCFIs for schizotypy are comparable to those for other abnormal personality characteristics, it seems prudent to infer that the evidence favors schizotypy being dimensional.
Conclusions
After initially generating great enthusiasm for the existence of latent categories, the taxometric literature has veered off in a very different direction in the past decade. Since the advent of data simulation-based procedures, taxonic findings have become scarce. It has grown increasingly clear that taxa are rare in the field of psychopathology and perhaps mythical in the field of personality (Haslam, Reference Haslam2019). This meta-analysis supports the findings of previous, non-meta-analytic reviews of the taxometric literature by establishing that taxonic findings are infrequent when appropriate methodological controls are applied, and by quantifying the powerful bias toward taxonic inferences that exists when they are not. On the evidence of this analysis, 84.5% of simulation-based taxometric research findings about psychological variation do not support the presence of a taxon and dimensional findings are almost five times more likely when the simulation method is used than when it is not.
The analysis extends previous reviews in several respects. First, its use of meta-analytic methods adds robustness to its conclusions. In particular, it demonstrates that almost half of the 16 psychological construct domains examined – normal personality, response styles, other normal-range individual differences, non-schizotypy-related personality disorders, anxiety disorder, mood disorder, and sexuality-related variables – are consistently dimensional. Second, the planned contrasts between domains revealed that there was no significant difference in support for taxa in the broad field of psychopathology than in normal psychological variation, as well as several other systematic comparisons that had not been possible before. The former conclusion is important because it challenges the common assumption that although normal variations may fall on a continuum, mental disorder should be understood categorically. The meta-analysis effectively erases the distinction between normal and abnormal at the level of latent structure, consistent with the emerging evidence that a common factorial structure underpins normal and abnormal personality and psychiatric disorders (Rosenström et al., Reference Rosenström, Gjerde, Krueger, Aggen, Czajkowski, Gillespie and Ystrom2019). However, it does not erase the possibility that some taxa exist, and its third new contribution is to point to where promising candidate taxa may be found, pending further replication.
Our synthesis of four decades of taxometric research shows that it has made significant steps toward clarifying the structure of psychological variation. Taxometrics was initially presented as a tool for discovering where taxa are present in personality and psychopathology, but its legacy may be to have shown that their absence is a reasonable default assumption in these domains.
Financial support
None.
Conflict of interest
None.