


Introduction
With a prevalence of 15%, clinically relevant depressive symptoms are common in older individuals (Beekman et al. Reference Beekman, Deeg, van Tilburg, Smit, Hooijer and van Tilburg1995). Depressive symptoms also frequently occur in persons with cognitive decline and dementia (Lyketsos et al. Reference Lyketsos, Lopez, Jones, Fitzpatrick, Breitner and DeKosky2002). The relationship between depression and cognitive decline is complex and the direction of causation is still a topic for research (van den Kommer et al. Reference van den Kommer, Comijs, Aartsen, Huisman, Deeg and Beekman2013). Many studies found that depression precedes cognitive decline and dementia, suggesting that depression may be a risk factor for or a prodrome of cognitive decline (Yaffe et al. Reference Yaffe, Blackwell, Gore, Sands, Reus and Browner1999; Kohler et al. Reference Kohler, van Boxtel, van Os, Thomas, O'Brien, Jolles, Verhey and Allardyce2010; Verdelho et al. Reference Verdelho, Madureira, Moleiro, Ferro, O'Brien, Poggesi, Pantoni, Fazekas, Scheltens, Waldemar, Wallin, Erkinjuntti and Inzitari2013) and subsequent dementia (da Silva et al. Reference da Silva, Goncalves-Pereira, Xavier and Mukaetova-Ladinska2013). However, the direction of causation may be reversed, such that poorer cognitive performance is associated with a subsequent higher level of depressive symptoms. For instance, depression may occur due to a psychological reaction to the awareness of cognitive impairment (Vinkers et al. Reference Vinkers, Gussekloo, Stek, Westendorp and van der Mast2004). Moreover, both depression and poorer cognitive performance could result from the same underlying brain abnormalities, as suggested for instance by the vascular depression hypothesis (Alexopoulos et al. Reference Alexopoulos, Meyers, Young, Campbell, Silbersweig and Charlson1997a ; Comijs et al. Reference Comijs, van Tilburg, Geerlings, Jonker, Deeg, van Tilburg and Beekman2004; Sanders et al. Reference Sanders, Bremmer, Comijs, Deeg, Lampe and Beekman2011).
Studies that assessed the prospective association of cognitive performance with subsequent depressive symptoms found inconsistent results (de Beurs et al. Reference de Beurs, Beekman, Geerlings, Deeg, Van Dyck and Van Tilburg2001; Cole & Dendukuri, Reference Cole and Dendukuri2003; Vinkers et al. Reference Vinkers, Gussekloo, Stek, Westendorp and van der Mast2004; Panza et al. Reference Panza, D'Introno, Colacicco, Capurso, Del Parigi, Caselli, Frisardi, Scapicchio, Chiloiro, Scafato, Gandin, Vendemiale, Capurso and Solfrizzi2009; Sanders et al. Reference Sanders, Bremmer, Comijs, Deeg, Lampe and Beekman2011). Whereas some found an association between cognitive performance and a higher level of depressive symptoms (Vinkers et al. Reference Vinkers, Gussekloo, Stek, Westendorp and van der Mast2004; Sanders et al. Reference Sanders, Bremmer, Comijs, Deeg, Lampe and Beekman2011), others did not (de Beurs et al. Reference de Beurs, Beekman, Geerlings, Deeg, Van Dyck and Van Tilburg2001; Cole & Dendukuri, Reference Cole and Dendukuri2003; Panza et al. Reference Panza, D'Introno, Colacicco, Capurso, Del Parigi, Caselli, Frisardi, Scapicchio, Chiloiro, Scafato, Gandin, Vendemiale, Capurso and Solfrizzi2009).
Most prospective studies on the association of cognitive performance with depressive symptoms have data on depressive symptoms available at two points in time (de Beurs et al. Reference de Beurs, Beekman, Geerlings, Deeg, Van Dyck and Van Tilburg2001; Panza et al. Reference Panza, D'Introno, Colacicco, Capurso, Del Parigi, Caselli, Frisardi, Scapicchio, Chiloiro, Scafato, Gandin, Vendemiale, Capurso and Solfrizzi2009). However, since depressive symptoms typically change in severity over time (e.g. increase, decrease, or fluctuation of symptoms) (Stegenga et al. Reference Stegenga, Kamphuis, King, Nazareth and Geerlings2012; Sutin et al. Reference Sutin, Terracciano, Milaneschi, An, Ferrucci and Zonderman2013), it is important to assess depressive symptoms at several time points, preferably with short intervals (Beekman et al. Reference Beekman, Geerlings, Deeg, Smit, Schoevers, de Beurs, Braam, Penninx and van Tilburg2002). Studies that assessed the association of baseline cognitive performance with depressive symptoms measured more than two times, with short intervals and during a reasonably long follow-up period are scarce and found conflicting results (Vinkers et al. Reference Vinkers, Gussekloo, Stek, Westendorp and van der Mast2004; Sanders et al. Reference Sanders, Bremmer, Comijs, Deeg, Lampe and Beekman2011). Poorer cognitive performance at baseline has been associated with an accelerated increase of depressive symptoms (Vinkers et al. Reference Vinkers, Gussekloo, Stek, Westendorp and van der Mast2004). Moreover, in patients with clinically relevant depressive symptoms, poorer cognitive performance has been associated with a chronic course of depressive symptoms rather than remission (Sanders et al. Reference Sanders, Bremmer, Comijs, Deeg, Lampe and Beekman2011). Furthermore, few of these studies with frequent measures of depressive symptoms distinguished separate cognitive domains. In line with the vascular depression hypothesis, executive dysfunction and slowed processing speed have been related to a higher level of depressive symptoms (Alexopoulos et al. Reference Alexopoulos, Meyers, Young, Kakuma, Silbersweig and Charlson1997b ; Sheline et al. Reference Sheline, Barch, Garcia, Gersing, Pieper, Welsh-Bohmer, Steffens and Doraiswamy2006; Sanders et al. Reference Sanders, Bremmer, Comijs, Deeg, Lampe and Beekman2011). Also, impaired attention and memory performance have previously been associated with an accelerated annual increase of depressive symptoms (Vinkers et al. Reference Vinkers, Gussekloo, Stek, Westendorp and van der Mast2004). However, this latter study was conducted in individuals aged ≥85 years. As a consequence, the influence of cognitive impairment on the longitudinal course of depressive symptoms in middle-aged adults remains largely unknown.
The aim of the present study was to examine the influence of cognitive performance at baseline on the course of depressive symptoms (e.g. increase, decrease or fluctuation of symptoms) measured at 6-month intervals during 7 years of follow-up in patients with vascular disease, a group at increased risk for both cognitive impairment (Duron & Hanon, Reference Duron and Hanon2008) and depression (Valkanova & Ebmeier, Reference Valkanova and Ebmeier2013).
Method
SMART-MR study
Data were used from the Second Manifestations of ARTerial disease-Magnetic Resonance (SMART-MR) study, a prospective cohort study aimed to investigate brain changes on MRI in 1309 patients who were referred to the University Medical Center Utrecht with coronary artery disease, cerebrovascular disease, peripheral arterial disease or abdominal aortic aneurysm, and who had no MRI contraindications. Details of the design and participants have been described elsewhere (Geerlings et al. Reference Geerlings, Appelman, Vincken, Algra, Witkamp, Mali and van der Graaf2010). In brief, between May 2001 and December 2005, all patients newly referred to the University Medical Center Utrecht with manifest coronary artery disease, cerebrovascular disease, peripheral arterial disease, or an abdominal aortic aneurysm and without MRI contraindications were invited to participate. During a 1-day visit to our medical centre, an MRI scan of the brain was performed, in addition to a physical examination, ultrasonography of the carotid arteries, and blood and urine sampling. Risk factors, medical history, and functioning were assessed with questionnaires. Neuropsychological assessment was introduced in the SMART-MR study in January 2003 and was performed on the same day as the MRI and other investigations. Between January 2006 and May 2009, all participants still alive were invited for follow-up. For the present study, information on cognitive performance was used from the second SMART-MR measurement, as this is the first measurement in which data on depressive symptoms were collected. These data were obtained between January 2006 and May 2009 from the 754 participants that were still alive. Physical examination, neuropsychological assessment, ultrasonography of the carotid arteries, blood and urine sampling, and an MRI scan of the brain were performed. Questionnaires were used for assessing vascular risk factors and medical history, including medication use, and assessment of depressive symptoms. Starting in July 2008, depressive symptoms were assessed biannually. This cohort with follow-up every 6 months is the basis of the present study. The SMART-MR study was approved by the ethics committee of our institution, and written informed consent was obtained from all participants.
Neuropsychological assessment
Cognitive performance was assessed with a set of standard neuropsychological manual pen-and-paper tests, sensitive to mild impairments. Composite z scores for the domains memory (MEM), working memory (WMEM), attention and executive functioning (EXEC), and information processing speed (SPEED) were calculated. This division was made according to standard neuropsychological practice and cognitive theory, as described in detail in Lezak et al. (Reference Lezak, Howieson and Loring2004) (for details, see online Appendix). The composite scores for MEM included the immediate recall (range 0–15) and delayed recall (0–15) of the 15-word learning test (a modification of the Rey Auditory Verbal Learning test; Brand & Jolles, Reference Brand and Jolles1985), a retention score, estimated by dividing the number of words recalled after 25 min by the maximum number of words recalled during the immediate recall, and the delayed recall of the Rey–Osterrieth Complex Figure test (Osterrieth, Reference Osterrieth1944). The composite score for WMEM included the Forward and Backward Digit Span (of the Wechsler Adult Intelligence Scale – III; Wechsler, Reference Wechsler2008). The composite score for EXEC included three tests. First, we used the timing score of the Visual Elevator test, a timed test of 10 trials that measures mental flexibility and shifting of attention (Robertson et al. Reference Robertson, Ward, Ridgeway and Nimmo-Smith1996). Second, we used the Brixton Spatial Anticipation test to assess the capacity to discover logical rules and mental inhibition and flexibility (Burgess & Shallice, Reference Burgess and Shallice1996). Third, we used the Verbal Fluency test (letter A, 1-min time-frame, and category ‘animals’, 2-min time-frame) to assess mental flexibility and employment of strategies (Wilkins et al. Reference Wilkins, Shallice and McCarthy1987). SPEED was assessed with the Digit Symbol Substitution test (Lezak et al. Reference Lezak, Howieson and Loring2004). Composite z scores were computed by converting raw scores to standardized z scores and averaging them across all subtests per domain. Before calculating z scores, the scores of the Visual Elevator test and the Brixton Spatial Anticipation test were multiplied by minus 1 so that lower scores represented poorer performance.
Depressive symptoms
The Patient Health Questionnaire-9 (PHQ-9; Kroenke et al. Reference Kroenke, Spitzer and Williams2001; Thombs et al. Reference Thombs, Ziegelstein and Whooley2008) was used to assess depressive symptoms at baseline. Subsequently, starting in July 2008, the PHQ-9 questionnaire was sent to all participants every 6 months. The PHQ-9 assesses the presence of the nine DSM-IV symptoms for major depressive disorder in the past 2 weeks. Responses are scored on a 4-point Likert scale of 0–3, indicating that the participant experiences the symptom ‘not at all’, ‘on several days’, ‘on more than half the days’, or ‘nearly every day’. The total score ranges between 0 and 27, with higher scores indicating more severe symptoms. If no more than four items on the PHQ-9 questionnaire were missing, the mean PHQ score of the subject was imputed. A previous study from our study group performed factor analyses in this cohort of patients with symptomatic atherosclerotic disease, to divide the nine PHQ-9 items into motivational (anhedonia, appetite disturbance, energy loss, sleep disturbance, concentration problems, and psychomotor retardation) and mood (depressed mood, feelings of guilt, and suicidal thoughts) profiles (Grool et al. Reference Grool, Gerritsen, Zuithoff, Mali, van der Graaf and Geerlings2013). The sum score of the motivational profile ranged between 0 and 18, and the sum score of the mood profile ranged between 0 and 9. To identify patients with clinically relevant levels of depressive symptoms, a previous suggested cut-off score of ⩾6 for the PHQ-9 was used (Thombs et al. Reference Thombs, Ziegelstein and Whooley2008). Using this cut-off score, the validity of the PHQ-9 to detect major depressive disorder (MDD) was good (sensitivity 83%, specificity 76%).
MRI protocol
MRI investigations were performed on a 1.5 T whole-body system (Gyroscan ACS-NT, Philips Medical Systems, The Netherlands). The MRI protocol and brain segmentation method has been described elsewhere (Anbeek et al. Reference Anbeek, Vincken, van Osch, Bisschops and van der Grond2004, Reference Anbeek, Vincken, van Bochove, van Osch and van der Grond2005; Geerlings et al. Reference Geerlings, Appelman, Vincken, Algra, Witkamp, Mali and van der Graaf2010). In brief, total brain volume was calculated by summing the volumes of grey and white matter and, if present, the volumes of white-matter lesions (WMLs) and infarcts. All volumes cranial to the foramen magnum were included. As a result, the total brain volume includes the cerebrum, brainstem and cerebellum. Total intracranial volume (ICV) was calculated by summing the total brain volume and the volumes of sulcal and ventricular CSF. Total brain and ventricular volums were normalized for ICV and were expressed as brain parenchymal fraction and ventricular fraction (% of ICV). At baseline and follow-up infarcts were visually rated by an investigator and neuroradiologist, blinded to clinical characteristics and were re-evaluated in a consensus meeting. Volumes of WMLs obtained with the segmentation programme consisted of periventricular and deep lesions and were summed to obtain the total volume of WMLs. WML volumes were normalized for ICV and natural log-transformed.
Covariates
Premorbid intellectual functioning was assessed using the Dutch version of the National Adult Reading test (DART; Schmand et al. Reference Schmand, Geerlings, Jonker and Lindeboom1998). Educational level was divided into seven categories: graded from primary school (~6 years of education) to academic degree (~16 years of education), according to the Dutch educational system. During the visit to the medical centre, an overnight fasting venous blood sample was taken to determine glucose levels. Height and weight were measured without shoes and heavy clothing, and body mass index (kg/m2) was calculated. Systolic and diastolic blood pressure (mmHg) were measured twice in supine position with a sphygmomanometer and averaged. Diabetes mellitus was defined as a known history of diabetes, self-reported or registered glucose-lowering therapy, or glucose ⩾11.1 mmol/l. Patients not meeting these criteria, but with a fasting plasma glucose level ⩾7.0 mmol/l at baseline, were considered to have diabetes if they received treatment with glucose-lowering agents within 1 year after baseline. Pack-years of smoking was calculated, and alcohol intake was categorized into <1 drink per week, 1–20 drinks per week, and >20 drinks per week. Presence of major depressive disorder according to DSM-IV criteria (APA, 1994) in the preceding 12 months was assessed at baseline in all participants using the Composite International Depression Interview v. 2.1 (Robins et al. Reference Robins, Wing, Wittchen, Helzer, Babor, Burke, Farmer, Jablenski, Pickens and Regier1988). Use of antidepressant medication (tricyclic antidepressants, selective serotonin reuptake inhibitors, or monoamine oxidase inhibitors) and benzodiazepines was assessed through questionnaires.
Study sample
Of the 754 patients included in the second measurement of the SMART-MR study, data on neuropsychological assessment was missing in 18 patients (2%), resulting in a total study sample of 736 patients.
Data analysis
Baseline characteristics were calculated for the study population. IBM SPSS Statistics v. 20 (IBM, USA) was used for statistical analysis.
Because the repeated PHQ-9 assessments within one subject are not independent of each other, we used generalized estimating equation (GEE) models for continuous outcomes with robust standard errors to assess the association between different domains of cognitive functioning and level of depressive symptoms at multiple time points during follow-up (Twisk, Reference Twisk2003). GEE uses all available longitudinal data to analyse the development of the outcome over time without summarizing the longitudinal course of each of the subjects into one value. The parameter estimate for the cognitive domains reflects the fixed effect of cognitive performance on depressive symptoms across all time points. Time between PHQ-9 assessments was divided into intervals of 6 months and entered as a categorical variable in the GEE model. An interaction term between the respective cognitive domains and time was included to examine if the course of depressive symptoms differed according to baseline cognitive performance. If the interaction was not significant (interaction p value >0.05), the GEE analyses were repeated without the interaction term to estimate the fixed effects of cognitive function and time. In model 1 we adjusted for age, sex, educational level, and DART score, because these covariates may be important confounders in the association between cognitive performance and depressive symptoms. To test the possible hypothesis that depressive symptoms are a psychological reaction to the awareness of cognitive dysfunction we additionally adjusted for subjective memory complaints (model 2). In models 3 and 4 we additionally adjusted for WMLs (model 3) and brain infarcts (model 4), because these vascular brain lesions may be explanatory variables in the association between cognitive performance and depressive symptoms. We finally adjusted for vascular risk factors (diabetes mellitus, systolic and diastolic blood pressure, body mass index, alcohol use, and pack-years of smoking) (model 5), because they can be confounders, shared risk factors or precursors in the associations that we investigated.
We repeated the analyses using motivational (range 0–18) and mood (range 0–9) sum scores as respective dependent variables in model 1 to examine if the observed relationship was driven by motivational or mood symptoms.
To visualize the temporal course of depressive symptoms for different levels of cognitive performance, we used the regression coefficients from the GEE models from model 1 to estimate PHQ-9 scores at each follow-up measurement in a regression equation. For the different levels of cognitive performance, we used −2 s.d., 0, and +2 s.d. of the composite z scores of the respective cognitive domains, and in the regression equation we used the mean or median characteristics of our study sample.
Results
The mean (s.d.) age of the study population was 62 (10) years, the mean PHQ-9 score was 2.8 (3.5) at baseline, and the majority were men (82%) (Table 1). The median (10th–90th percentile) number of PHQ-9 assessments was nine (3–10), during a median follow-up time of 65 (32–83) months. Overall response on the repeated PHQ-9 assessments was high, varying between 86% and 97%. In the total study population, depressive symptom scores did not significantly change over time (p value interaction = 0.167). Mean (s.d.) scores on neuropsychological tests are presented in online Supplementary Table S1.
Table 1. Baseline characteristics of the study sample
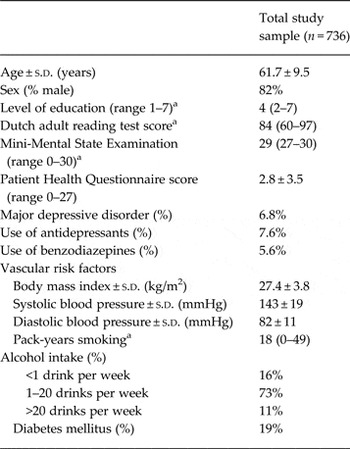
a Median (10th–90th) percentile.
The GEE analyses showed no significant interactions between the domains of cognitive performance and time (interaction p value MEM = 0.79, WMEM = 0.89, EXEC = 0.52, SPEED = 0.65), indicating that the course of depressive symptoms over time did not differ in relation to baseline cognitive performance. We therefore repeated the analyses without the interaction terms. These analyses showed that 1 s.d. decrease in z score of MEM was associated with a significantly higher level of depressive symptoms averaged across all time points [B = 0.70, 95% confidence interval (CI) 0.35–1.05], independent of age, sex, educational level, and DART score (Table 2). Moreover, 1 s.d. decrease in z score of EXEC and SPEED was significantly associated with a higher level of depressive symptoms (EXEC: B = 0.88, 95% CI 0.41–1.36; SPEED: B = 0.57, 95% CI 0.21–0.92). Table 2 shows the results of the different models we used to adjust for potential confounders or explanatory variables. Additionally adjusting for subjective memory complaints at baseline (model 2) attenuated the results. Adjusting for vascular brain lesions had only small impact on the estimates (models 3 and 4) with the largest impact for WMLs, but the observed associations remained significant. Finally, adjusting for vascular risk factors (model 5) also slightly attenuated the results, and conclusions remained similar. A 1 s.d. decrease in z score of WMEM was not significantly associated with a higher level of depressive symptoms (Table 2). The fixed effects of time were not statistically significant (p value of fixed effect of time for MEM = 0.15, WMEM = 0.13, EXEC = 0.11, SPEED = 0.12), indicating that the level of depressive symptoms did not change over time.
Table 2. Results from the Generalized Estimating Equation models showing difference in Patient Health Questionnaire-9 (PHQ-9) score averaged across all time points per s.d. decrease in z score of cognitive function

B (95% CI) is the standardized B with 95% confident interval and represents the change in PHQ-9 score per s.d. decrease in z scores of memory, working memory, executive function, and information processing speed.
Model 1: adjusted for age, sex, educational level, and Dutch version of the National Adult Reading test (DART) score.
Model 2: model 1 + subjective memory complaints at baseline.
Model 3: model 1 + log-transformed white-matter lesion volumes.
Model 4: model 1 + presence of brain infarcts.
Model 5: model 1 + vascular risk factors (diabetes mellitus, systolic and diastolic blood pressure, body mass index, alcohol use, and pack years of smoking).
When underlying symptoms profiles were distinguished, we observed that the associations of cognitive performance with an increased level of depressive symptoms during follow-up were stronger for motivational symptoms. In Table 3 it can be seen that the intervals do not overlap for memory, executive functioning and information processing speed. Although not a formal test, it suggests that the associations of MEM, EXEC and SPEED with motivation were stronger than the associations with mood.
Table 3. Results from the Generalized Estimating Equation models showing difference in mood and motivation score of the Patient Health Questionnaire-9 (PHQ-9) score averaged across all time points per s.d. decrease in z score of cognitive function

B (95% CI) is the standardized B with 95% confidence interval and represents the change in PHQ-9 score per s.d. decrease in z scores of memory, working memory, executive function, and information processing speed. B values are adjusted for age, sex, educational level, and Dutch version of the National Adult Reading test (DART) score.
Fig. 1 shows the estimated PHQ-9 scores at each follow-up measurement according to three levels of cognitive performance (−2 s.d., 0, +2 s.d.) for an average individual in our study sample (i.e. age = 62 years, educational level = 4, DART score = 84, sex = 0.2 representing the 20% women in our sample).

Fig. 1. Estimated Patient Health Questionnaire-9 (PHQ-9) scores during follow-up for patients with relatively good (solid line; +2 s.d.), moderate (dotted line; 0), and poor (dot-dashed line; −2 s.d.) cognitive performance on the domains (a) memory (MEM), (b) working memory (WMEM), (c) executive functioning (EXEC) and (d) information processing speed (SPEED) for an average individual in our study sample (i.e. age = 62; educational level = 4; Dutch version of the National Adult Reading test (DART) score = 84; sex = 0.2 representing the 20% women in our sample).
Discussion
In this prospective cohort study of middle-aged and older persons with a history of vascular disease we observed that poorer memory, poorer executive functioning, and poorer information processing speed were associated with a consistently higher level of depressive symptoms over 7 years of follow-up. Cognitive performance was, however, not associated with change in depressive symptoms during follow-up (increase, decrease, or fluctuation of symptoms). Working memory was not significantly associated with level or change in depressive symptoms.
Before we interpret our findings, some strengths and limitations of the study should be considered. Strengths are the prospective design with long follow-up period and frequently assessed depressive symptoms. Furthermore, the sample size was large and overall response rates during all follow-up measurements were high. This made it possible to monitor mild fluctuations in depressive symptoms over time. Second, we assessed cognitive functioning in multiple domains, which allowed us to examine to what extent cognitive domains were differentially associated with depressive symptom course.
A limitation is that we did not have follow-up measures of cognitive functioning. We could therefore not assess if the temporal course of depressive symptoms changed as a function of change in cognitive performance over time. A second limitation is that our study sample mainly consisted of male patients and we were therefore not able to investigate to what extent gender differences modified our results. Furthermore, we had no follow-up data available on anxiety and could therefore not investigate is our findings were specific for depression. Another limitation is that we used manual paper-and-pen tests that may be less reliable than computerized reaction-time tests. However, all cognitive tests that we used are known to be sensitive to mild cognitive impairments. It is possible, however, that because our participants had relatively intact cognitive performance and on average a relatively low level of depressive symptoms we did not find a change in depressive symptom course as a function of cognitive performance. Finally, participants in our study were included with symptomatic atherosclerotic disease. Therefore, we do not know whether the findings can be generalized to the general population.
To the best of our knowledge, this is the first study that investigates the influence of cognitive performance on the longitudinal course of depressive symptoms in patients with a history of vascular disease. A number of studies have found that cardiovascular disease and a high cardiovascular risk are associated with cognitive dysfunction (Vogels et al. Reference Vogels, Scheltens, Schroeder-Tanka and Weinstein2007; Unverzagt et al. Reference Unverzagt, McClure, Wadley, Jenny, Go, Cushman, Kissela, Kelley, Kennedy, Moy, Howard and Howard2011) and depression (Rothenbacher et al. Reference Rothenbacher, Hahmann, Wusten, Koenig and Brenner2007; Huang et al. Reference Huang, Dong, Lu, Yue and Liu2010; Valkanova & Ebmeier, Reference Valkanova and Ebmeier2013). Studying this research question in this particular population is therefore relevant and important. In this study sample, not selected on depression status, we observed that poorer cognitive performance at baseline was associated with modestly higher levels of depressive symptoms. These elevated symptoms were stable over time and, on average, remained below the previously suggested critical threshold of 6 for clinically relevant depressive symptoms (Thombs et al. Reference Thombs, Ziegelstein and Whooley2008). These findings thus suggest that middle-aged and older persons with a history of vascular disease are not necessarily on a trajectory towards higher incidence of clinically relevant depressive symptoms. While major depression following cardiovascular events is frequent (Rudisch & Nemeroff, Reference Rudisch and Nemeroff2003; Thombs et al. Reference Thombs, Bass, Ford, Stewart, Tsilidis, Patel, Fauerbach, Bush and Ziegelstein2006; Robinson & Spalletta, Reference Robinson and Spalletta2010) the long-term course of depression has not previously been studied in patients with a history of vascular disease. Moreover, the vascular depression hypothesis predicts a higher level of depressive symptoms as well as impairment in executive functioning as a consequence of frontal-subcortical lesions but it does not necessarily predict a poorer course of depressive symptoms as a function of impaired cognition, or perhaps only if the vascular brain lesions also increased. However, we do not have information on course of brain lesions and can thus not answer this question. It should also be noted that the patients in this sample were included 4 years after entering the SMART-MR study and we have no information on their depression status at that time. It is thus possible that the increased risk for depression faded and the sample is more similar to the general population.
In line with previous cross-sectional (Bierman et al. Reference Bierman, Comijs, Jonker and Beekman2007; Gale et al. Reference Gale, Sayer, Cooper, Dennison, Starr, Whalley, Gallacher, Ben-Shlomo, Kuh, Hardy, Craig and Deary2011) and prospective (Vinkers et al. Reference Vinkers, Gussekloo, Stek, Westendorp and van der Mast2004; Sanders et al. Reference Sanders, Bremmer, Comijs, Deeg, Lampe and Beekman2011) studies, our study shows that patients with relatively poor cognitive performance have a consistent higher level of depressive symptoms during follow-up. This is in contrast to other population-based cohort studies in older individuals, who found no association between cognitive performance at baseline and depressive symptoms in prospective analyses (de Beurs et al. Reference de Beurs, Beekman, Geerlings, Deeg, Van Dyck and Van Tilburg2001; Cole & Dendukuri, Reference Cole and Dendukuri2003; Panza et al. Reference Panza, D'Introno, Colacicco, Capurso, Del Parigi, Caselli, Frisardi, Scapicchio, Chiloiro, Scafato, Gandin, Vendemiale, Capurso and Solfrizzi2009). Poorer cognitive performance can lead to a higher level depressive symptoms for several reasons. First, depressive symptoms can be the result of a psychological reaction to the awareness of poorer cognitive performance. Indeed, memory complaints are highly associated with a depressed mood (Jonker et al. Reference Jonker, Geerlings and Schmand2000). In the present study we find some support for this explanation, because adjusting for subjective memory complaints attenuated the strength of the association between cognitive performance and depressive symptoms. Second, our findings could be explained by a common underlying aetiology or shared risk factors. Poorer cognitive performance and depressive symptoms could both result from shared underlying brain changes. For instance, the vascular depression hypothesis states that disruption of frontal-subcortical pathways by small vessel lesions is associated with a higher level of depressive symptoms (Alexopoulos et al. Reference Alexopoulos, Meyers, Young, Campbell, Silbersweig and Charlson1997a ; Krishnan et al. Reference Krishnan, Hays and Blazer1997). This disruption of frontal-subcortical pathways is also related to executive dysfunction, psychomotor retardation, and a lack of energy, symptoms that all have been proposed as characteristic symptoms of ‘vascular depression’ (Alexopoulos et al. Reference Alexopoulos, Meyers, Young, Kakuma, Silbersweig and Charlson1997b ; Alexopoulos, Reference Alexopoulos2001). Our study also supports this hypothesis because adjusting for WMLs and brain infarcts attenuated the strength of the association between cognitive performance and depressive symptoms. The vascular depression hypothesis could also explain our finding that the association was strongest for motivational symptoms (Alexopoulos et al. Reference Alexopoulos, Meyers, Young, Kakuma, Silbersweig and Charlson1997b ).
Previous prospective studies did not distinguish separate cognitive domains when assessing the association of cognitive performance with depressive symptoms, but only measured for example intelligence (Gale et al. Reference Gale, Sayer, Cooper, Dennison, Starr, Whalley, Gallacher, Ben-Shlomo, Kuh, Hardy, Craig and Deary2011) or Mini-Mental State Examination (MMSE) score (Schoevers et al. Reference Schoevers, Beekman, Deeg, Geerlings, Jonker and Van Tilburg2000; de Beurs et al. Reference de Beurs, Beekman, Geerlings, Deeg, Van Dyck and Van Tilburg2001). We observed that poorer cognitive performance in multiple cognitive domains, with the exception of working memory, was associated with an increased level of depressive symptoms during follow-up. While one study found an association with memory and attention (Vinkers et al. Reference Vinkers, Gussekloo, Stek, Westendorp and van der Mast2004), another study found an association with slowed processing speed (Sanders et al. Reference Sanders, Bremmer, Comijs, Deeg, Lampe and Beekman2011), suggesting a generalized effect of cognitive function. This may support the psychological reaction hypothesis if poorer performance in more than one domain increases the awareness of poorer cognitive performance and therefore causes depressive symptoms. The symptom profile of depression was more specific however, as we observed that the associations were strongest for motivational symptoms. This could be interpreted as being supportive of a vascular origin of the depressive symptoms, but it could also have resulted from the fact that the motivational symptom profile included cognitive symptoms (e.g. concentration problems and psychomotor retardation) that are likely to be associated with poorer cognitive performance. We found no association between poorer performance on the domain working memory and higher levels of depressive symptoms. Previous studies in populations with vascular disease showed changes in memory, executive functioning, and information processing speed, but not in working memory (Brands et al. Reference Brands, Van den Berg, Manschot, Biessels, Kappelle, De Haan and Kessels2007). Also, in patients with age-related diseases, such as Alzheimer's disease, working memory is a cognitive function that is relatively long spared (Lezak et al. Reference Lezak, Howieson and Loring2004). The other domains that we measured (i.e. memory, executive functioning, and information processing speed) seem to be more sensitive to brain damage.
In this study poorer cognitive performance did not influence change in depressive symptoms over time. The temporal course of depressive symptoms associated with cognitive performance was relatively stable over the 7 years of follow-up. We expected that the patients with relatively poorer cognitive performance would show more fluctuations or perhaps an increase in depressive symptoms during follow-up measurements as found in another study (Vinkers et al. Reference Vinkers, Gussekloo, Stek, Westendorp and van der Mast2004), although others have found only very little change in depressive symptoms with cognitive decline prior to dementia onset (Wilson et al. Reference Wilson, Arnold, Beck, Bienias and Bennett2008, 2010). Another study within patients with clinically relevant depressive symptoms found that worse cognitive performance was associated with a chronic but not with a fluctuating course of depressive symptoms when compared with remission (Sanders et al. Reference Sanders, Bremmer, Comijs, Deeg, Lampe and Beekman2011). A possible explanation for the absence of change of depressive symptoms in our study could be that patients with poorer cognitive performance are less able to regulate their mood states and behavior, resulting in a consistent higher level of symptoms (Wilson et al. Reference Wilson, Arnold, Beck, Bienias and Bennett2008). To test this hypothesis it would be interesting to investigate to what extent different (mood regulating) brain structures influence the longer term course of depressive symptoms.
In summary, in this cohort of patients with a history of vascular disease, poorer cognitive performance in multiple domains was associated with a higher level of depressive symptoms over 7 years of follow-up. However, cognitive performance was not associated with change in depressive symptoms during follow-up.
Appendix. Members of the SMART Study Group of University Medical Center Utrecht
A. Algra, M.D., Ph.D., Julius Center for Health Sciences and Primary Care and Rudolf Magnus Institute for Neurosciences, Department of Neurology; P. A. Doevendans, M.D., Ph.D., Department of Cardiology; Y. van der Graaf, M.D., Ph.D., D. E. Grobbee, M.D., Ph.D., and G. E. H. M. Rutten, M.D., Ph.D., Julius Center for Health Sciences and Primary Care; L. J. Kappelle, M.D., Ph.D., Utrecht Stroke Center, Rudolf Magnus Institute of Neuroscience, Department of Neurology; W. P. Th. M. Mali, M.D., Ph.D., Department of Radiology; F. L. Moll, M.D., Ph.D., Department of Vascular Surgery; and F. L. J. Visseren, M.D., Ph.D., Department of Vascular Medicine.
Supplementary material
For supplementary material accompanying this paper visit http://dx.doi.org/10.1017/S0033291714002864.
Acknowledgements
Funding for this paper was part of a grant from the Netherlands Organization for Scientific Research-Medical Sciences (project No. 904-65-095). The research of M.I.G. is supported by VIDI grant from the Netherlands Organisation for Scientific Research (NWO: project No. 917-66-311). The Netherlands Organization for Scientific Research-Medical Sciences had no role in the design, data collection, data analyses and data interpretation of the study or writing of the report.
Declaration of Interest
None.


