


Introduction
Major depressive disorder (MDD) is one of the most frequent and disabling psychiatric diseases worldwide (Murray et al., Reference Murray, Vos, Lozano, Naghavi, Flaxman, Michaud and Lopez2012; Wittchen & Jacobi, Reference Wittchen and Jacobi2005). Owing to the high constraints on life quality, suicide rates and the economic burden caused by MDD (Murray et al., Reference Murray, Vos, Lozano, Naghavi, Flaxman, Michaud and Lopez2012; Wittchen & Jacobi, Reference Wittchen and Jacobi2005), there is a particular need for further research on effective treatments. Antidepressive pharmacotherapy (AD) and cognitive behavioural therapy (CBT) as monotherapy or combination therapy are evidence-based effective treatments for MDD [American Psychiatric Association (APA), 2010]. However, around a third to a half of the patients suffering from MDD does not benefit from AD and/or CBT (Gaynes et al., Reference Gaynes, Warden, Trivedi, Wisniewski, Fava and Rush2009; Rush et al., Reference Rush, Trivedi, Wisniewski, Nierenberg, Stewart, Warden and Fava2006; Warden, Rush, Trivedi, Fava, & Wisniewski, Reference Warden, Rush, Trivedi, Fava and Wisniewski2007). In treatment-resistant MDD, electroconvulsive therapy (ECT) is a highly successful alternative approach with remission rates of 60–80% (Haq, Sitzmann, Goldman, Maixner, & Mickey, Reference Haq, Sitzmann, Goldman, Maixner and Mickey2015). Despite the widespread evidence for efficacy, many patients experience an unfavourable and chronic course of the disease.
In the past decade, neuroimaging studies have provided insights into brain structural alterations in MDD, especially within the limbic-cortical brain circuit. Reductions of grey matter volume (GMV) in emotion-processing areas such as the hippocampus, anterior cingulate cortex (ACC), dorsolateral prefrontal cortex and basal ganglia are among the most consistent findings (Arnone, McIntosh, Ebmeier, Munafò, & Anderson, Reference Arnone, McIntosh, Ebmeier, Munafò and Anderson2012; Bora, Fornito, Pantelis, & Yücel, Reference Bora, Fornito, Pantelis and Yücel2012; Koolschijn, van Haren, Lensvelt-Mulders, Hulshoff Pol, & Kahn, Reference Koolschijn, van Haren, Lensvelt-Mulders, Hulshoff Pol and Kahn2009; Schmaal et al., Reference Schmaal, Hibar, Sämann, Hall, Baune, Jahanshad and Veltman2017). In order to provide a better understanding of the neural mechanisms and side effects of antidepressive treatments, a large body of neuroimaging studies also examined treatment-related effects on brain structure and biomarkers associated with response. Machine learning approaches even examined whether treatment response or non-response could be predicted on the individual patient level. Such information about neural treatment mechanisms and predictive biomarkers could in future improve treatment decisions made by clinicians. With our review, we aim to provide a systematic overview of the existing evidence regarding key brain regions affected by AD, ECT or CBT as well as brain biomarkers associated with treatment response.
Changes after treatments
Every (effective) treatment with AD, ECT or CBT is supposed to lead to brain structural changes. By the regulation of depression-associated alterations in neurotransmitter systems, AD induces changes in synaptic transmission, post-synaptic transcription processes and growth factors and finally stimulates neurogenesis (Willner, Scheel-Krüger, & Belzung, Reference Willner, Scheel-Krüger and Belzung2013). The process of neurogenesis conveyed by AD has been reported to be crucial for the antidepressant action: New neurons in the hippocampus are supposed to re-establish the dysregulation of the HPA axis activity, finally regulating the stress response and reducing negative affect reactivity (Surget et al., Reference Surget, Tanti, Leonardo, Laugeray, Rainer, Touma and Belzung2011). For ECT response, two mechanisms have been hypothesized to be relevant: Anticonvulsant effects have been supposed to enable an immediate response, while increased expression of neurotrophic factors initiating brain structural and functional changes has been reported to mediate sustained remission (Abbott, Gallegos, Rediske, Lemke, & Quinn, Reference Abbott, Gallegos, Rediske, Lemke and Quinn2014). The principal targets of CBT are the identification and modification of dysfunctional cognitions and behaviours (Beck, Rush, Shaw, & Emery, Reference Beck, Rush, Shaw and Emery1979). For a successful process in CBT, learning new cognitive and behavioural strategies, especially regarding emotional regulation and reappraisal, is a core requirement. As learning processes in general are accompanied by changes in brain structure (Draganski et al., Reference Draganski, Gaser, Kempermann, Kuhn, Winkler, Buchel and May2006), a successful CBT should go along with GMV changes within the brain.
Existing reviews or meta-analyses focus either on changes in brain structure after ECT (Gbyl & Videbech, Reference Gbyl and Videbech2018; Takamiya et al., Reference Takamiya, Plitman, Chung, Chakravarty, Graff-Guerrero, Mimura and Kishimoto2019; Wilkinson, Sanacora, & Bloch, Reference Wilkinson, Sanacora and Bloch2017; Yrondi, Péran, Sauvaget, Schmitt, & Arbus, Reference Yrondi, Péran, Sauvaget, Schmitt and Arbus2018) or on changes in brain function after AD or psychotherapy (Atkinson, Sankar, Adams, & Fu, Reference Atkinson, Sankar, Adams and Fu2014; Delaveau et al., Reference Delaveau, Jabourian, Lemogne, Guionnet, Bergouignan and Fossati2011; Roiser, Elliott, & Sahakian, Reference Roiser, Elliott and Sahakian2012). However, there is no review that comprehensively summarizes and compares the effects of AD, ECT and CBT on grey matter.
Predictive biomarkers
Indications for a specific treatment are mainly based on clinical characteristics such as depression severity and subtype, former treatment response, comorbid disorders or psychosocial stressors, as well as individual factors such as patient preference or anticipated tolerability of side effects of the treatment [American Psychiatric Association (APA), 2010]. As different treatments are supposed to act by diverging neural mechanisms, individual differences in brain structure might explain variations in treatment response. Pre-treatment biomarkers could serve as objective and reliable predictors of response that improve informed decisions for adequate interventions. Previous meta-analyses and reviews that focus on functional neuroimaging studies reported differences between responders on AD and psychotherapy in brain function during emotional processing (Franklin, Carson, & Welch, Reference Franklin, Carson and Welch2016; Phillips et al., Reference Phillips, Chase, Sheline, Etkin, Almeida, Deckersbach and Trivedi2015b; Pizzagalli, Reference Pizzagalli2011; Roiser et al., Reference Roiser, Elliott and Sahakian2012). However, with regard to the application of pre-treatment biomarkers in clinical practice, there are several advantages of structural neuroimaging compared to functional magnetic resonance imaging (fMRI): (a) structural neuroimaging has a higher test–retest reliability and is more robust against differences in scanner, sequence and physiological state of the subject (Bennett & Miller, Reference Bennett and Miller2010; Iscan et al., Reference Iscan, Jin, Kendrick, Szeglin, Lu, Trivedi and Delorenzo2015; Wonderlick et al., Reference Wonderlick, Ziegler, Hosseini-Varnamkhasti, Locascio, Bakkour, van der Kouwe and Dickerson2009), (b) structural neuroimaging is already part of the clinical diagnosis and treatment selection process in several psychiatric hospitals and so is applicable in clinical practice, and (c) for structural neuroimaging, no paradigm or task is required so that it is easier to implement than fMRI measurements. There is no review summarizing studies of pre-treatment GMV biomarkers associated with response on AD, ECT and CBT. An increasing number of neuroimaging studies further applies innovative methods such as machine learning in order to enable predictions of clinical response on individual pre-treatment brain data. As these approaches have a high potential for the translation in clinical practice, we additionally challenge this point in our review. The aim of the present review is to provide a systematic overview of the state-of-the-art of neuroimaging studies investigating
(1) Longitudinal effects of AD, ECT and CBT on GMV
(2) Pre-treatment GMV biomarkers associated with a response on AD, ECT or CBT
(3) The accuracy of individual predictions of response on AD, ECT or CBT by machine learning on pre-treatment grey matter data
Methods
This systematic review was conducted and reported according to the Preferred Reporting Items for Systematic Reviews and Meta-Analyses (PRISMA) statement (Liberati et al., Reference Liberati, Altman, Tetzlaff, Mulrow, Gøtzsche, Ioannidis and Moher2009; Moher, Liberati, Tetzlaff, & Altman, Reference Moher, Liberati, Tetzlaff and Altman2009). The study selection process is illustrated in Fig. 1.
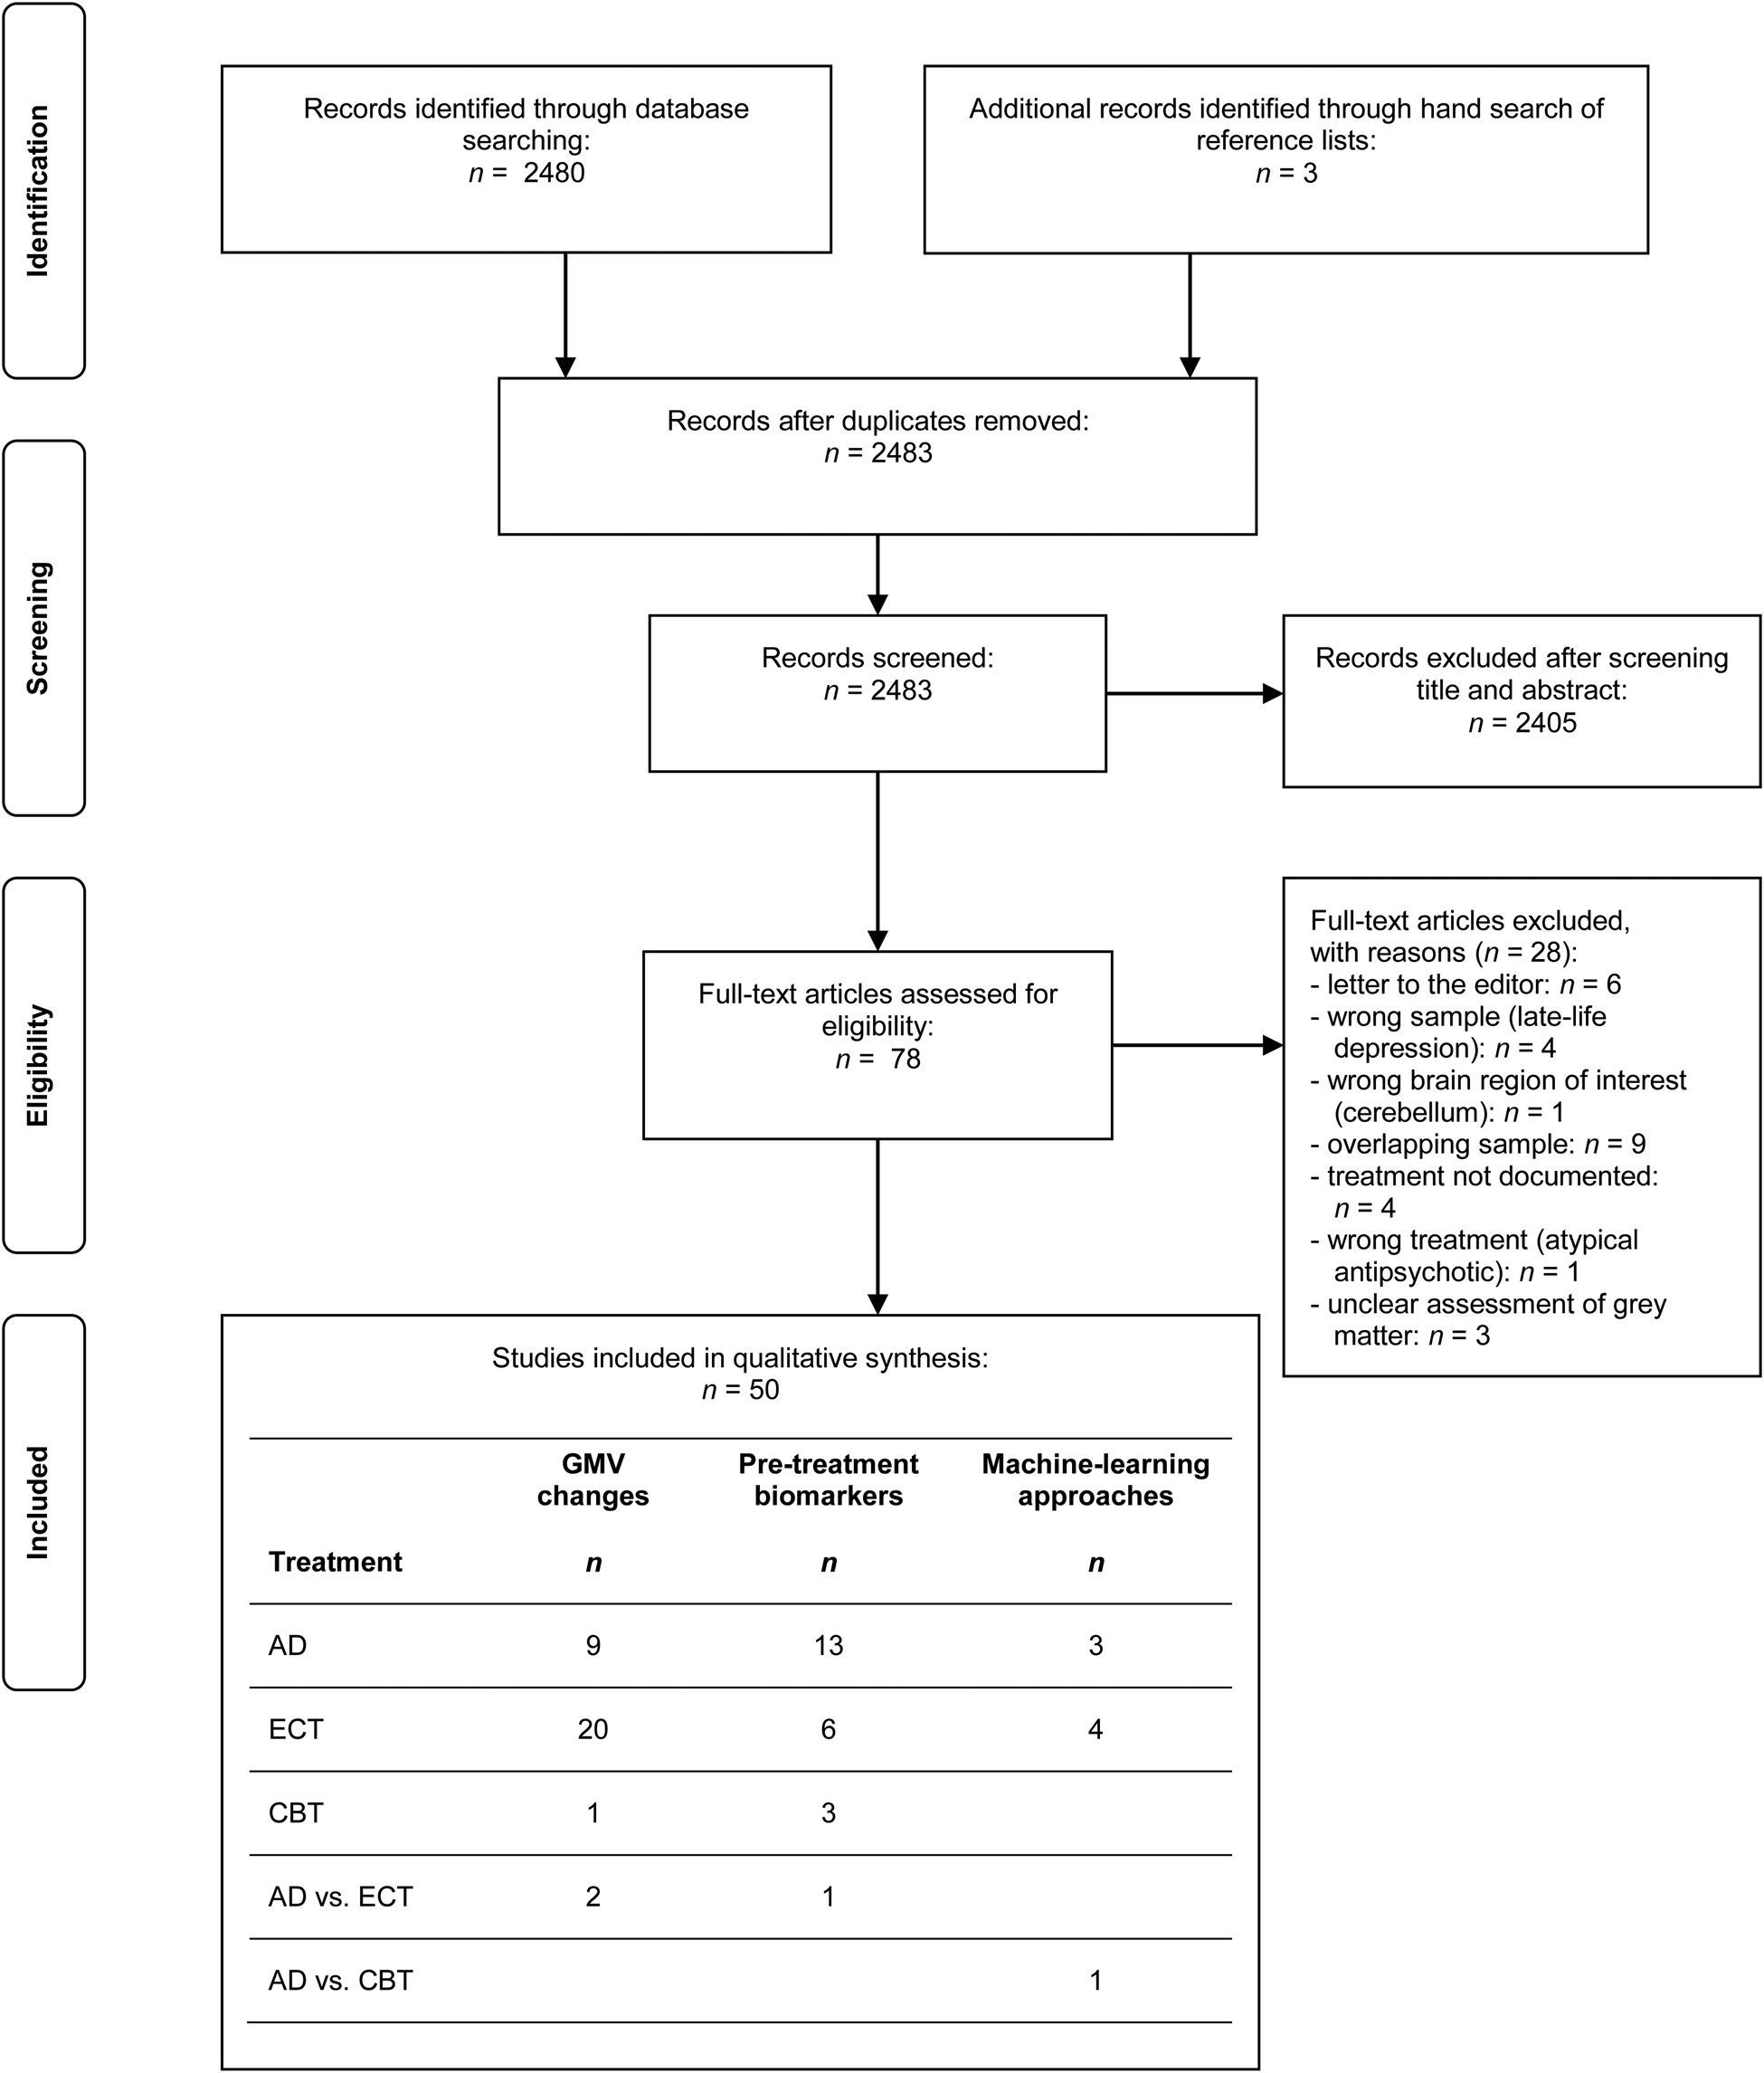
Fig. 1. PRISMA flow diagram of the study selection process. Within the table of the included studies, multiple entries per study are possible (e.g. if a study investigated not only grey matter volume changes but also pre-treatment biomarkers and/or machine learning approaches). AD, antidepressant medication; CBT, cognitive behavioural therapy; ECT, electroconvulsive therapy; GMV, grey matter volume.
Sources of data and search strategy
A systematic database research on PubMed was conducted using the terms ‘depressive disorder’ OR ‘depression’ AND ‘magnetic resonance imaging’ OR ‘mri’ AND ‘therapy’ OR ‘therapeutics’. The research focused on original articles published before 18 February 2019. We further examined the reference lists of all studies meeting our inclusion criteria to find relevant studies not directly identified by the search terms.
Eligibility criteria
We included studies meeting the following eligibility criteria according to the PICOS approach (Liberati et al., Reference Liberati, Altman, Tetzlaff, Mulrow, Gøtzsche, Ioannidis and Moher2009):
Participants
Only human studies of adult participants were included either suffering from an acute major depressive episode or showing subthreshold symptoms of depression. Studies including a sample with bipolar disorder in addition to the MDD sample were included. However, studies only investigating patients with bipolar depression were excluded in order to reduce sample heterogeneity due to systematic differences in diagnosis. We further excluded studies solely investigating a geriatric sample or solely participants exhibiting late-life depression because brain morphological correlates of late-life depression have been described to differ from those in early-onset depression (Bora et al., Reference Bora, Fornito, Pantelis and Yücel2012).
Intervention
Studies describing a documented treatment between baseline and follow-up investigation with AD, ECT or CBT were included. Randomization to treatment was not required for study inclusion. Studies were also included if concomitant treatments were allowed.
Comparison
Control comparison groups were not required for inclusion in our review.
Outcomes
Regarding the first objective, studies were included if changes in whole brain cerebrum or region of interest (ROI) volume, thickness or surface of grey matter were assessed using structural magnetic resonance imaging (MRI) before and after treatment with AD, ECT or CBT. Inclusion criteria for our second objective were an MRI assessment of GMV, thickness or surface before treatment as well as the measure of clinical symptom severity, either by self- or clinical rating, before and after treatment with AD, ECT or CBT. Studies were included if they either reported the results of the association of pre-treatment brain morphological biomarkers with a clinical response or the difference in pre-treatment grey matter between responders and non-responders. With respect to the third objective, studies were included if they reported the accuracy of the prediction of response on the individual patient level based on machine learning approaches on pre-treatment grey matter data.
Study selection and data collection procedure
The first author initially screened the search results by titles and abstracts and then checked relevant full-text articles for eligibility criteria. Studies investigating completely overlapping samples were excluded from the review. In order to examine the reliability of the eligibility process, the second author rated 20% (n = 16) of the potentially suitable records. Interrater reliability was substantial, with κ = 0.86. Differing judgements were resolved by consensus. The relevant data were extracted regarding demographic and clinical characteristics of the samples (e.g. depression severity), study designs (e.g. pre-post interval, treatment type, etc.), parameters of MRI assessment and pre-processing as well as investigated ROIs.
Results
The query revealed 2480 results. We finally included 50 studies in our systematic review investigating GMV changes, pre-treatment biomarkers, both or applying machine learning for the individual prediction of response.
Characteristics of included studies
An overview of the sample and treatment characteristics of the included studies is provided in Table 1. Patient groups fulfilled the criteria of acute major depressive episode at baseline with the exception of one study investigating participants with subthreshold depressive symptoms (Du, Mao, Zhang, Luo, & Qiu, Reference Du, Mao, Zhang, Luo and Qiu2016). Depression severity at baseline and follow-up was either assessed by Hamilton Depression Rating Scale (HDRS-17 or HDRS-21), Montgomery–Åsberg Depression Rating Scale (MADRS), Beck Depression Inventory (BDI), Yale Depression Inventory (YDI) or Quick Inventory of Depressive Symptomatology (QIDS). Response at follow-up was usually defined as depressive symptom relief of at least 50% reduction in depressive mode scale compared to baseline.
Table 1. Sample characteristics and study design of included studies

AD, antidepressive pharmacotherapy; BDI, Beck Depression Inventory; BIF, bifrontal stimulation; BIL, bilateral stimulation; BIO, study investigating pre-treatment GMV biomarkers associated with treatment response; BIT, bitemporal stimulation; CBT, cognitive behavioural therapy; EA, electroacupuncture; ECT, electroconvulsive therapy; HC, healthy controls; HDRS, Hamilton Depression Rating Scale; LART, left anterior right temporal; LONG, longitudinal study (pre and post-treatment MRI) investigating GMV changes after treatment; MADRS, Montgomery–Åsberg Depression Rating Scale; MDD, major depressive disorder; MDE, major depressive episode; ML, study implementing machine learning for individual prediction of treatment response; QIDS, Quick Inventory of Depressive Symptomatology; RUL, right unilateral stimulation; SNRI, serotonin-norepinephrine reuptake inhibitor; SSRI, selective serotonin reuptake inhibitor; TC, test cohort; TCA, tricyclic antidepressant; VC, validation cohort; YDI, Yale Depression Inventory.
a Refers to patient sample.
b Not reported for final sample.
c Multicentre study implementing three different samples. Here, the sample characteristics of the three samples will be reported separately (S1 = sample 1, S2 = sample 2, S3 = sample 3). S2 partly overlaps with the samples of Joshi et al. (Reference Joshi, Espinoza, Pirnia, Shi, Wang, Ayers and Narr2016), Pirnia et al. (Reference Pirnia, Joshi, Leaver, Vasavada, Njau, Woods and Narr2016), Wade et al. (Reference Wade, Joshi, Njau, Leaver, Vasavada, Woods and Narr2016).
d Partly overlapping samples of Joshi et al. (Reference Joshi, Espinoza, Pirnia, Shi, Wang, Ayers and Narr2016), Pirnia et al. (Reference Pirnia, Joshi, Leaver, Vasavada, Njau, Woods and Narr2016), Wade et al. (Reference Wade, Joshi, Njau, Leaver, Vasavada, Woods and Narr2016).
e Multicentre study implementing data from 10 sites. Amongst others this study includes overlapping samples of the following studies included in the review: Dukart et al. (Reference Dukart, Regen, Kherif, Colla, Bajbouj, Heuser and Draganski2014), Nordanskog et al. (Reference Nordanskog, Larsson, Larsson and Johanson2014), Jorgensen et al. (Reference Jorgensen, Magnusson, Hanson, Kirkegaard, Benveniste, Lee and Jorgensen2016), Joshi et al. (Reference Joshi, Espinoza, Pirnia, Shi, Wang, Ayers and Narr2016), Redlich et al. (Reference Redlich, Opel, Grotegerd, Dohm, Zaremba, Bürger and Dannlowski2016), van Eijndhoven et al. (Reference van Eijndhoven, Mulders, Kwekkeboom, van Oostrom, van Beek, Janzing and Tendolkar2016).
f Partly overlapping samples of Tendolkar et al. (Reference Tendolkar, van Beek, van Oostrom, Mulder, Janzing, Voshaar and van Eijndhoven2013), van Oostrom et al. (Reference van Oostrom, van Eijndhoven, Butterbrod, van Beek, Janzig, Donders and Tendolkar2018).
A summary of study characteristics regarding MRI assessment and pre-processing is given in Table 2. The majority of the studies investigated the grey matter on the whole brain level (n = 31). Most frequent a priori ROIs were the hippocampus/parahippocampal gyrus (n = 26), the amygdala (n = 13), parts of the ACC (n = 10) and of the PFC (n = 9).
Table 2. MRI procedures of included studies

AD, antidepressive pharmacotherapy; ACC, anterior cingulate cortex; BIO, study investigating pre-treatment GMV biomarkers associated with treatment response; CBT, cognitive behavioural therapy; ECT, electroconvulsive therapy; FSL, FMRIB Software Library; GMV, grey matter volume; LONG, longitudinal study (pre and post-treatment MRI) investigating GMV changes after treatment; ML, study implementing machine learning for individual prediction of treatment response; OFC, orbitofrontal cortex; PFC, prefrontal cortex; Quarc, Quantitative anatomical regional change; ROI, region of interest; SACHA, Segmentation Automatique Compétitive de l'Hippocampe et de l'amygdale in BrainVISA; SBM, source-based morphometry; SPM, Statistical Parametric Mapping; T, Tesla; VBM, voxel-based morphometry; VBCT, voxel-based cortical thickness.
aMulticentre study. Samples were assessed at different sites and different scanners.
Longitudinal GMV changes
Figure 2 and Table 3 provide an overview of the evidence of cortical and subcortical GMV changes reported by the included studies.

Fig. 2. Cortical and subcortical grey matter volume (GMV) changes described after different treatments. For areas in light grey, GMV increases were reported while for regions in dark grey, GMV reductions were reported by the respective studies: (a) GMV changes after treatment with antidepressant medication (AD). 1: Dorsolateral prefrontal cortex (Smith, Chen, Baxter, Fort, & Lane, Reference Smith, Chen, Baxter, Fort and Lane2014), 2: middle frontal gyrus (Dukart et al., Reference Dukart, Regen, Kherif, Colla, Bajbouj, Heuser and Draganski2014), 3: inferior frontal gyrus (Dukart et al., Reference Dukart, Regen, Kherif, Colla, Bajbouj, Heuser and Draganski2014), 4: hippocampus (Arnone et al., Reference Arnone, McKie, Elliott, Juhasz, Thomas, Downey and Anderson2013; Schermuly et al., Reference Schermuly, Wolf, Lieb, Stoeter and Fellgiebel2011). (b) GMV changes after treatment with electroconvulsive therapy (ECT). 1: Dorsolateral prefrontal cortex (Jorgensen et al., Reference Jorgensen, Magnusson, Hanson, Kirkegaard, Benveniste, Lee and Jorgensen2016), 2: supplementary motor cortex (Jiang et al., Reference Jiang, Abbott, Jiang, Du, Espinoza, Narr and Calhoun2018), 3: premotor region (Dukart et al., Reference Dukart, Regen, Kherif, Colla, Bajbouj, Heuser and Draganski2014), 4: middle frontal gyrus (Dukart et al., Reference Dukart, Regen, Kherif, Colla, Bajbouj, Heuser and Draganski2014), 5: inferior frontal gyrus (Dukart et al., Reference Dukart, Regen, Kherif, Colla, Bajbouj, Heuser and Draganski2014), 6: orbitofrontal cortex (Jorgensen et al., Reference Jorgensen, Magnusson, Hanson, Kirkegaard, Benveniste, Lee and Jorgensen2016), 7: insula (Cano et al., Reference Cano, Lee, Cardoner, Martínez-Zalacaín, Pujol, Makris and Camprodon2018; Dukart et al., Reference Dukart, Regen, Kherif, Colla, Bajbouj, Heuser and Draganski2014; Gryglewski et al., Reference Gryglewski, Baldinger-Melich, Seiger, Godbersen, Michenthaler, Klöbl and Frey2019; Sartorius et al., Reference Sartorius, Demirakca, Böhringer, Clemm von Hohenberg, Aksay, Bumb and Ende2016; Thomann et al., Reference Thomann, Wolf, Nolte, Hirjak, Hofer, Seidl and Wüstenberg2017; van Eijndhoven et al., Reference van Eijndhoven, Mulders, Kwekkeboom, van Oostrom, van Beek, Janzing and Tendolkar2016), 8: postcentral gyrus (Gryglewski et al., Reference Gryglewski, Baldinger-Melich, Seiger, Godbersen, Michenthaler, Klöbl and Frey2019; Jiang et al., Reference Jiang, Abbott, Jiang, Du, Espinoza, Narr and Calhoun2018; Sartorius et al., Reference Sartorius, Demirakca, Böhringer, Clemm von Hohenberg, Aksay, Bumb and Ende2016), 9: superior temporal gyrus (Gryglewski et al., Reference Gryglewski, Baldinger-Melich, Seiger, Godbersen, Michenthaler, Klöbl and Frey2019; Pirnia et al., Reference Pirnia, Joshi, Leaver, Vasavada, Njau, Woods and Narr2016; van Eijndhoven et al., Reference van Eijndhoven, Mulders, Kwekkeboom, van Oostrom, van Beek, Janzing and Tendolkar2016), 10: middle temporal gyrus (Sartorius et al., Reference Sartorius, Demirakca, Böhringer, Clemm von Hohenberg, Aksay, Bumb and Ende2016; van Eijndhoven et al., Reference van Eijndhoven, Mulders, Kwekkeboom, van Oostrom, van Beek, Janzing and Tendolkar2016), 11: inferior temporal gyrus (Gryglewski et al., Reference Gryglewski, Baldinger-Melich, Seiger, Godbersen, Michenthaler, Klöbl and Frey2019; Ota et al., Reference Ota, Noda, Sato, Okazaki, Ishikawa, Hattori and Kunugi2015; Pirnia et al., Reference Pirnia, Joshi, Leaver, Vasavada, Njau, Woods and Narr2016; Sartorius et al., Reference Sartorius, Demirakca, Böhringer, Clemm von Hohenberg, Aksay, Bumb and Ende2016; van Eijndhoven et al., Reference van Eijndhoven, Mulders, Kwekkeboom, van Oostrom, van Beek, Janzing and Tendolkar2016), 12: temporal pole (Gryglewski et al., Reference Gryglewski, Baldinger-Melich, Seiger, Godbersen, Michenthaler, Klöbl and Frey2019; Pirnia et al., Reference Pirnia, Joshi, Leaver, Vasavada, Njau, Woods and Narr2016; Sartorius et al., Reference Sartorius, Demirakca, Böhringer, Clemm von Hohenberg, Aksay, Bumb and Ende2016; van Eijndhoven et al., Reference van Eijndhoven, Mulders, Kwekkeboom, van Oostrom, van Beek, Janzing and Tendolkar2016), 13: subgenual ACC (Dukart et al., Reference Dukart, Regen, Kherif, Colla, Bajbouj, Heuser and Draganski2014; Ota et al., Reference Ota, Noda, Sato, Okazaki, Ishikawa, Hattori and Kunugi2015), 14: rostral ACC (Cano et al., Reference Cano, Lee, Cardoner, Martínez-Zalacaín, Pujol, Makris and Camprodon2018; Ota et al., Reference Ota, Noda, Sato, Okazaki, Ishikawa, Hattori and Kunugi2015), 15: dorsal ACC (Ota et al., Reference Ota, Noda, Sato, Okazaki, Ishikawa, Hattori and Kunugi2015; Pirnia et al., Reference Pirnia, Joshi, Leaver, Vasavada, Njau, Woods and Narr2016), 16: basal ganglia: putamen, nucleus accumbens, caudate nucleus, habenula (Cano et al., Reference Cano, Lee, Cardoner, Martínez-Zalacaín, Pujol, Makris and Camprodon2018; Gryglewski et al., Reference Gryglewski, Baldinger-Melich, Seiger, Godbersen, Michenthaler, Klöbl and Frey2019; Sartorius et al., Reference Sartorius, Demirakca, Böhringer, Clemm von Hohenberg, Aksay, Bumb and Ende2016; Wade et al., Reference Wade, Joshi, Njau, Leaver, Vasavada, Woods and Narr2016), 17: amygdala (Cano et al., Reference Cano, Lee, Cardoner, Martínez-Zalacaín, Pujol, Makris and Camprodon2018; Dukart et al., Reference Dukart, Regen, Kherif, Colla, Bajbouj, Heuser and Draganski2014; Gryglewski et al., Reference Gryglewski, Baldinger-Melich, Seiger, Godbersen, Michenthaler, Klöbl and Frey2019; Jorgensen et al., Reference Jorgensen, Magnusson, Hanson, Kirkegaard, Benveniste, Lee and Jorgensen2016; Joshi et al., Reference Joshi, Espinoza, Pirnia, Shi, Wang, Ayers and Narr2016; Ota et al., Reference Ota, Noda, Sato, Okazaki, Ishikawa, Hattori and Kunugi2015; Qiu et al., Reference Qiu, Li, Zhao, Du, Huang, Fu and Luo2016; Sartorius et al., Reference Sartorius, Demirakca, Böhringer, Clemm von Hohenberg, Aksay, Bumb and Ende2016; Tendolkar et al., Reference Tendolkar, van Beek, van Oostrom, Mulder, Janzing, Voshaar and van Eijndhoven2013; Thomann et al., Reference Thomann, Wolf, Nolte, Hirjak, Hofer, Seidl and Wüstenberg2017), 18: hippocampus (Cano et al., Reference Cano, Lee, Cardoner, Martínez-Zalacaín, Pujol, Makris and Camprodon2018; Cao et al., Reference Cao, Luo, Fu, Du, Qiu, Yang and Qiu2018; Dukart et al., Reference Dukart, Regen, Kherif, Colla, Bajbouj, Heuser and Draganski2014; Gryglewski et al., Reference Gryglewski, Baldinger-Melich, Seiger, Godbersen, Michenthaler, Klöbl and Frey2019; Jorgensen et al., Reference Jorgensen, Magnusson, Hanson, Kirkegaard, Benveniste, Lee and Jorgensen2016; Joshi et al., Reference Joshi, Espinoza, Pirnia, Shi, Wang, Ayers and Narr2016; Nordanskog et al., Reference Nordanskog, Larsson, Larsson and Johanson2014; Ota et al., Reference Ota, Noda, Sato, Okazaki, Ishikawa, Hattori and Kunugi2015; Qiu et al., Reference Qiu, Li, Zhao, Du, Huang, Fu and Luo2016; Redlich et al., Reference Redlich, Opel, Grotegerd, Dohm, Zaremba, Bürger and Dannlowski2016; Sartorius et al., Reference Sartorius, Demirakca, Böhringer, Clemm von Hohenberg, Aksay, Bumb and Ende2016; Tendolkar et al., Reference Tendolkar, van Beek, van Oostrom, Mulder, Janzing, Voshaar and van Eijndhoven2013; Thomann et al., Reference Thomann, Wolf, Nolte, Hirjak, Hofer, Seidl and Wüstenberg2017; van Oostrom et al., Reference van Oostrom, van Eijndhoven, Butterbrod, van Beek, Janzig, Donders and Tendolkar2018; Wolf et al., Reference Wolf, Nolte, Hirjak, Hofer, Seidl, Depping and Thomann2016), 19: parahippocampal gyrus (Jiang et al., Reference Jiang, Abbott, Jiang, Du, Espinoza, Narr and Calhoun2018; Pirnia et al., Reference Pirnia, Joshi, Leaver, Vasavada, Njau, Woods and Narr2016; Wolf et al., Reference Wolf, Nolte, Hirjak, Hofer, Seidl, Depping and Thomann2016), 20: fusiform gyrus (Gryglewski et al., Reference Gryglewski, Baldinger-Melich, Seiger, Godbersen, Michenthaler, Klöbl and Frey2019; Pirnia et al., Reference Pirnia, Joshi, Leaver, Vasavada, Njau, Woods and Narr2016; Sartorius et al., Reference Sartorius, Demirakca, Böhringer, Clemm von Hohenberg, Aksay, Bumb and Ende2016), 21: inferior temporal gyrus (Gryglewski et al., Reference Gryglewski, Baldinger-Melich, Seiger, Godbersen, Michenthaler, Klöbl and Frey2019; Ota et al., Reference Ota, Noda, Sato, Okazaki, Ishikawa, Hattori and Kunugi2015; Pirnia et al., Reference Pirnia, Joshi, Leaver, Vasavada, Njau, Woods and Narr2016; van Eijndhoven et al., Reference van Eijndhoven, Mulders, Kwekkeboom, van Oostrom, van Beek, Janzing and Tendolkar2016). (c) GMV changes after cognitive behavioural therapy (CBT). 1: Middle frontal gyrus (Du et al., Reference Du, Mao, Zhang, Luo and Qiu2016), 2: postcentral gyrus (Du et al., Reference Du, Mao, Zhang, Luo and Qiu2016).
Table 3. Strength of evidence: changes in grey matter volume after treatments

ACC, anterior cingulate cortex; DLPFC, dorsolateral prefrontal cortex; PFC, prefrontal cortex; ROI, region of interest; pre, time point before treatment; post, time point after treatment.
a Lai and Hsu (Reference Lai and Hsu2011): volume increases in the inferior frontal cortex and occipital fusiform gyrus were non-significant after correction for multiple comparisons.
b Wade et al. (Reference Wade, Joshi, Njau, Leaver, Vasavada, Woods and Narr2016): increases in nucleus accumbens volume only in responders (no change in non-responders).
GMV changes after AD intake
Four out of 11 studies reported significant changes in the grey matter after AD (see Table 3). Two out of five studies that investigated hippocampal volume changes within a ROI analysis reported significant increases in hippocampal GMV (Arnone et al., Reference Arnone, McKie, Elliott, Juhasz, Thomas, Downey and Anderson2013; Schermuly, Wolf, Lieb, Stoeter, & Fellgiebel, Reference Schermuly, Wolf, Lieb, Stoeter and Fellgiebel2011). One study reported diverging effects between treatment responders and non-responders with slight (non-significant) hippocampal GMV increases in the responder group, while non-responders tended to show a reduction of hippocampal GMV after treatment (Phillips, Batten, Tremblay, Aldosary, & Blier, Reference Phillips, Batten, Tremblay, Aldosary and Blier2015a). Within the temporal cortex or the ACC, none of the studies reported significant volume changes after treatment with AD (Dukart et al., Reference Dukart, Regen, Kherif, Colla, Bajbouj, Heuser and Draganski2014; Fu et al., Reference Fu, Costafreda, Sankar, Adams, Rasenick, Liu and Marangell2015; Phillips et al., Reference Phillips, Batten, Tremblay, Aldosary and Blier2015a; Vythilingam et al., Reference Vythilingam, Vermetten, Anderson, Luckenbaugh, Anderson, Snow and Bremner2004). For the prefrontal cortex, one study reported volume increases (Dukart et al., Reference Dukart, Regen, Kherif, Colla, Bajbouj, Heuser and Draganski2014), while another study showed volume reductions after sertraline treatment in association with clinical response (Smith, Chen, Baxter, Fort, & Lane, Reference Smith, Chen, Baxter, Fort and Lane2013, Reference Smith, Chen, Baxter, Fort and Lane2014). A third study reported a response × time interaction resulting from a tendency for volume increases within the responder group, while non-responders showed a slight reduction of prefrontal volume (Phillips et al., Reference Phillips, Batten, Tremblay, Aldosary and Blier2015a).
GMV changes after ECT
Twenty out of the 22 studies revealed significant volume increases, while two studies did not report any changes in GMV after ECT (Coffey et al., Reference Coffey, Weiner, Djang, Figiel, Soady, Patterson and Wilkinson1991; Nickl-Jockschat et al., Reference Nickl-Jockschat, Palomero Gallagher, Kumar, Hoffstaedter, Brügmann, Habel and Grözinger2016). The most consistent evidence of volume increases has been shown for the hippocampus–amygdala complex revealed by 18 studies (Cano et al., Reference Cano, Lee, Cardoner, Martínez-Zalacaín, Pujol, Makris and Camprodon2018; Cao et al., Reference Cao, Luo, Fu, Du, Qiu, Yang and Qiu2018; Dukart et al., Reference Dukart, Regen, Kherif, Colla, Bajbouj, Heuser and Draganski2014; Gryglewski et al., Reference Gryglewski, Baldinger-Melich, Seiger, Godbersen, Michenthaler, Klöbl and Frey2019; Jiang et al., Reference Jiang, Abbott, Jiang, Du, Espinoza, Narr and Calhoun2018; Jorgensen et al., Reference Jorgensen, Magnusson, Hanson, Kirkegaard, Benveniste, Lee and Jorgensen2016; Joshi et al., Reference Joshi, Espinoza, Pirnia, Shi, Wang, Ayers and Narr2016; Nordanskog, Larsson, Larsson, & Johanson, Reference Nordanskog, Larsson, Larsson and Johanson2014; Oltedal et al., Reference Oltedal, Narr, Abbott, Anand, Argyelan, Bartsch and Dale2018; Ota et al., Reference Ota, Noda, Sato, Okazaki, Ishikawa, Hattori and Kunugi2015; Pirnia et al., Reference Pirnia, Joshi, Leaver, Vasavada, Njau, Woods and Narr2016; Qiu et al., Reference Qiu, Li, Zhao, Du, Huang, Fu and Luo2016; Redlich et al., Reference Redlich, Opel, Grotegerd, Dohm, Zaremba, Bürger and Dannlowski2016; Sartorius et al., Reference Sartorius, Demirakca, Böhringer, Clemm von Hohenberg, Aksay, Bumb and Ende2016; Tendolkar et al., Reference Tendolkar, van Beek, van Oostrom, Mulder, Janzing, Voshaar and van Eijndhoven2013; Thomann et al., Reference Thomann, Wolf, Nolte, Hirjak, Hofer, Seidl and Wüstenberg2017; van Oostrom et al., Reference van Oostrom, van Eijndhoven, Butterbrod, van Beek, Janzig, Donders and Tendolkar2018; Wolf et al., Reference Wolf, Nolte, Hirjak, Hofer, Seidl, Depping and Thomann2016). One study investigating long-term GMV changes reported that these hippocampal volume increases declined to baseline after 6 months (Nordanskog et al., Reference Nordanskog, Larsson, Larsson and Johanson2014). The majority of the studies pointed out that the GMV increases of hippocampus–amygdala complex were not associated with clinical response (Jorgensen et al., Reference Jorgensen, Magnusson, Hanson, Kirkegaard, Benveniste, Lee and Jorgensen2016; Nordanskog et al., Reference Nordanskog, Larsson, Larsson and Johanson2014; Oltedal et al., Reference Oltedal, Narr, Abbott, Anand, Argyelan, Bartsch and Dale2018; Ota et al., Reference Ota, Noda, Sato, Okazaki, Ishikawa, Hattori and Kunugi2015; Pirnia et al., Reference Pirnia, Joshi, Leaver, Vasavada, Njau, Woods and Narr2016; Redlich et al., Reference Redlich, Opel, Grotegerd, Dohm, Zaremba, Bürger and Dannlowski2016; Sartorius et al., Reference Sartorius, Demirakca, Böhringer, Clemm von Hohenberg, Aksay, Bumb and Ende2016; Thomann et al., Reference Thomann, Wolf, Nolte, Hirjak, Hofer, Seidl and Wüstenberg2017; van Oostrom et al., Reference van Oostrom, van Eijndhoven, Butterbrod, van Beek, Janzig, Donders and Tendolkar2018; Wolf et al., Reference Wolf, Nolte, Hirjak, Hofer, Seidl, Depping and Thomann2016).
Furthermore, increases of GMV or cortical thickness for cortical temporal areas were found by eight studies (Cano et al., Reference Cano, Lee, Cardoner, Martínez-Zalacaín, Pujol, Makris and Camprodon2018; Gryglewski et al., Reference Gryglewski, Baldinger-Melich, Seiger, Godbersen, Michenthaler, Klöbl and Frey2019; Jiang et al., Reference Jiang, Abbott, Jiang, Du, Espinoza, Narr and Calhoun2018; Ota et al., Reference Ota, Noda, Sato, Okazaki, Ishikawa, Hattori and Kunugi2015; Pirnia et al., Reference Pirnia, Joshi, Leaver, Vasavada, Njau, Woods and Narr2016; Sartorius et al., Reference Sartorius, Demirakca, Böhringer, Clemm von Hohenberg, Aksay, Bumb and Ende2016; van Eijndhoven et al., Reference van Eijndhoven, Mulders, Kwekkeboom, van Oostrom, van Beek, Janzing and Tendolkar2016; Wolf et al., Reference Wolf, Nolte, Hirjak, Hofer, Seidl, Depping and Thomann2016), for the insula by seven studies (Cano et al., Reference Cano, Lee, Cardoner, Martínez-Zalacaín, Pujol, Makris and Camprodon2018; Dukart et al., Reference Dukart, Regen, Kherif, Colla, Bajbouj, Heuser and Draganski2014; Gryglewski et al., Reference Gryglewski, Baldinger-Melich, Seiger, Godbersen, Michenthaler, Klöbl and Frey2019; Jiang et al., Reference Jiang, Abbott, Jiang, Du, Espinoza, Narr and Calhoun2018; Sartorius et al., Reference Sartorius, Demirakca, Böhringer, Clemm von Hohenberg, Aksay, Bumb and Ende2016; Thomann et al., Reference Thomann, Wolf, Nolte, Hirjak, Hofer, Seidl and Wüstenberg2017; van Eijndhoven et al., Reference van Eijndhoven, Mulders, Kwekkeboom, van Oostrom, van Beek, Janzing and Tendolkar2016) and for the ACC by five studies (Cano et al., Reference Cano, Lee, Cardoner, Martínez-Zalacaín, Pujol, Makris and Camprodon2018; Dukart et al., Reference Dukart, Regen, Kherif, Colla, Bajbouj, Heuser and Draganski2014; Ota et al., Reference Ota, Noda, Sato, Okazaki, Ishikawa, Hattori and Kunugi2015; Pirnia et al., Reference Pirnia, Joshi, Leaver, Vasavada, Njau, Woods and Narr2016; Wolf et al., Reference Wolf, Nolte, Hirjak, Hofer, Seidl, Depping and Thomann2016). For the subgenual part of the ACC (sgACC), one study reported an association between volume increase and clinical response (Dukart et al., Reference Dukart, Regen, Kherif, Colla, Bajbouj, Heuser and Draganski2014). Further volume increases after ECT were reported by three studies, respectively, for striatal regions (Cano et al., Reference Cano, Lee, Cardoner, Martínez-Zalacaín, Pujol, Makris and Camprodon2018; Gryglewski et al., Reference Gryglewski, Baldinger-Melich, Seiger, Godbersen, Michenthaler, Klöbl and Frey2019; Wade et al., Reference Wade, Joshi, Njau, Leaver, Vasavada, Woods and Narr2016), for the postcentral gyrus (Gryglewski et al., Reference Gryglewski, Baldinger-Melich, Seiger, Godbersen, Michenthaler, Klöbl and Frey2019; Jiang et al., Reference Jiang, Abbott, Jiang, Du, Espinoza, Narr and Calhoun2018; Sartorius et al., Reference Sartorius, Demirakca, Böhringer, Clemm von Hohenberg, Aksay, Bumb and Ende2016) and for the fusiform gyrus (Gryglewski et al., Reference Gryglewski, Baldinger-Melich, Seiger, Godbersen, Michenthaler, Klöbl and Frey2019; Pirnia et al., Reference Pirnia, Joshi, Leaver, Vasavada, Njau, Woods and Narr2016; Sartorius et al., Reference Sartorius, Demirakca, Böhringer, Clemm von Hohenberg, Aksay, Bumb and Ende2016). Volume increases in the orbitofrontal cortex (Jorgensen et al., Reference Jorgensen, Magnusson, Hanson, Kirkegaard, Benveniste, Lee and Jorgensen2016) and in the supplementary motor cortex (Jiang et al., Reference Jiang, Abbott, Jiang, Du, Espinoza, Narr and Calhoun2018) were reported by one study, respectively.
Only 2 out of the 22 studies reported volume reductions after ECT. Reductions in GMV were mainly shown for the (dorsolateral) prefrontal cortex (Dukart et al., Reference Dukart, Regen, Kherif, Colla, Bajbouj, Heuser and Draganski2014; Jorgensen et al., Reference Jorgensen, Magnusson, Hanson, Kirkegaard, Benveniste, Lee and Jorgensen2016). However, reductions were found to decline four weeks after cessation of the ECT series (Jorgensen et al., Reference Jorgensen, Magnusson, Hanson, Kirkegaard, Benveniste, Lee and Jorgensen2016).
GMV changes after CBT
The only study investigating structural brain changes after CBT reported GMV increases of the middle frontal gyrus after four weeks of group CBT associated with clinical response in patients with a minor depression (Du et al., Reference Du, Mao, Zhang, Luo and Qiu2016). Volume reductions in the postcentral gyrus were reported to stand in a negative association with clinical response.
Pre-treatment GMV biomarkers of response
For an overview about the cortical and subcortical pre-treatment GMV biomarkers associated with clinical response, see Fig. 3 and Table 4.

Fig. 3. Cortical and subcortical pre-treatment grey matter volume (GMV) biomarkers associated with response to treatments. For areas in light grey, larger pre-treatment GMV has been described to be associated with treatment response, while for regions in dark grey, smaller pre-treatment GMV has been described to be associated with treatment response. (a) Pre-treatment GMV biomarkers associated with response to antidepressant medication (AD). 1: Dorsolateral prefrontal cortex (Chen et al., Reference Chen, Ridler, Suckling, Williams, Fu, Merlo-Pich and Bullmore2007; Li et al., Reference Li, Lin, Chou, Chen, Hsieh, Wu and Su2010), 2: middle frontal gyrus (Costafreda et al., Reference Costafreda, Chu, Ashburner and Fu2009; Korgaonkar et al., Reference Korgaonkar, Rekshan, Gordon, Rush, Williams, Blasey and Grieve2015; Liao et al., Reference Liao, Wang, Lu, Hung, Li, Lin and Wu2013), 3: inferior frontal gyrus (Liao et al., Reference Liao, Wang, Lu, Hung, Li, Lin and Wu2013), 4: orbitofrontal cortex (Chen et al., Reference Chen, Ridler, Suckling, Williams, Fu, Merlo-Pich and Bullmore2007), 5: insula (Chen et al., Reference Chen, Ridler, Suckling, Williams, Fu, Merlo-Pich and Bullmore2007), 6: precentral gyrus (Li et al., Reference Li, Lin, Chou, Chen, Hsieh, Wu and Su2010), 7: postcentral gyrus (Li et al., Reference Li, Lin, Chou, Chen, Hsieh, Wu and Su2010), 8: angular gyrus (Korgaonkar et al., Reference Korgaonkar, Rekshan, Gordon, Rush, Williams, Blasey and Grieve2015), 9: superior temporal gyrus (Sämann et al., Reference Sämann, Höhn, Chechko, Kloiber, Lucae, Ising and Czisch2013), 10: middle temporal gyrus (Li et al., Reference Li, Lin, Chou, Chen, Hsieh, Wu and Su2010; Sämann et al., Reference Sämann, Höhn, Chechko, Kloiber, Lucae, Ising and Czisch2013), 11: inferior temporal gyrus (Li et al., Reference Li, Lin, Chou, Chen, Hsieh, Wu and Su2010), 12: occipital cortex (Chen et al., Reference Chen, Ridler, Suckling, Williams, Fu, Merlo-Pich and Bullmore2007), 13: subgenual ACC (Chen et al., Reference Chen, Ridler, Suckling, Williams, Fu, Merlo-Pich and Bullmore2007; Sämann et al., Reference Sämann, Höhn, Chechko, Kloiber, Lucae, Ising and Czisch2013), 14: rostral/pregenual ACC (Chen et al., Reference Chen, Ridler, Suckling, Williams, Fu, Merlo-Pich and Bullmore2007), 15: dorsal ACC (Phillips et al., Reference Phillips, Batten, Tremblay, Aldosary and Blier2015a), 16: posterior cingulate cortex (Sämann et al., Reference Sämann, Höhn, Chechko, Kloiber, Lucae, Ising and Czisch2013), 17: basal ganglia: caudate nucleus (Chen et al., Reference Chen, Ridler, Suckling, Williams, Fu, Merlo-Pich and Bullmore2007), 18: hippocampus (Fu et al., Reference Fu, Costafreda, Sankar, Adams, Rasenick, Liu and Marangell2015; Liao et al., Reference Liao, Wang, Lu, Hung, Li, Lin and Wu2013; MacQueen et al., Reference MacQueen, Yucel, Taylor, Macdonald and Joffe2008; Sämann et al., Reference Sämann, Höhn, Chechko, Kloiber, Lucae, Ising and Czisch2013), 19: fusiform gyrus (Li et al., Reference Li, Lin, Chou, Chen, Hsieh, Wu and Su2010), 20: lingual gyrus (Jung et al., Reference Jung, Kang, Won, Nam, Lee, Tae and Ham2014), 21: occipital cuneus (Li et al., Reference Li, Lin, Chou, Chen, Hsieh, Wu and Su2010). (b) Pre-treatment GMV biomarkers associated with response to electroconvulsive therapy (ECT). 1: Superior frontal gyrus, supplementary motor cortex (Jiang et al., Reference Jiang, Abbott, Jiang, Du, Espinoza, Narr and Calhoun2018), 2: middle frontal gyrus (Jiang et al., Reference Jiang, Abbott, Jiang, Du, Espinoza, Narr and Calhoun2018), 3: postcentral gyrus (Jiang et al., Reference Jiang, Abbott, Jiang, Du, Espinoza, Narr and Calhoun2018), 4: inferior temporal gyrus (Jiang et al., Reference Jiang, Abbott, Jiang, Du, Espinoza, Narr and Calhoun2018), 5: subgenual ACC (Redlich et al., Reference Redlich, Opel, Grotegerd, Dohm, Zaremba, Bürger and Dannlowski2016), 6: amygdala (ten Doesschate et al., Reference ten Doesschate, van Eijndhoven, Tendolkar, van Wingen and van Waarde2014), 7: hippocampus (Cao et al., Reference Cao, Luo, Fu, Du, Qiu, Yang and Qiu2018; Joshi et al., Reference Joshi, Espinoza, Pirnia, Shi, Wang, Ayers and Narr2016), 8: lingual gyrus (Jiang et al., Reference Jiang, Abbott, Jiang, Du, Espinoza, Narr and Calhoun2018), 9: thalamus, nucleus accumbens (Gryglewski et al., Reference Gryglewski, Baldinger-Melich, Seiger, Godbersen, Michenthaler, Klöbl and Frey2019). (c) Pre-treatment GMV biomarkers associated with response to cognitive behavioural therapy (CBT). 1: Dorsal ACC (Fujino et al., Reference Fujino, Yamasaki, Miyata, Sasaki, Matsukawa, Takemura and Murai2015; Sambataro et al., Reference Sambataro, Doerig, Hänggi, Wolf, Brakowski, Grosse Holtforth and Spinelli2018), 2: rostral/pregenual ACC (Sambataro et al., Reference Sambataro, Doerig, Hänggi, Wolf, Brakowski, Grosse Holtforth and Spinelli2018; Webb et al., Reference Webb, Olson, Killgore, Pizzagalli, Rauch and Rosso2018), 3: subgenual ACC (Sambataro et al., Reference Sambataro, Doerig, Hänggi, Wolf, Brakowski, Grosse Holtforth and Spinelli2018).
Table 4. Strength of evidence: predictive grey matter biomarkers for treatment response

ACC, anterior cingulate cortex; DLPFC, dorsolateral prefrontal cortex; GM, grey matter; NR, treatment non-responders; OFC, orbitofrontal cortex; PFC, prefrontal cortex; R, treatment responders; ROI, region of interest.
a Vakili et al. (Reference Vakili, Pillay, Lafer, Fava, Renshaw, Bonello-Cintron and Yurgelun-Todd2000): only within females R > NR.
b Fu et al. (Reference Fu, Costafreda, Sankar, Adams, Rasenick, Liu and Marangell2015): association of early increase in hippocampal volume with treatment response.
c Pirnia et al. (Reference Pirnia, Joshi, Leaver, Vasavada, Njau, Woods and Narr2016): trend toward significance between pre-treatment ACC volume and clinical response; association of ACC thickness after first two sessions with electroconvulsive therapy with treatment response.
Pre-treatment GMV biomarkers of response on AD
Nine out of the 14 studies reported significant GMV biomarkers associated with response on AD (Chen et al., Reference Chen, Ridler, Suckling, Williams, Fu, Merlo-Pich and Bullmore2007; Colle et al., Reference Colle, Cury, Chupin, Deflesselle, Hardy, Nasser and Corruble2016; Jung et al., Reference Jung, Kang, Won, Nam, Lee, Tae and Ham2014; Korgaonkar et al., Reference Korgaonkar, Rekshan, Gordon, Rush, Williams, Blasey and Grieve2015; Li et al., Reference Li, Lin, Chou, Chen, Hsieh, Wu and Su2010; Liao et al., Reference Liao, Wang, Lu, Hung, Li, Lin and Wu2013; MacQueen, Yucel, Taylor, Macdonald, & Joffe, Reference MacQueen, Yucel, Taylor, Macdonald and Joffe2008; Phillips et al., Reference Phillips, Batten, Tremblay, Aldosary and Blier2015a; Sämann et al., Reference Sämann, Höhn, Chechko, Kloiber, Lucae, Ising and Czisch2013). Four studies revealed higher pre-treatment GMV of the hippocampus as a biomarker for AD response (Colle et al., Reference Colle, Cury, Chupin, Deflesselle, Hardy, Nasser and Corruble2016; Liao et al., Reference Liao, Wang, Lu, Hung, Li, Lin and Wu2013; MacQueen et al., Reference MacQueen, Yucel, Taylor, Macdonald and Joffe2008; Sämann et al., Reference Sämann, Höhn, Chechko, Kloiber, Lucae, Ising and Czisch2013), while one study showed that early increases in hippocampal volume during treatment were associated with response on AD (Fu et al., Reference Fu, Costafreda, Sankar, Adams, Rasenick, Liu and Marangell2015). Higher pre-treatment ACC volume has been shown as a biomarker of AD response by three studies (Chen et al., Reference Chen, Ridler, Suckling, Williams, Fu, Merlo-Pich and Bullmore2007; Phillips et al., Reference Phillips, Batten, Tremblay, Aldosary and Blier2015a; Sämann et al., Reference Sämann, Höhn, Chechko, Kloiber, Lucae, Ising and Czisch2013), while one study showed that not pre-treatment volume but an early increase in cortical thickness of the rostral ACC was associated with specific response on sertraline compared to placebo (Bartlett et al., Reference Bartlett, Delorenzo, Sharma, Yang, Zhang, Petkova and Parsey2018). However, two studies investigating the ACC as a biomarker in a ROI approach did not reveal significant results regarding treatment response (Fu et al., Reference Fu, Costafreda, Sankar, Adams, Rasenick, Liu and Marangell2015; Jung et al., Reference Jung, Kang, Won, Nam, Lee, Tae and Ham2014). Higher pre-treatment volume of the frontal cortex has further been reported as a predictor for AD response by five studies (Chen et al., Reference Chen, Ridler, Suckling, Williams, Fu, Merlo-Pich and Bullmore2007; Korgaonkar et al., Reference Korgaonkar, Rekshan, Gordon, Rush, Williams, Blasey and Grieve2015; Li et al., Reference Li, Lin, Chou, Chen, Hsieh, Wu and Su2010; Liao et al., Reference Liao, Wang, Lu, Hung, Li, Lin and Wu2013; Sämann et al., Reference Sämann, Höhn, Chechko, Kloiber, Lucae, Ising and Czisch2013). In contrast, higher pre-treatment GMV of temporal areas has been shown to be associated with slower or worse AD response by two studies (Li et al., Reference Li, Lin, Chou, Chen, Hsieh, Wu and Su2010; Sämann et al., Reference Sämann, Höhn, Chechko, Kloiber, Lucae, Ising and Czisch2013).
Pre-treatment GMV biomarkers of response on ECT
Six out of seven studies reported significant pre-treatment grey matter biomarkers for ECT response, while the seventh study found a trend towards significance (Pirnia et al., Reference Pirnia, Joshi, Leaver, Vasavada, Njau, Woods and Narr2016). Three studies showed that higher pre-treatment hippocampal volume was associated with worse ECT response (Cao et al., Reference Cao, Luo, Fu, Du, Qiu, Yang and Qiu2018; Gryglewski et al., Reference Gryglewski, Baldinger-Melich, Seiger, Godbersen, Michenthaler, Klöbl and Frey2019; Joshi et al., Reference Joshi, Espinoza, Pirnia, Shi, Wang, Ayers and Narr2016), while one study reported no relationship between pre-treatment hippocampal volume and ECT response (ten Doesschate, van Eijndhoven, Tendolkar, van Wingen, & van Waarde, Reference ten Doesschate, van Eijndhoven, Tendolkar, van Wingen and van Waarde2014). Higher pre-treatment GMV of the sgACC (Redlich et al., Reference Redlich, Opel, Grotegerd, Dohm, Zaremba, Bürger and Dannlowski2016) or an early increase in cortical thickness of the ACC during the first ECT sessions (Pirnia et al., Reference Pirnia, Joshi, Leaver, Vasavada, Njau, Woods and Narr2016) were shown to be associated with ECT response. Evidence by one study, respectively, shows that pre-treatment volume of fronto-temporal cortex areas and of the lingual gyrus (Jiang et al., Reference Jiang, Abbott, Jiang, Du, Espinoza, Narr and Calhoun2018), as well as of the thalamus and nucleus accumbens (Gryglewski et al., Reference Gryglewski, Baldinger-Melich, Seiger, Godbersen, Michenthaler, Klöbl and Frey2019) serve as biomarkers for ECT response.
Pre-treatment GMV biomarkers of response on CBT
Pre-treatment GMV of the ACC is highly associated with CBT response: All of the three studies reported that higher pre-treatment GMV of the rostral or dorsal ACC was predictive for CBT response (Fujino et al., Reference Fujino, Yamasaki, Miyata, Sasaki, Matsukawa, Takemura and Murai2015; Sambataro et al., Reference Sambataro, Doerig, Hänggi, Wolf, Brakowski, Grosse Holtforth and Spinelli2018; Webb et al., Reference Webb, Olson, Killgore, Pizzagalli, Rauch and Rosso2018). One study showed that higher pre-treatment cortical thickness of the sgACC (Sambataro et al., Reference Sambataro, Doerig, Hänggi, Wolf, Brakowski, Grosse Holtforth and Spinelli2018) was associated with a response on CBT, while the other study investigating the sgACC in a ROI analysis did not find any significant effects in association with CBT response (Webb et al., Reference Webb, Olson, Killgore, Pizzagalli, Rauch and Rosso2018).
Accuracy of individual predictions of response by machine learning
There are eight studies investigating the prediction of individual response on antidepressive treatments by the implementation of machine learning approaches. Response to ECT could be predicted with accuracy rates about 78–90% showing that parts of the basal ganglia, hippocampal subfields, as well as the sgACC were main regions for the prediction of ECT outcome (Cao et al., Reference Cao, Luo, Fu, Du, Qiu, Yang and Qiu2018; Jiang et al., Reference Jiang, Abbott, Jiang, Du, Espinoza, Narr and Calhoun2018; Redlich et al., Reference Redlich, Opel, Grotegerd, Dohm, Zaremba, Bürger and Dannlowski2016; Wade et al., Reference Wade, Joshi, Njau, Leaver, Vasavada, Woods and Narr2016). For AD, studies revealed accuracy rates between 64 by 89% regarding the classification of responders from non-responders by baseline brain morphology (Bartlett et al., Reference Bartlett, Delorenzo, Sharma, Yang, Zhang, Petkova and Parsey2018; Costafreda, Chu, Ashburner, & Fu, Reference Costafreda, Chu, Ashburner and Fu2009; Gong et al., Reference Gong, Wu, Scarpazza, Lui, Jia, Marquand and Mechelli2011; Liu et al., Reference Liu, Guo, Yu, Gao, Gao, Xue and Chen2012). In contrast, the only study implementing machine learning for the prediction of CBT response did not reveal an adequate classifier based on pre-treatment brain structure (Costafreda et al., Reference Costafreda, Chu, Ashburner and Fu2009).
Effects of age, gender and previous history of illness on findings
One study additionally investigating potentially confounding effects of demographic variables on their findings reported that age and gender were not associated with the hippocampal volume increase after ECT (Nordanskog et al., Reference Nordanskog, Larsson, Larsson and Johanson2014). Furthermore, pre-treatment GMV predicted response to ECT (Redlich et al., Reference Redlich, Opel, Grotegerd, Dohm, Zaremba, Bürger and Dannlowski2016; ten Doesschate et al., Reference ten Doesschate, van Eijndhoven, Tendolkar, van Wingen and van Waarde2014) or to AD (Chen et al., Reference Chen, Ridler, Suckling, Williams, Fu, Merlo-Pich and Bullmore2007; MacQueen et al., Reference MacQueen, Yucel, Taylor, Macdonald and Joffe2008) independently of age and gender. However, one study reported that differences in pre-treatment hippocampal volume between AD responders and non-responders were only detectable within women (Vakili et al., Reference Vakili, Pillay, Lafer, Fava, Renshaw, Bonello-Cintron and Yurgelun-Todd2000). In summary, age and gender do not seem to influence the pattern of results regarding GMV changes and biomarkers of treatments.
Age of onset, number of previous depressive episodes and/or illness duration were neither associated with remission rates of AD (Li et al., Reference Li, Lin, Chou, Chen, Hsieh, Wu and Su2010; MacQueen et al., Reference MacQueen, Yucel, Taylor, Macdonald and Joffe2008; Phillips et al., Reference Phillips, Batten, Tremblay, Aldosary and Blier2015a) nor influenced the association of pre-treatment GMV and AD response (MacQueen et al., Reference MacQueen, Yucel, Taylor, Macdonald and Joffe2008; Sämann et al., Reference Sämann, Höhn, Chechko, Kloiber, Lucae, Ising and Czisch2013). Disease duration had no impact on the machine learning classification of AD responders and non-responders (Gong et al., Reference Gong, Wu, Scarpazza, Lui, Jia, Marquand and Mechelli2011). Pre-treatment GMV of the amygdala predicted ECT response independently of pre-treatment depression severity (ten Doesschate et al., Reference ten Doesschate, van Eijndhoven, Tendolkar, van Wingen and van Waarde2014).
Discussion
This review aimed to summarize the brain structural changes and biomarkers of AD, ECT and CBT in depressive disorders. The results suggest widespread GMV increases after ECT and potential increases after AD – whereas for CBT, the evidence is still sparse. Responders and non-responders differ in pre-treatment brain morphology, especially highlighting the ACC as a predictive biomarker for response to all antidepressive treatments. The review provides an overview of the status quo of machine learning approaches, highlighting the potential of response predictions on the individual patient level.
Longitudinal GMV changes after antidepressive treatments
For ECT, there is a high consistency for widespread GMV increases of subcortical structures – such as the hippocampus–amygdala complex, ACC and the striatum – as well as within the temporal lobe. (Temporary) GMV reductions were found within prefrontal areas. For AD, the evidence is rather heterogeneous as only 4 of 11 studies reported significant changes in GMV – with increases in hippocampal volume as the most consistent finding. As our review yielded only one study investigating GMV changes after CBT, the results are not sufficient to draw conclusions about the structural brain effects of CBT. In the following, findings regarding changes in GMV will be discussed in detail, sorted by affected brain areas.
Hippocampus–amygdala complex
There is clear evidence for ECT-induced volume increases in the hippocampus–amygdala complex. In contrast, findings regarding hippocampal volume increases after AD are contradictory. The hippocampus is a brain structure that is very sensitive to environmental factors: Reductions of hippocampal GMV can occur due to chronic stress, e.g. childhood maltreatment (Dannlowski et al., Reference Dannlowski, Stuhrmann, Beutelmann, Zwanzger, Lenzen, Grotegerd and Kugel2012; Opel et al., Reference Opel, Redlich, Zwanzger, Grotegerd, Arolt, Heindel and Dannlowski2014), recurrent depressive episodes or repeated inpatient hospitalizations (Stratmann et al., Reference Stratmann, Konrad, Kugel, Krug, Schöning, Ohrmann and Dannlowski2014; Zaremba et al., Reference Zaremba, Enneking, Meinert, Förster, Bürger, Dohm and Dannlowski2018). Furthermore, the hippocampus is a main region within the mammalian brain where neurogenesis is being processed (Gould, Reference Gould2007). As one of the mechanisms underlying hippocampal volume increases, an elevated transcription of neurotrophic proteins such as brain-derived neurotrophic factor has been reported after ECT (Piccinni et al., Reference Piccinni, Del Debbio, Medda, Bianchi, Roncaglia, Veltri and Dell'Osso2009) as well as after treatment with AD (Willner et al., Reference Willner, Scheel-Krüger and Belzung2013). By this, synaptic plasticity and proliferation are influenced and neurogenesis as well as synaptogenesis and dendritic arborisation within the hippocampus are stimulated. An increased number of hippocampal neurons has further been described in the rat brain after a single electric shock (Madsen et al., Reference Madsen, Treschow, Bengzon, Bolwig, Lindvall and Tingström2000) as well as after chronic treatment with AD (Malberg, Eisch, Nestler, & Duman, Reference Malberg, Eisch, Nestler and Duman2000). The findings of hippocampal volume increases after ECT are hence in line with the supposed neural mechanisms. In contrast, results related to hippocampal volume changes after AD are conflicting. Explanations may be: (1) AD stimulates neurogenesis more slowly and less powerfully (Malberg et al., Reference Malberg, Eisch, Nestler and Duman2000) than treatment with ECT, or (2) neurogenesis is only detectable in AD responders. This is supported by earlier works describing hippocampal volume increases as pivotal for the antidepressive mechanism of AD (Perera et al., Reference Perera, Dwork, Keegan, Thirumangalakudi, Lipira, Joyce and Coplan2011; Santarelli et al., Reference Santarelli, Saxe, Cross, Surget, Battaglia, Dulawa and Hen2003). Only one of the studies reporting no significant hippocampal volume increases investigated GMV changes of responders and non-responders separately – revealing that only responders tended to show GMV increases while non-responders even had a slight hippocampal volume reduction after AD (Phillips et al., Reference Phillips, Batten, Tremblay, Aldosary and Blier2015a). This response × time interaction probably led to non-significant results in the other studies reporting no hippocampal volume changes after AD in the whole sample.
In contrast to this potential response-specific effect of AD on hippocampal volume, the majority of the studies in our review did not reveal an association of hippocampal volume increases and ECT response. This explains the high consistency of hippocampal volume increases after ECT – occurring independently of treatment response. Anyway, the relevance of these ECT-induced hippocampal volume increases for the antidepressive mechanism of ECT is still unclear.
Anterior cingulate cortex
While after AD, no GMV changes were reported for the ACC, the findings reveal strong evidence for GMV increases after ECT within subcortical areas, e.g. the striatum and ACC. However, only GMV increases of the sgACC were found to be associated with ECT response.
In patients with MDD, reduced volume of the sgACC has been described in comparison to healthy controls (Drevets et al., Reference Drevets, Price, Simpson, Todd, Reich, Vannier and Raichle1997, Reference Drevets, Savitz and Trimble2008). The sgACC, in conjunction with the amygdala, is a key region of emotional and motivational processing (Bush, Luu, Posner, Ochsner, & Gross, Reference Bush, Luu, Posner, Ochsner and Gross2005). Probably, By inducing volume increases of the sgACC (as well as of the amygdala), ECT may reduce the depression-associated limbic hyper-reactivity (Redlich et al., Reference Redlich, Bürger, Dohm, Grotegerd, Opel, Zaremba and Dannlowski2017). In line with research concerning deep brain stimulation (Berlim, McGirr, Van Den Eynde, Fleck, & Giacobbe, Reference Berlim, McGirr, Van Den Eynde, Fleck and Giacobbe2014), this indicates a highly relevant role of the sgACC for the successful action of antidepressive treatments. However, the underlying cellular mechanisms are widely unknown. A variety of neurogenerative processes, such as synaptogenesis, gliogenesis, angiogenesis or even neurogenesis, are suggested as potential mechanisms.
Prefrontal cortex
The results of our review suggest that the effects of antidepressive treatments on prefrontal areas are complex. The few studies explicitly investigating the effects of AD on prefrontal areas show either GMV increases, reductions or no changes. One possible explanation for these conflicting results is the vast heterogeneity in study designs, sample characteristics, time intervals between baseline and follow-up and the investigation of different substance classes of AD. After ECT, temporary reductions in GMV of frontal areas as well as no changes in prefrontal GMV were reported. Potential ECT-induced frontal volume reductions were reported to normalize in the long-term (Jorgensen et al., Reference Jorgensen, Magnusson, Hanson, Kirkegaard, Benveniste, Lee and Jorgensen2016). These potential frontal GMV reductions after ECT might provide an explanation for cognitive deficits accompanied by ECT, remitting by time (Rami-Gonzalez et al., Reference Rami-Gonzalez, Bernardo, Boget, Salamero, Gil-Verona and Junque2001; Sackeim et al., Reference Sackeim, Prudic, Fuller, Keilp, Lavori and Olfson2007; Semkovska & McLoughlin, Reference Semkovska and McLoughlin2010). However, most of the studies included in the review did not investigate the association of GMV changes and changes in cognitive functioning after ECT.
The only study that investigates the brain structural effects of CBT reveals GMV increases in frontal areas in association with CBT response. In line with evidence regarding changes in brain function, consistently showing increased activity in the frontal areas after CBT (Atkinson et al., Reference Atkinson, Sankar, Adams and Fu2014; DeRubeis, Siegle, & Hollon, Reference DeRubeis, Siegle and Hollon2008; Fu et al., Reference Fu, Williams, Cleare, Scott, Mitterschiffthaler, Walsh and Murray2008; Roiser et al., Reference Roiser, Elliott and Sahakian2012; Siegle et al., Reference Siegle, Thompson, Collier, Berman, Feldmiller, Thase and Friedman2012; Yoshimura et al., Reference Yoshimura, Okamoto, Onoda, Matsunaga, Okada, Kunisato and Yamawaki2014), these results suggest that CBT enhances cognitive control functions and therefore reduces the limbic hyper-reactivity by an indirect ‘top-down mechanism’ (DeRubeis et al., Reference DeRubeis, Siegle and Hollon2008). However, further studies that investigate GMV changes after CBT are required. Instead, there is a relatively high number of studies reporting brain functional changes after CBT supporting the hypothesis that CBT effects on the brain may rather be represented on a functional level rather than by changes in morphology.
Pre-treatment GMV biomarkers of response
Our review shows that responders and non-responders differ in GMV of limbic and prefrontal areas at the baseline level. Higher pre-treatment GMV of the ACC is associated with general response independent of the type of treatment. The findings will be discussed and interpreted below sorted by the respective brain regions.
Pregenual and subgenual ACC
Higher pre-treatment GMV of the pregenual ACC (pgACC) and sgACC is associated with a response on ECT, AD and CBT. The pgACC and sgACC are involved in the appraisal of emotional and motivational relevance of stimuli and in the generation of emotional states, hence in bottom-up reactivity of emotional processing (Bush et al., Reference Bush, Luu, Posner, Ochsner and Gross2005; Franklin et al., Reference Franklin, Carson and Welch2016; Willner et al., Reference Willner, Scheel-Krüger and Belzung2013). The sgACC further has connections to the raphé nuclei and provides concentrations of 5HTT serotonin transporter, which underlines its relevance for the action of selective serotonin reuptake inhibitors such as fluoxetine (Varnäs, Halldin, & Hall, Reference Varnäs, Halldin and Hall2004). The finding that higher pre-treatment volume of the sgACC and pgACC is favourable for general treatment outcome indicates that all treatments require an unaltered prerequisite for affective and motivational processing, suggesting that these processes are of high relevance for the mechanism of all (successful) antidepressive therapies. Functional neuroimaging studies support this finding, as responders and non-responders also differ in pre-treatment pgACC and sgACC activity during resting state or emotional processing (Ball, Stein, & Paulus, Reference Ball, Stein and Paulus2014; DeRubeis et al., Reference DeRubeis, Siegle and Hollon2008; Fu, Steiner, & Costafreda, Reference Fu, Steiner and Costafreda2013; Mayberg, Reference Mayberg2003; Phillips et al., Reference Phillips, Chase, Sheline, Etkin, Almeida, Deckersbach and Trivedi2015b; Roiser et al., Reference Roiser, Elliott and Sahakian2012).
Dorsal ACC
Higher pre-treatment GMV of the dorsal ACC (dACC) has been reported as a predictor for a response on AD and CBT. The dACC is involved in attentional processes and emotional regulation, hence in the top-down regulation of emotional states (Bush et al., Reference Bush, Luu, Posner, Ochsner and Gross2005; Franklin et al., Reference Franklin, Carson and Welch2016; Willner et al., Reference Willner, Scheel-Krüger and Belzung2013). Preconditions regarding emotional regulation and cognitive control are relevant for the mechanisms of both AD and CBT, while for ECT this has not been reported. These results support the supposed mechanisms of CBT and AD: CBT acts by the identification and reappraisal of negative thoughts and leads to a cognitive regulation of automatic emotional states. In order to acquire these cognitive strategies and enhance top-down control, an unaltered structure of dACC is required. In contrast, AD is supposed to directly influence the generation of emotional states via decreasing limbic hyperactivity, not immediately influencing top-down control. Thus, better preconditions of top-down control are also favourable for the treatment with AD. Interestingly, functional neuroimaging studies support pre-treatment activity of the dACC during emotional processing as a differential predictor for response on AD in comparison to CBT (Ball et al., Reference Ball, Stein and Paulus2014; DeRubeis et al., Reference DeRubeis, Siegle and Hollon2008; Fu et al., Reference Fu, Steiner and Costafreda2013; Mayberg, Reference Mayberg2003; Phillips et al., Reference Phillips, Chase, Sheline, Etkin, Almeida, Deckersbach and Trivedi2015b; Roiser et al., Reference Roiser, Elliott and Sahakian2012) underlining the relevance of cognitive control processes for the efficacy of AD and CBT.
Hippocampus
The results show relatively homogeneous evidence that higher hippocampal GMV predicts response to AD. This is in accordance with the finding that reduced hippocampal GMV is generally associated with an unfavourable course of the disease (Stratmann et al., Reference Stratmann, Konrad, Kugel, Krug, Schöning, Ohrmann and Dannlowski2014; Zaremba et al., Reference Zaremba, Enneking, Meinert, Förster, Bürger, Dohm and Dannlowski2018). However, it is surprising that for ECT, no relationship or even a contrary relationship has been found. This could explain why even patients with an unfavourable course of disease with lower pre-treatment hippocampal volume respond to ECT. As reported earlier, ECT leads to hippocampal volume increases, leading to a reduced vulnerability and to an improved prognosis regarding the course of the illness and responsiveness to further treatments. These findings underline the guidelines for ECT as an effective therapy for treatment-resistant depression.
Temporal cortex
Surprisingly, there is evidence that larger pre-treatment temporal GMV stands in association with non-response to AD, while this has not been reported for CBT or ECT. The authors of this finding suggested that comorbid anxiety in patients with larger temporal GMV might be an explanation for the reduced treatment response (Inkster et al., Reference Inkster, Rao, Ridler, Nichols, Saemann, Auer and Matthews2011; Sämann et al., Reference Sämann, Höhn, Chechko, Kloiber, Lucae, Ising and Czisch2013). Another, more mechanistic explanation is that successful AD treatment acts by increasing GMV of temporal structures (Phillips et al., Reference Phillips, Batten, Tremblay, Aldosary and Blier2015a), so that patients with higher pre-treatment temporal volumes have less potential to benefit from temporal GMV increases associated with response. However, as there are only two studies supporting this finding, the relevance of higher pre-treatment temporal GMV as a biomarker for non-response on AD should be investigated in future studies.
Accuracy of individual predictions of response by machine learning
Machine learning studies show that in patients with MDD, the prediction of AD or ECT response on the individual patient level is possible – with the restriction that all but one of the included studies have group sample sizes of n < 50. Of predictive relevance were parts of the basal ganglia, hippocampal subfields, as well as the sgACC. This is in line with the findings of the biomarker studies revealing differences in ACC and hippocampal volume between treatment responders and non-responders. However, the algorithms trained and applied by machine learning approaches are based on whole brain GMV patterns instead of single structures. Machine learning approaches do not provide information about the composition and influence of single brain regions. These approaches however show that GMV patterns of the whole brain interact with the response to treatments with AD and ECT. In contrast, for CBT, reliable response predictions based on whole brain GMV data have not been shown. This can either be explained by the lack of studies applying multivariate pattern approaches for the prediction of CBT response, or by the possibility that CBT response may rather be predicted by specific single structures than by whole brain patterns. Combining the results of the predictive biomarker studies, a focus on pre-treatment ACC volume could probably enhance the accuracy of pattern classification for the prediction of CBT response.
In sum, response predictions on the individual patient level have a high potential for the translation in clinical practice even if still in a proof-of-concept stage. In the future, they could contribute as an additive feature in the process of clinical diagnosis and indication. As the assessment of structural imaging data is in some inpatient services already part of the clinical routine in diagnosis and treatment indication, the application of structural MRI data for an individual prediction of response would be easily implementable in the clinical context. However, before algorithms can be used in clinical routine, multicentre studies with larger and various samples are needed in order to allow a validation and optimization of the classifiers for the individual application.
Limitations and perspectives for future studies
This is the first review providing a systematic overview of present MRI studies investigating brain morphological changes and pre-treatment biomarkers of response regarding the most common antidepressive treatments, namely AD, CBT and ECT. There is homogeneous evidence of subcortical and temporal volume increases after ECT – pointing out that ECT initiates widespread neuroplastic changes within the brain. In contrast, for AD and CBT, findings regarding volume increases are heterogeneous or insufficient due to a lack of studies, differences in study designs, sample characteristics or small effect sizes. The investigation of pre-treatment biomarkers associated with response highlights the ACC as an important region involved in the mechanisms of all antidepressive treatments. Higher pre-treatment hippocampal volume has only been reported to be associated with AD response. A selection of biomarkers of response – such as the ACC and the hippocampus – could finally enhance the accuracies of the predictions on the individual patient level made by machine learning approaches. The results regarding GMV changes and biomarkers of antidepressive treatments are mostly not affected by age, gender or previous history of illness. Pre-treatment GMV of the hippocampus–amygdala complex predicted ECT response independently of the previous course of illness. This underlines the potential of brain structural biomarkers as an additive feature for response prediction complementing the indication based on the usual clinical features. Machine learning approaches allow predictions of individual AD or ECT response with relatively high accuracies, but should be investigated in larger multicentre studies in order to pave the way for future application in clinical practice.
There are some methodological issues to be mentioned, probably explaining heterogeneity in study results: Limitations of the included studies comprise the relatively small sample sizes, leading to constraints in reliability and power problems. Suppose that the effects of AD and CBT on brain structure have small to medium effect sizes, small sample sizes may have led to false-negative results in several studies. Furthermore, there is a vast heterogeneity between the samples of different studies regarding severity and chronicity of depression (first episode v. recurrent v. treatment-resistant depression), actual treatment status (inpatient v. outpatient) and previous treatments. As the patients' illness chronicity has been reported to be confounded with brain morphological alterations in depression (MacQueen et al., Reference MacQueen, Campbell, McEwen, Macdonald, Amano, Joffe and Young2003; Zaremba et al., Reference Zaremba, Enneking, Meinert, Förster, Bürger, Dohm and Dannlowski2018), treatment-associated GMV changes and biomarkers may also diverge between first and recurrent episode patients and might be influenced by previous treatment trials or concomitant treatment. Further difficulties in comparability arise out of considerable heterogeneity of the studies regarding the methods for pre-processing, the methods of data analysis (whole brain v. ROI) and regarding the outcome variable (grey matter density, GMV, cortical thickness). A further confounder may be the length of the interval between the baseline and post-treatment measurement: While in short time intervals (e.g. 5 weeks), potential GMV changes may not yet have been processed, in long time intervals (e.g. 1 year) it is difficult to control for multiple confounding factors such as the course of illness, concomitant treatment, etc. As most of the studies did not include a patient control group without any treatment, it is still unclear whether the GMV changes are attributable to the treatments themselves or to the remission from the depressive state.
The search strategy focusing on published studies includes the risk of a publication bias and therefore might overestimate significant results. Furthermore, even if our eligibility criteria still accounted for remarkable differences between different samples, treatments and data analysing methods, the eligibility process resulted into a relatively low inclusion rate of ca. 2% of all screened studies. It should therefore be taken into account that conclusions can only be drawn for samples and treatments meeting our inclusion criteria.
Summing up, there is a need for further research investigating the effects of different treatments in a randomized pre-post treatment design with larger sample sizes. An integration of a patient control group without treatment would further allow a comparison of brain structural changes induced by treatments with those occurring due to waiting list or placebo effects. In the future, a combination of brain structural data with demographic, clinical and psychometric variables, functional brain and connectivity data as well as further neurobiology like, e.g. (epi-) genetics could lead to a systematic understanding of treatment effects and to a more precise prognosis of treatment response.
In summary, this review points out strong neuroplastic effects of ECT on the hippocampus–amygdala complex and further subcortical structures. It underlines the importance of the pre-treatment morphology of the ACC for clinical response independent of treatment type. Due to its strong interconnections with the limbic system and prefrontal areas, the ACC plays an important role in the integration of top-down regulation, as well as bottom-up mechanisms in emotional processing. Evidence of GMV changes after AD or CBT is heterogeneous and/or sparse with need for future studies investigating larger sample sizes and standardized treatments. Even if machine learning studies show high potential for the prediction of response based on the individual pre-treatment brain data, there is a need for validation in larger samples before algorithms can be applied in clinical practice.
Financial support
This work was supported by grants of the Innovative Medizinische Forschung (RE111604 and RE111722 to RR, LE121703 to EJL), and the German Research Foundation (DFG, grant FOR2107 DA1151/5-1 and DA1151/5-2 to UD; SFB-TRR58, Projects C09 and Z02 to UD) and the Interdisciplinary Center for Clinical Research (IZKF) of the medical faculty of Münster (grant Dan3/012/17 to UD).
Conflict of interest
None.


