


Introduction
Anxiety and depression are associated with impairment in major life domains and increased mortality (Murray & Lopez, Reference Murray and Lopez1997; Pratt, Druss, Manderscheid, & Walker, Reference Pratt, Druss, Manderscheid and Walker2016; Ruscio et al., Reference Ruscio, Brown, Chiu, Sareen, Stein and Kessler2008). Cognitive behavioral therapy (CBT), first-line psychotherapy for internalizing psychopathologies, can ameliorate this burden. CBT has an enduring effect (Cuijpers, Hollon et al., Reference Cuijpers, Hollon, van Straten, Bockting, Berking and Andersson2013) and is sometimes preferred by patients over antidepressants (Bayliss & Holttum, Reference Bayliss and Holttum2015). Although many benefit, meta-analytic studies report a moderate effect size for disorder-specific symptoms (Hedges' g = 0.56; Carpenter et al., Reference Carpenter, Andrews, Witcraft, Powers, Smits and Hofmann2018) and depression (g = 0.53; Cuijpers, Berking et al., Reference Cuijpers, Berking, Andersson, Quigley, Kleiboer and Dobson2013). Identifying which patient will likely benefit from treatment and understanding the mechanisms that underlie treatment response could reduce sub-optimal outcomes.
Neuroimaging studies frequently involve facial expressions as they represent salient features of social environments (Morris, Ohman, & Dolan, Reference Morris, Ohman and Dolan1998) engaging bottom-up processes mediated by emotion processing regions (e.g. amygdala; Whalen, Reference Whalen1998) and top-down regions [e.g. medial prefrontal cortex (PFC); Adolphs, Reference Adolphs2002] that contribute to more in-depth processing and modulation of emotional responses. In healthy individuals, different facial expressions are supported by shared and discrete neural substrates (Fusar-Poli et al., Reference Fusar-Poli, Placentino, Carletti, Landi, Allen, Surguladze and Politi2009; Murphy, Nimmo-Smith, & Lawrence, Reference Murphy, Nimmo-Smith and Lawrence2003) and large-scale functional connectivity pathways between regions (Liang, Liu, Li, & Wang, Reference Liang, Liu, Li and Wang2018). Threatening faces are especially pertinent due to the evolutionary advantage of detecting threat to adjust behavior effectively (Öhman & Mineka, Reference Öhman and Mineka2001). Further highlighting the adaptive functions of expressions, differences in threat content are associated with neurobiological differences. For example, fearful expressions engage amygdala to a greater extent than angry faces as more information is needed to determine the nature of the probable threat (Whalen, Reference Whalen1998).
As predictors of treatment outcome, a seminal study demonstrated more baseline activity in dorsal and ventral occipitotemporal cortex to angry (v. neutral) faces (but not negative v. neutral scenes) during a 1-back task corresponded with greater symptom improvement following 12 weeks of CBT in socially anxious patients (Doehrmann et al., Reference Doehrmann, Ghosh, Polli, Reynolds, Horn, Keshavan and Gabrieli2013). More baseline activity to angry faces in dorsolateral and ventrolateral PFC also corresponded with more symptom improvement albeit at a trend level (Doehrmann et al., Reference Doehrmann, Ghosh, Polli, Reynolds, Horn, Keshavan and Gabrieli2013). Extending these findings in socially anxious patients, we found more baseline activity to angry (v. happy) faces in middle temporal gyrus (MTG) during an emotion face matching task (EFMT) that predicted greater symptom improvement following 12 weeks of CBT (Klumpp, Fitzgerald, & Phan, Reference Klumpp, Fitzgerald and Phan2013). For fearful (v. happy) faces we observed more baseline activity in MTG also foretold better CBT outcome along with other regions including (pre)/frontal areas (e.g. anterior cingulate cortex (ACC), dorsolateral PFC) and other temporal areas (e.g. superior temporal gyrus). Differences between angry and fearful faces suggest neural markers may differentially relate to face type.
In a shift from disorder-specific predictors, greater pre-treatment amygdala and insula activation to emotional faces (v. shapes) during EFMT corresponded with greater symptom improvement following 12 weeks of CBT or medication in patients with internalizing psychopathologies (Gorka et al., Reference Gorka, Young, Klumpp, Kennedy, Francis, Ajilore and Phan2019). Face type was not a focus of the study; thus, it is unclear if certain expressions drove findings. Nonetheless, regression results indicated more baseline subcortical activity predicted better treatment response regardless of the diagnostic category.
In contrast to explicit face processing, implicit face processing studies show negative associations between neural activity and symptom improvement. In posttraumatic stress disorder, less baseline amygdala and ACC response to subliminal (i.e. masked) fearful (v. neutral) faces predicted greater symptom improvement following 8 weeks of CBT (Bryant et al., Reference Bryant, Felmingham, Kemp, Das, Hughes, Peduto and Williams2008). In a study involving gender identification of sad faces of varied intensity, less overall baseline activation in regions that included inferior frontal gyrus correlated with more symptom improvement following 16 weeks of CBT in depressed patients (Fu et al., Reference Fu, Williams, Cleare, Scott, Mitterschiffthaler, Walsh and Murray2008).
Collectively, variance in neural activity in regions that underlie emotion processing and/or emotion regulation are promising markers of treatment outcome despite inconsistencies likely due in part to methodological differences across studies. Individual differences in brain-based predictors of treatment outcome that represent subgroups of relatively homogenous neural activity (i.e. categories of neural activity) may aid in delineating phenotypes that interact with mechanisms of change.
Therefore, the primary goal of the current study was to use a classification approach to identify and characterize subgroups of patients based on pre-treatment neural activity that predicted CBT success (yes/no) and evaluate such activity and symptom change following CBT. Based on previous explicit face processing studies (Doehrmann et al., Reference Doehrmann, Ghosh, Polli, Reynolds, Horn, Keshavan and Gabrieli2013; Gorka et al., Reference Gorka, Young, Klumpp, Kennedy, Francis, Ajilore and Phan2019; Klumpp et al., Reference Klumpp, Fitzgerald and Phan2013), we hypothesized the subgroup representing relatively high pre-treatment activity to threatening faces in regions involved in emotion processing (e.g. amygdala, occipitotemporal cortex) or regulation (e.g. prefrontal cortices) would encompass more treatment responders than the subgroup with less baseline activity. We also expected diagnostic status (i.e. principal anxiety disorder v. depressive disorder) would be equivalent across subgroups.
As prior work indicates neural predictors may be sensitive to face type (Klumpp et al., Reference Klumpp, Fitzgerald and Phan2013), each facial expression was examined. Additionally, functional pathways underlie expressions (Liang et al., Reference Liang, Liu, Li and Wang2018), therefore, we explored possible relationships between treatment-outcome classifier region(s) and interactions with other brain regions. Lastly, brain region(s) that classified treatment-outcome subgroups were compared to healthy controls who served as a ‘baseline’ as controls did not receive treatment. We also evaluated whether the treatment-outcome classifier region(s) was stable in controls.
Methods
Participants
This is a secondary analysis of data collected across two studies comprising un-medicated patients and healthy controls who completed the same emotion recognition task during functional magnetic resonance imaging (fMRI) before and after 12 weeks and met quality control parameters. A portion of participants was previously reported (Gorka et al., Reference Gorka, Young, Klumpp, Kennedy, Francis, Ajilore and Phan2019; Klumpp et al., Reference Klumpp, Fitzgerald and Phan2013), however, the research topics differed from the current study. Results are reported across studies unless otherwise noted.
Studies involved an open trial of CBT (2012–2017), which did not meet NIH/NIMH criteria for a clinical trial, and a clinical trial study where patients were randomized to CBT or medication (2013–2018; ClinicalTrials.gov identifier: NCT01903447). In the clinical trial study, analysis was limited to CBT patients. Comorbidity was permitted across studies. See online Supplementary Material for details including comorbidity and inclusion/exclusion criteria. To examine potential differences between cohorts, independent t tests and chi-square analyses were performed.
Altogether, the current study comprised 90 patients [social anxiety disorder (n = 38), generalized anxiety disorder (n = 25), major depressive disorder (n = 18), panic disorder (n = 5), posttraumatic stress disorder (PTSD; n = 3), persistent depressive disorder (n = 1)] and 45 healthy controls. To examine possible diagnostic effects (i.e. principal anxiety v. depression), the few patients with PTSD were assigned to the ‘anxiety’ group. Though PTSD is in the category of ‘Trauma and Stress-Related Disorders’ (First, Williams, Karg, & Spitzer, Reference First, Williams, Karg and Spitzer2015), it has historically been categorized as an anxiety disorder in previous DSM editions. Healthy controls completed the same clinical assessments as patients at baseline but did not complete clinical assessments after 12 weeks.
Primary outcome measures were the clinician-administered Hamilton Anxiety Rating Scale (HAMA; Hamilton, Reference Hamilton1959), Hamilton Depression Rating Scale (HAMD; Hamilton, Reference Hamilton1960), and self-report Depression, Anxiety, and Stress Scale (DASS; Lovibond and Lovibond, Reference Lovibond and Lovibond1995). Secondary measures were the clinician-administered Liebowitz Social Anxiety Scale (LSAS; Liebowitz, Reference Liebowitz1987) and self-report Penn State Worry Questionnaire (PSWQ; Meyer, Miller, Metzger, and Borkovec, Reference Meyer, Miller, Metzger and Borkovec1990) given the number of patients with a social or generalized anxiety disorder. Details are described in online Supplementary Materials.
All analyses were two-tailed with an alpha level of 0.05 and performed in the Statistical Package for the Social Sciences (Chicago, IL, USA; Version 24).
As expected, patients were more symptomatic than controls (lowest p = 0.001) and both groups were equivalent in demographic characteristics (lowest p = 0.07) but not race [χ2(4) = 10.10, p = 0.04]. See Table 1 for details.
Table 1. Demographic and clinical characteristics of patients and healthy control participants

HAMA, Hamilton Anxiety Rating Scale; HAMD, Hamilton Depression Rating Scale; DASS, Depression, Anxiety, and Stress Scale; LSAS, Liebowitz Social Anxiety Scale; PSWQ, Penn State Worry Questionnaire.
When comparing open trial CBT against randomized-to-CBT patients, similarities and differences were detectedFootnote 1. Importantly, diagnostic status (principal anxiety v. depression) was comparable between samples [χ2(1) = 0.96, p = 0.33] and they were analogous in post-CBT clinical measures (lowest p = 0.24). See online Supplementary Material for details.
Treatment
After the first scan, patients began once-weekly individual sessions of manualized CBT for 12 weeks based on principal diagnosis (e.g., Beck, Rush, Shaw, & Gary, Reference Beck, Rush, Shaw and Gary1979; Craske, David, & Tracy, Reference Craske, David and Tracy1992; Hope, Heimberg, & Turk, Reference Hope, Heimberg and Turk2006; Martell, Dimidjian, & Herman-Dunn, Reference Martell, Dimidjian and Herman-Dunn2010). See online Supplementary STable S1 in Supplemental Material for session details. A CBT-trained licensed clinical psychologist or post-doctoral clinical psychologist conducted treatment and were supervised by a licensed clinical psychologist with expertise in CBT and clinical trials.
Responder status comprised two measures (Loerinc et al., Reference Loerinc, Meuret, Twohig, Rosenfield, Bluett and Craske2015); ‘responders’ were required to exhibit a pre-to-post CBT decrease of >50% in HAMA total score (patients with principal anxiety disorder) or HAMD total score (patients with principal depressive disorder) and a decrease of >50% in DASS total score.
fMRI task
All participants performed an emotion recognition task used in prior treatment studies shown to engage regions involved in emotion processing and/or regulation (Gorka et al., Reference Gorka, Young, Klumpp, Kennedy, Francis, Ajilore and Phan2019; Klumpp et al., Reference Klumpp, Fitzgerald and Phan2013; Labuschagne et al., Reference Labuschagne, Phan, Wood, Angstadt, Chua, Heinrichs and Nathan2010; Phan et al., Reference Phan, Angstadt, Golden, Onyewuenyi, Popovska and de2008, Reference Phan, Coccaro, Angstadt, Kreger, Mayberg, Liberzon and Stein2013). In brief, participants viewed a trio of faces or geometric shapes where the target stimulus was at the top and congruent and incongruent stimuli were at the bottom. The incongruent face was always a neutral expression. Contrasts of interest were angry(>shapes), fearful(>shapes), and happy(>shapes). See Fig. 1 for schematic.
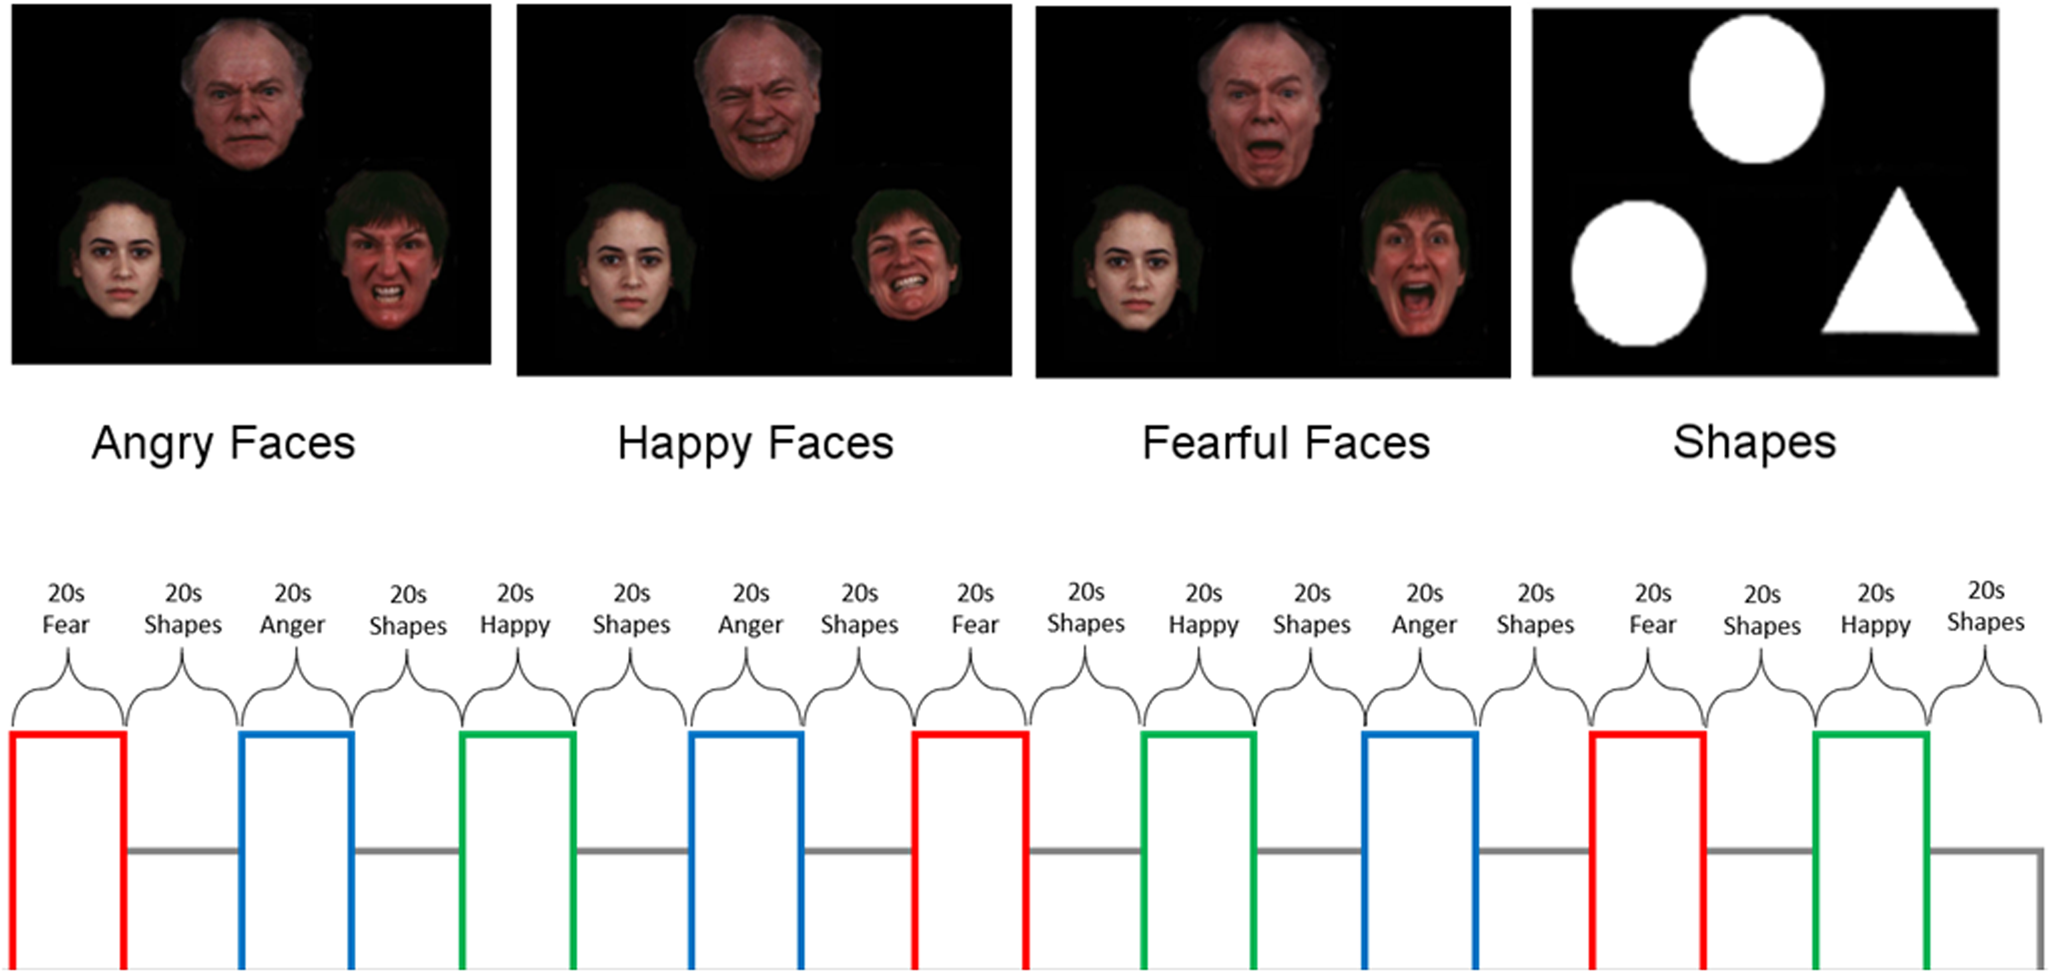
Fig. 1. Schematic of emotion face-matching task that includes ‘baseline’ geometric shapes trials.
Task and fMRI data acquisition/preprocessing details are in online Supplementary Material.
Task performance
A 3 (Group: responder, non-responder, healthy control) × 4 (Stimulus type: angry, fearful, happy, shapes) × 2 (Time: week 0 and week 12) mixed repeated measure ANOVA was performed for accuracy and reaction time (RT) for accurate trials.
To explore if the neural predictor(s) that classified treatment-outcome subgroups corresponded to task performance, linear regression analysis (simultaneous entry) was performed.
Data analysis for neural predictors
MarsBar (Brett, Anton, Valabregue, & Poline, Reference Brett, Anton, Valabregue and Poline2002) in SPM12 was used to extract parameter estimates of activation [β weights, arbitrary units (a.u.)] for faces and shapes in a priori anatomy-based regions of interest (‘ROIs’) (AAL atlas; Tzourio-Mazoyer et al., Reference Tzourio-Mazoyer, Landeau, Papathanassiou, Crivello, Etard, Delcroix and Joliot2002). Based on prior studies and theory, ROIs comprised bilateral amygdala, anterior cingulum, inferior frontal gyrus (orbital, triangular, opercular portions), dorsolateral prefrontal cortex (i.e. middle frontal gyrus), frontal medial orbital gyrus, medial superior frontal gyrus (SFG), MTG, superior temporal gyrus, inferior temporal gyrus, hippocampus, insula, and occipital cortex (inferior, middle, and superior portions) resulting in 32 ROIs (see online Supplementary SFig. S1).
Pre-treatment ROI-based activation was submitted to receiver operating characteristic (ROC) curve analysis uncorrected for multiple comparisons as each a priori ROI had the potential to serve as a neural predictor of responder status. Significant ROIs were then inputted into a binary variable decision tree. To determine which ROI identified treatment-outcome subgroups, an exhaustive Pearson chi-squared automatic interaction detection algorithm was used (Kass, Reference Kass1980). The significance level for splitting nodes and merging categories was <0.05 with Bonferroni correction. See online Supplementary Material for details.
Decision tree derived subgroups were submitted to general linear models to test for post-CBT changes. Pearson's correlations were performed to evaluate whether the pre-to-post change in neural activity correlated with change in symptoms within subgroups.
To evaluate temporal stability of the treatment-outcome classifier region(s) in healthy participants, paired t tests were conducted and intraclass correlation coefficients (ICC) were computed using a two-way mixed model with estimates for absolute agreement.
For whole-brain functional connectivity, psychophysiological interactions (PPIs) analysis was performed (Friston et al., Reference Friston, Buechel, Fink, Morris, Rolls and Dolan1997) in SPM12. The region(s) that identified treatment-outcome subgroups was the ‘seed’ region. The interaction term of the seed timeseries with task parameters [face type(>shapes)] was the variable of interest. The timeseries of the seed itself as well as the task covariate and the six-movement parameters were all included as effects of no interest. To correct for multiple comparisons, whole-brain familywise error (FWE) was used.
Results
Treatment
Paired t tests revealed significant pre-to-post CBT decreases in all clinical measures across patients (lowest p = 0.001). See Table 1 for details.
Table 2. Demographic and clinical characteristics of responders and non-responders before and after cognitive behavioral therapy

HAMA, Hamilton Anxiety Rating Scale; HAMD, Hamilton Depression Rating Scale; DASS, Depression, Anxiety, and Stress Scale; LSAS, Liebowitz Social Anxiety Scale; PSWQ, Penn State Worry Questionnaire.
Regarding responder status, 56.7% of patients (n = 51) responded to CBT as determined by >50% reduction in symptom severity based on interview and self-report measures; 43.3% of patients (n = 39) were non-responders. Independent t tests showed that prior to CBT, responders were more anxious [HAMA; t(88) = 2.83, p = 0.008] and depressed [HAMD; t(88) = 2.26, p = 0.026] than non-responders but self-reported similar levels of symptom severity [DASS; t(88) = 1.65, p = 0.10] and had comparable levels of social anxiety (LSAS; p = 0.87) and worry (PSWQ; p = 0.71). They were also equivalent to demographic characteristics (lowest p = 0.13). See Table 2.
Since baseline anxiety and depression levels were higher in responders than non-responders, post-hoc analysis was performed to determine if results were driven by highly symptomatic patients. Therefore, patients with a DASS total score ⩾23 (Lovibond & Lovibond, Reference Lovibond and Lovibond1995) were assigned to the ‘high’ symptomatic group (n = 68) and those with a DASS total score <23, the relatively ‘low’ symptomatic group (n = 22). Primary measures confirmed the high symptomatic group was more anxious (17.41 ± 6.92) than the low symptomatic group (11.00 ± 6.59) [HAMA; t(88) = 3.72, p < 0.001], more depressed (12.32 ± 4.99) than the low symptomatic group (6.41 ± 4.10) [HAMD; t(88) = 5.03, p < 0.001], and endorsed more symptom severity (32.21 ± 7.17) than the low symptomatic group (14.82 ± 6.15) [DASS; t(88) = 10.21, p < 0.001].
In the high symptomatic group, independent t tests revealed responders (n = 42) and non-responders (n = 26) were equivalent in baseline anxiety [HAMA; t(66) = 1.40, p = 0.17], depression [HAMD; t(66) = 0.87, p = 0.39], and self-reported symptom severity [DASS; t(66) = 0.19, p = 0.85]. Conversely, in the smaller low symptomatic group, responders (n = 9) were more anxious (14.33 ± 4.36) than non-responders (n = 13) (8.69 ± 7.01) [HAMA; t(20) = 2.13, p = 0.045]. They were also marginally more depressed (8.44 ± 2.83) than non-responders (5.00 ± 4.34) [HAMD; t(20) = 2.09, p = 0.05] though groups were comparable in self-reported symptoms [DASS; t(20) = 1.75, p = 0.09].
Neural predictors of treatment outcome
ROC curve analysis revealed responder status was significantly predicted by more right superior occipital gyrus (SOG) engagement across all facial expressions. Beyond right SOG, 15 regions for angry(>shapes) encompassing cortical, subcortical, and visual structures predicted responder status and for happy(>shapes), bilateral middle frontal gyrus predicted responder status. See Table 3 for results for all face types.
Table 3. Receiver operating characteristic curve analysis: baseline brain response for facial expressions v. shapes in predicting treatment outcome

*p < 0.05.
Accordingly, the decision tree model comprised 16 ROIs for angry(>shapes), 1 for fear(>shapes), and 3 for happy(>shapes). Results revealed baseline activity to angry(>shapes) in right SOG (i.e. root node) classified treatment-outcome subgroups. Overall classification accuracy via 20-fold cross-validation was 70.0%. The classification was distinguished by a patient subgroup characterized by less activation [Node1: ‘low occipital’ (LO) subgroup; n = 36, 40%] and another by relatively more activation [Node2: ‘high occipital’ (HO) subgroup; n = 54, 60%]. See Fig. 2.

Fig. 2. Bar graphs illustrating patient subgroups (i.e. Node 1 ‘low occipital’, Node 2 ‘high occipital’) based on pre-treatment activation in right superior occipital gyrus to angry faces (>shapes) before and after cognitive behavioral therapy and healthy controls before and after 12 weeks. (Electronic/print version) Light blue/light gray = Node1 patients; dark blue/dark gray = Node2 patients; green/white = healthy controls; right = right hemisphere; left = left hemisphere.
Since imbalanced responder status may impact results, the responder group was randomly down-sampled to match the frequency of non-responders and the same decision tree model with the balanced data set [responders and non-responders 50% (n = 39) in each group] was repeated 10 separate times. Repeated re-classification showed only brain response to angry(>shapes) classified responder status (i.e. identified subgroups) and average accuracy was 70.1%. In this smaller sample, right SOG classified subgroups six times; left medial SFG, three times; and right amygdala classified responders once. As right SOG classified subgroups the majority of the time, subsequent analysis was limited to the LO and HO treatment-outcome subgroupsFootnote 2.
There were more responders in the HO (n = 39, 43.3%) relative to LO subgroup (n = 12, 13.3%) and among non-responders, fewer were in the HO subgroup (n = 15, 16.7%) compared to LO subgroup (n = 24, 26.7%) [χ2(1) = 13.3, p < 0.001]. Subgroups were equivalent in principal diagnosis (anxiety v. depression), baseline symptom severity (lowest p = 0.15), and demographic characteristics (lowest p = 0.09). See Table 2.
Whole-brain PPI with right SOG (11 304 mm3 in volume) as the ‘seed’ region revealed an interaction where non-responders exhibited more baseline right SOG-right postcentral functional connectivity to angry(>shapes) compared to treatment responders [(50, −12, 26), Z = 5.09, volume = 55 mm3; FWE corrected, p = 0.005] (Fig. 3). No significant results were detected when examining responders and non-responders separately.

Fig. 3. Results from whole-brain voxel-wise statistical t-map of baseline superior occipital gyrus to the postcentral gyrus during angry faces (>shapes): bar graphs show extracted measure of connectivity in responder and non-responder groups. (Electronic/print version) Dark red/dark gray = treatment responders; light red/light gray = treatment non-responders.
Test-retest reliability and healthy controls
The paired t test result with right SOG activity before and after 12 weeks was not significant in controls [t(44) = 0.56, p = 0.58] and ICC result indicated activation was moderately stable (ICC = 0.53; p = 001) (Sundvall, Ingerslev, Breth, & Kirkegaard, Reference Sundvall, Ingerslev, Breth and Kirkegaard2013).
Task performance
Regarding accuracy, the mixed ANOVA only revealed a main effect for stimulus type. Paired t tests showed all participants had higher accuracy when matching happy faces compared to fearful faces, angry faces, and shapes. Accuracy was higher for fearful faces relative to angry faces and shapes. Accuracy was higher for happy faces compared to angry faces.
For RT, the mixed ANOVA revealed main effects for stimulus type and time, which was moderated by a stimulus type × time interaction. Follow-up analysis indicated practice effects as RT was faster for all faces after 12 weeks though RT for shapes was similar over time.
Details are in online Supplementary Materials.
Classified treatment-outcome subgroups and task performance
Post-hoc linear regression analysis comprised baseline activity in right SOG to angry(>shapes) as the dependent variable. Independent variables were task performance for angry faces, shapes, and responder status (responder/non-responder).
For accuracy, the omnibus model was significant [R 2 = 0.14, F (3,86) = 4.70, p = 0.004]. More activation in SOG was predicted by less accuracy for angry faces (B = −3.07, t = −3.14, p = 0.002) but not shapes (B = 0.57, t = 0.96, p = 0.34) and there was a marginal effect for responder status (B = 0.13, t = 1.91, p = 0.06). To illustrate the relationship across patients, follow-up Pearson's correlation was conducted with angry faces controlling for shapes (i.e. residual values) (r = −0.26, p = 0.02). Figure 4 depicts scatterplot.

Fig. 4. Scatterplot depicting the relationship between baseline superior occipital gyrus activity to angry faces (>shapes) and accuracy for angry faces while controlling for shapes. Upward triangles = generalized anxiety disorder; downward triangles = major depressive disorder; diamonds = panic disorder; square = persistent depressive disorder; ovals = posttraumatic stress disorder; circles = social anxiety disorder.
The same analysis for RT was not significant [R 2 = 0.06, F (3,86) = 1.92, p = 0.13] and none of the independent variables was significant (lowest p = 0.06).
Classified treatment-outcome subgroups following treatment
Patient subgroups were equivalent in baseline symptom severity. Independent t tests with post-CBT clinical measures, controlling for baseline severity (i.e. residual values), showed the LO subgroup was more generally anxious, depressed, socially anxious, and self-reported higher symptom severity than the HO subgroup following CBT (all ps > 0.05) though no difference emerged for worry (p = 0.20).
For primary outcome measures, Pearson's correlations within subgroups showed the relative pre-to-post CBT increase in right SOG activity to angry(>shapes) in the LO subgroup correlated with a greater pre-to-post decrease in anxiety symptoms (HAMA) (r = 0.34, p = 0.04). However, results did not survive correction for multiple comparisons. Results were not significant for depression (HAMD) or self-reported symptoms (DASS) (lowest p = 0.26). No associations with symptom change were observed in the HO subgroup (lowest p = 0.34).
For comprehensiveness, we evaluated laterality even though right SOG was the classifier. Findings are summarized below and statistics are reported in online Supplementary Materials due to space constraints. A 3 (Group: LO subgroup, HO subgroup, healthy controls) × 2 (Hemisphere: left, right) × 2 (Time: week 0, week 12) mixed ANOVA revealed a main effect for group and hemisphere but no main effect for time. There was a significant group × time interaction and group × hemisphere interaction but no other interactions.
Regarding the group main effect, the LO subgroup exhibited significantly less bilateral SOG activation at baseline than the HO and control groups and the HO subgroup demonstrated significantly more activation at baseline than the LO and control groups. The group × time interaction displayed the same group effects at baseline, however, after 12 weeks, there was no difference in bilateral SOG activity between patient subgroups and controls. Nonetheless, the LO subgroup continued to exhibit less SOG activity than the HO subgroup following CBT. See Fig. 2.
Concerning laterality findings, all participants showed more activation in the right relative to left SOG across time. Regarding the group × hemisphere interaction, the LO subgroup exhibited less left SOG activity than the HO subgroup and controls. However, there was no difference between the HO subgroup and controls. The same pattern was observed in right SOG with the exception the HO subgroup showed more activity than controls across time. See online Supplementary Material for details.
Discussion
The primary objective of the current study was to identify treatment outcome subgroups characterized by baseline differences in brain response to emotional faces in anxious or depressed patients. On average, patients exhibited a decrease in illness severity and the majority of patients (i.e. 56.7%) responded to CBT. ROC curve results revealed more pre-CBT activation to angry faces(>shapes) in an array of regions predicted better CBT outcome. Fewer neural predictors were observed for fearful(>shapes) and happy(>shapes). Decision tree results indicated right SOG engagement to angry expressions best distinguished patients who responded to CBT from those who did not. Behavioral findings confirmed all participants followed directions as accuracy ranged from ~85% for angry faces to 96% for happy faces.
Since treatment responders had higher levels of baseline anxiety and depression than non-responders, post-hoc analysis was performed where patients were assigned to ‘high’ and ‘low’ symptomatic groups. Results showed baseline anxiety and depression levels were equivalent between responders and non-responders in the high, but not low, group. Therefore, brain-based predictors of successful CBT (yes/no) were not likely robustly attributed to baseline symptom severity.
As hypothesized, ROC curve analysis demonstrated greater baseline activation to emotional faces in patients predicted responder status though angry faces engaged visual, subcortical, and cortical regions. Conversely, ROC curve analysis for happy faces was limited to right SOG and bilateral middle frontal gyrus; for fearful faces, only right SOG served as a predictor. The common right SOG finding suggests variance in a visual area, regardless of the socio-emotional cue, was a consistent predictor. The ipsilateral finding along with greater baseline activation in right compared to left SOG, in general, may reflect the involvement of the right hemisphere in processing facial expressions (Adolphs, Damasio, Tranel, & Damasio, Reference Adolphs, Damasio, Tranel and Damasio1996).
Decision tree results revealed right SOG activity for angry expressions identified distinct groups where CBT responders were characterized by relatively more baseline activity in right SOG and in non-responders, less activity in right SOG; average accuracy was 70%. When randomly down-sampling to match the frequency between responders and non-responders and repeating analysis 10 times, results were limited to angry faces; average accuracy was 70.1% signifying the initial classification was not driven by uneven group sizes.
In the smaller down-sampled cohorts, right SOG activity to angry faces classified responder status the majority of the time though baseline activation in medial SFG and amygdala to angry expressions also classified responder status. The medial portion of SFG plays a role in executive functions (e.g. goal-directed cognitive tasks; Li et al., Reference Li, Qin, Liu, Fan, Wang, Jiang and Yu2013; Sundermann, & Pfleiderer, Reference Sundermann and Pfleiderer2012) and the amygdala is central to emotion processing (Davis & Whalen, Reference Davis and Whalen2001). Engagement of these regions along with SOG is in line with evidence large-scale distributed networks support emotion recognition (Liang et al., Reference Liang, Liu, Li and Wang2018). The inconsistency may relate to variance in interconnections among regions in the smaller samples. Accordingly, CBT responders may be characterized by more baseline activity to angry faces in regions that underlie diverse functions though large samples are needed to test this hypothesis.
Behaviorally, baseline accuracy for emotional faces was the lowest and RT slowest for angry faces compared to other faces across participants. The task requires discrimination between a face congruent to the target face and an incongruent neutral face. Results suggest discriminating between congruent angry faces and incongruent neutral faces was more difficult than distinguishing congruent fearful or happy faces from incongruent neutral faces.
Neutral faces may not necessarily be perceived as neutral; they have been viewed as angry based on physical characteristics (e.g. the vertical distance between the eyes, nose, and mouth; Neth & Martinez, Reference Neth and Martinez2009) and emotions inferred by neural expressions may relate to judgements of traits such as dominance (Hester, Reference Hester2019; Willis & Todorov, Reference Willis and Todorov2006), a characteristic of angry faces (Knutson, Reference Knutson1996). Also, regression analysis showed lower accuracy for angry faces, but not shapes, corresponded with more SOG engagement.
Greater SOG activity may relate to a tendency to misinterpret neutral expressions for angry expressions. Alternatively, lower task performance may pertain to anger as a social threat signal, which is frequently avoided as demonstrated in convenience samples (e.g. shorter gaze behavior on angry face features, withdrawal behavior; Hunnius, de Wit, Vrins, & von Hofsten, Reference Hunnius, de Wit, Vrins and von Hofsten2011; Veenstra, Schneider, Bushman, & Koole, Reference Veenstra, Schneider, Bushman and Koole2017). Since the task was not designed to disambiguate brain and behavioral response to angry and neutral faces as they were part of the same image, follow-up studies are necessary to test these conjectures.
Exploratory PPI results showed the classifier region, right SOG, modulated postcentral gyrus. The postcentral gyrus is a major cortical hub that constitutes the somatosensory cortex (Iwamura, Reference Iwamura1998), is functionally connected to other cortical structures including occipital cortices (Tomasi & Volkow, Reference Tomasi and Volkow2011), and is proposed to facilitate emotion recognition by linking the emotional content of faces with bodily state (i.e. somatic representations of emotions; Kragel & LaBar, Reference Kragel and Labar2016). Compared to non-responders, responders represented more SOG activity and exhibited less occipital-postcentral functional coupling to angry expressions. Together with reduced accuracy for angry faces, relatively less SOG-postcentral gyrus connectivity in responders may reflect reduced efficiency or specificity of neural response to angry faces.
Our hypothesis that treatment-outcome subgroups would cut across diagnostic status (principal anxiety v. depressive disorders) was supported. Concerning clinical findings, the ‘high occipital’ (HO) subgroup was less symptomatic than the ‘low occipital’ (LO) subgroup following CBT according to primary clinical measures. The HO relative to LO subgroup was also less socially anxious though the level of worry was equivalent between subgroups. Findings suggest a phenotype involving social fears may interact with CBT.
Regarding the change in activation, SOG activity to angry faces in the subgroups following CBT was comparable to controls who demonstrated moderately stable SOG activation over the course of 12 weeks. Though results indicate SOG underlies improvement, correlational findings do not support such a role. Baseline SOG activity to angry faces appears to classify responder status but may not play an important mechanistic role.
Findings need to be interpreted with caution given limitations. The study was not designed to distinguish patients from healthy controls, therefore, differences in neural activity between patients and controls do not infer abnormal activation. The majority of patients had different anxiety disorders and social anxiety was the most prevalent. Different anxiety disorders are characterized by common and distinct reactivity to emotional expressions (Fonzo et al., Reference Fonzo, Ramsawh, Flagan, Sullivan, Letamendi, Simmons and Stein2015). If classifiers interact with facial expressions, results may not generalize to samples with different clinical characteristics including a depression-only sample. Reliability in neuroimaging data is a concern (e.g. Infantolino, Luking, Sauder, Curtin, & Hajcak, Reference Infantolino, Luking, Sauder, Curtin and Hajcak2018; Nord, Valton, Wood, & Roiser, Reference Nord, Valton, Wood and Roiser2017); neural predictor findings that have low temporal stability reduces its function as a predictor. There was no waitlist control or psychological placebo arm, therefore, time may have contributed to changes in neural activity rather than CBT. Results may not be specific to CBT as there was no other treatment modality. Responder does not infer remission and we cannot exclude possible regression to the mean. Treatment fidelity measures were not collected; therefore, we cannot confirm clinicians adhered to CBT protocol. The sample size was relatively small for a data-driven approach and it will be important to test classification accuracy in an unrelated sample. Findings were constrained to certain expressions; other facial expressions may yield different results. Lastly, neural predictors were based on a priori regions of interest; other structures may predict CBT outcome.
Despite limitations, findings indicate neural engagement during emotion recognition predicts treatment responders. Neural, behavioral, and functional connectivity results suggest a phenotype characterized by occipital engagement, potentially reflecting reduced efficiency or specificity when discerning angry from neutral faces, may benefit from CBT.
Supplementary material
The supplementary material for this article can be found at https://doi.org/10.1017/S0033291720003979
Acknowledgements
This work was supported by grants from the National Institutes of Health, National Institute of Mental Health (KLP MH101497; HK MH112705; HK MH093679); Brain & Behavior Research Foundation (HK), and the Center for Clinical and Translational Research (CCTS) UL1RR029879.
Conflict of interest
Heide Klumpp has no conflicts of interest to disclose. Jagan Jimmy has no conflicts of interest to disclose. Katie L. Burkhouse has no conflicts of interest to disclose. Runa Bhaumik has no conflicts of interest to disclose. Jennifer Francis has no conflicts of interest to disclose. Michelle G. Craske has no conflicts of interest to disclose. K. Luan Phan has no conflicts of interest to disclose. Olusola Ajilore has no conflicts of interest to disclose.
Ethical standards
All participants completed a written informed consent form approved by the local Institutional Review Board at the University of Illinois at Chicago. All participants were compensated for their time. The authors assert that all procedures contributing to this work comply with the ethical standards of the relevant national and institutional committee on human experimentation with the Helsinki Declaration of 1975, as revised in 2008.


