


Introduction
A growing literature has found that depression is associated with impaired cognitive functioning (Snyder, Reference Snyder2013). For example, broad deficits in neuropsychological functioning have been demonstrated in a number of reviews and meta-analyses on depression (Christensen et al. Reference Christensen, Griffiths and Mackinnon1997; Rogers et al. Reference Rogers, Kasai, Koji, Fukuda, Iwanami, Nakagome, Fukuda and Kato2004; Snyder, Reference Snyder2013; Rock et al. Reference Rock, Roiser, Riedel and Blackwell2014), and cognitive deficits have been found to correlate with symptom severity (McDermott & Ebmeier, Reference McDermott and Ebmeier2009). Theoretical models have been proposed suggesting that cognitive dysfunction could either be a risk factor for later depression or that cognitive function may be impaired as a result of depression (Stern, Reference Stern2003; Barnett et al. Reference Barnett, Salmond, Jones and Sahakian2006). In support of the latter hypothesis, two recent meta-analyses concluded that the deficits in cognitive function persist after remission from depression (Bora et al. Reference Bora, Harrison, Yücel and Pantelis2013; Rock et al. Reference Rock, Roiser, Riedel and Blackwell2014). However, evidence showing that deficits in cognitive function persist after remission from depression, which are primarily derived from cross-sectional studies, does not rule out the possibility that poor cognitive function preceded the onset of depression. The present review and meta-analysis sought to comprehensively summarize the state of the research on cognitive function and its association with future depressive symptoms using data from longitudinal studies.
While the clinical diagnosis of depression is relatively codified according to DSM and ICD criteria, and depression symptoms are readily measured with a number of validated instruments (Lewinsohn et al. Reference Lewinsohn, Solomon, Seeley and Zeiss2000; Cuijpers et al. Reference Cuijpers, de Graaf and van Dorsselaer2004), a similar canonical approach to measuring cognitive function is not present. Thus, it is important to specify a working definition of cognitive function before examining its possible association with depression. Empirical work has reinforced the concept of a single construct of cognitive function through high correlations in performance among disparate cognitive tasks (Spearman, Reference Spearman1904). This has led to the derivation of a single factor representing general cognitive function or ability known as ‘g’ (Johnson et al. Reference Johnson, Bouchard, Krueger, McGue and Gottesman2004). The ‘g’ factor is commonly determined by administering a wide range of tasks and using factor analysis to determine the shared variance across these tasks (Ree & Earles, Reference Ree and Earles1991). Even in cases when ‘g’ is not calculated as such, there are other customary ways of capturing this general factor by combing across cognitive tasks, e.g. by creating an index of executive functions (Miyake et al. Reference Miyake, Friedman, Emerson, Witzki, Howerter and Wager2000) or measuring the intelligence quotient (Gottfredson, Reference Gottfredson1997).
Although executive functions and intelligence are often considered independently, evidence has suggested that they may best be characterized by an integrated framework based on a common neural network (Barbey et al. Reference Barbey, Colom, Solomon, Krueger, Forbes and Grafman2012), supporting the idea that they reflect a shared general factor of cognitive ability. In light of these findings and the observation that individuals with depression commonly exhibit deficits across a range of cognitive tasks, our review used the broadest measure of cognitive function that was available in a given study. When a higher-order construct was not available, results from individual measures were used. We restricted analyses to prospective cohort studies with depression assessment before age 65 in order to minimize potential influences of age-related cognitive decline.
We follow our literature review with a quantitative meta-analysis to (1) determine whether cognitive function predicts later depression, (2) evaluate whether differences in the measurement of depression (categorical v. continuous) influence observed associations, and (3) examine whether sex or age of participants may moderate effects, and (4) whether effects are confounded by depression symptoms at baseline.
Methods
We followed the Meta-Analyses of Observational Studies in Epidemiology (MOOSE) guidelines (Stroup et al. Reference Stroup, Berlin, Morton, Olkin, Williamson, Rennie, Moher, Becker, Sipe and Thacker2000) (Supplementary Table S1) and the literature search strategies suggested by Atkinson et al. (Reference Atkinson, Koenka, Sanchez, Moshontz and Cooper2014).
Table 1. Characteristics of included studies
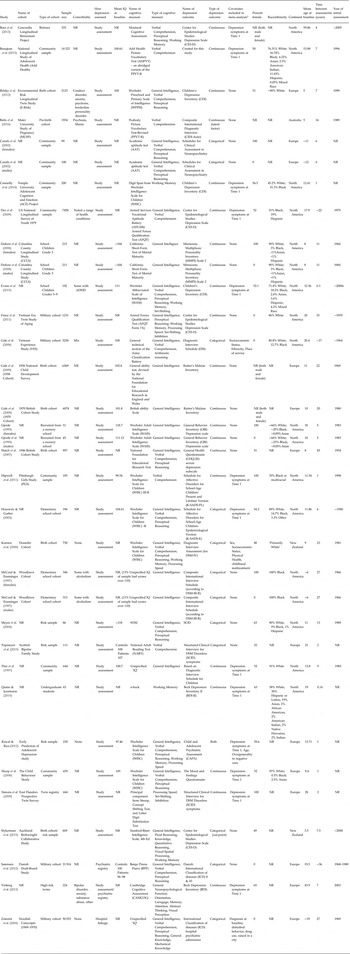
Sample size is the number of subjects included in reported analyses of interest. NR, not reported. ~ indicates only a range was reported.
a This column notes covariates included in the meta-analysis. We focused on controlling for depressive symptoms at T1, but some studies reported effect sizes that also included controlling for other variables – when the zero-order correlations were unavailable, these estimates were used.
Search process
Systematic searches were conducted in February 2015, and updated in December 2015 in three electronic databases: PubMed, EMBASE and PsycINFO. Searches were conducted by a research librarian, E.M., and overseen by M.S. The search syntax was adapted for each database and designed to capture the participants, predictors, comparisons and outcomes described below, according to the PICOS framework (Moher & Liberati, Reference Moher and Liberati2009). The Boolean operator ‘OR’ was used within categories and the operator ‘AND’ was used between categories. The complete search strategy is described in the Search Strategy in the Supplementary Material. Hand searches were conducted of the reference lists of included articles.
Eligibility criteria
The review included English language studies of empirical studies investigating the longitudinal association of cognitive function (IQ, neuropsychological tests, executive functions) with unipolar depression diagnosis or symptoms. Detailed inclusion/exclusion criteria were as follows:
Participant characteristics
Eligible studies included children, adolescents and adults under the age of 65. This age range was specified because of the possible impact of cognitive decline in older populations. Articles examining a highly specific population (e.g. with a particular medical diagnosis) were excluded so as to not limit the generalizability of results. Studies that required MDD diagnosis, hospitalization or admission to a treatment center as part of the inclusion criteria at baseline were also excluded from the review so as to permit conclusions about depression onset. This was to ensure that a majority of study participants did not have depression at baseline. However, cohort studies were included even if they did not measure depression at baseline, assuming that these samples would have depression prevalence rates that were comparable to population norms. Subgroup analyses were subsequently performed on the studies that specifically excluded for any history of depression. If there were several papers about one cohort, the paper with larger sample size or better study quality was included.
Predictor type
Eligible studies included a measure of cognitive, executive or neuropsychological function. The study included a range of cognitive predictors, given that previous studies have found broad deficits in cognitive function in depression (Christensen et al. Reference Christensen, Griffiths and Mackinnon1997; Rogers et al. Reference Rogers, Kasai, Koji, Fukuda, Iwanami, Nakagome, Fukuda and Kato2004; Snyder, Reference Snyder2013; Rock et al. Reference Rock, Roiser, Riedel and Blackwell2014). When more than one cognitive predictor was reported as an outcome in a study, the broadest measure of cognitive functioning was used. If no measure captured broad cognitive functioning, the measure that was most closely aligned with constructs on a standard IQ test (working memory, processing speed, verbal comprehension, or perceptual reasoning) was used in the meta-analysis.
Studies were excluded if cognitive function was assessed via educational achievement, given that these measures can be more easily influenced by learning disabilities than by general cognitive functioning (Siegel, Reference Siegel1999). Self-report descriptive measures of cognitive functioning were also excluded in favor of more objective measures. Last, since this study sought to investigate general information processing abilities rather than cognitive attributional style, studies with cognitive attribution measures as the sole cognitive measure were excluded.
Comparisons
Search terms used to indicate the possible association between cognitive function and depression included: risk, premorbid, prodromal, onset, predict and association (for a full list, see search terms in the Supplementary Material). When data were reported from multiple time-points, the analysis accounting for the longest time between assessments was used.
Outcomes
Eligible studies reported depression diagnosis or symptoms determined by investigator or self-report. Presence of comorbidity was permitted given that depression has been found to be highly comorbid with other disorders (Melartin et al. Reference Melartin, Rytsälä, Leskelä, Lestelä-Mielonen, Sokero and Isometsä2002; Kessler et al. Reference Kessler, Berglund, Demler, Jin, Koretz, Merikangas, Rush, Walters and Wang2003). Articles not adequately specifying how depression was assessed or articles that did not uniquely measure depression [i.e. only had an index of ‘mental disorders’ or the category of ‘mood disorders’ lumped together (Gale et al. Reference Gale, Batty, Tynelius, Deary and Rasmussen2010)], were excluded if no unique measure of depression could be obtained from study authors. This is because, although comorbidity was permitted, these could have represented instances of pure anxiety disorders with few or no depressive symptoms or instances of bipolar disorder.
Study design
Eligible study search terms included: cohort studies, longitudinal, epidemiological, prospective, retrospective, follow-up or case-control studies. Studies not following a longitudinal design were excluded during full-text review. Additionally, studies where cognitive function was assessed only concurrently with or after depression were excluded, given that the purpose of the review was to investigate whether cognitive function predicted later depression.
Studies were included regardless of whether they were reported in peer-review journals in order to account for potentially biased reporting of results. Review articles were included in the search terms to find additional relevant references, but were not included in the meta-analysis. Baseline and protocol studies without follow-up data were excluded.
Study selection
A flow diagram of the process of study selection shows the overall procedures (Fig. 1). Records identified from the search processes were combined in EndNote software version X7 and duplicates were removed. Titles and abstracts were reviewed independently by two reviewers (M.S. and A.P.) according to the eligibility criteria described above, and marked as either potentially eligible or not eligible. If either author marked an article as potentially eligible, it was included in the full-text review for closer examination by M.S. and A.P., who used an electronic form to indicate if an article should be included or excluded in the final selection. When an article was excluded, the reason for exclusion was selected from a hierarchical list of exclusion criteria presented in Fig. 1. Both M.S. and A.P. were initially blinded to the other's decisions. After both M.S. and A.P. completed their reviews, discrepancies about whether a study should be included or excluded were resolved via discussion and consensus amongst M.S., A.P., T.M., A.H., and T.S.

Fig. 1. Flow diagram of the search process.
Data extraction
Study information was extracted independently by M.S. and A.P. using an electronic form created for this study. Information was collected and coded based on report characteristics, participant characteristics, study setting, predictors, outcome measures and quality assessment (Cooper, Reference Cooper2010). Any discrepancies (approximately 3% of data points) were resolved via consensus.
For studies with categorical depression diagnoses, effect sizes were generally presented as odds ratios. For these studies, the odds ratio plus the upper and lower bound of the confidence interval were recorded. Two of the studies (Zammit et al. Reference Zammit, Allebeck, David, Dalman, Hemmingsson, Lundberg and Lewis2004; Gale et al. Reference Gale, Deary, Boyle, Barefoot, Mortensen and Batty2008) reported odds ratios greater than one to indicate that lower IQ was associated with greater risk of depression. The other studies reported odds ratios in the reverse, leading to odds ratios less than one for the same direction of the effect. Therefore the odds ratios from the first two studies were recalculated by dividing (1/odds ratio). Another study (McCord & Ensminger, Reference McCord and Ensminger1997) reported results from chi-squared tests. Additional studies reported mean premorbid IQ scores rather than odds ratios, in which case the means, sample sizes and/or p values and number of tails of the t test were utilized to calculate the effect size.
For studies in which depression was measured as a continuous variable, effect sizes were presented as correlation coefficients. The direction of the effect (positive or negative) and the sample size were also extracted to be used in the meta-analysis. Two studies reported only beta weights (Simons et al. Reference Simons, Jacobs, Derom, Thiery, Jolles, van Os and Krabbendam2009; Rawal & Rice, Reference Rawal and Rice2012) and we were not able to obtain zero-order correlations from the authors. Given that previous reports have suggested that beta weights can be used as an estimate of correlation coefficients in meta-analysis (Peterson & Brown, Reference Peterson and Brown2005), the beta weights were used instead, and analyses were run both including and excluding these data points.
When insufficient information was presented in the article, authors were contacted requesting further detail. An additional six studies were included at this point. One study (Hatch et al. Reference Hatch, Jones, Kuh, Hardy, Wadsworth and Richards2007) included effect sizes for the female half of the cohort and did not provide statistics for the males, but did indicate a null effect. Only women from this study were included in the meta-analyses, but imputing a score of 0 for the males yielded similar overall results.
Follow-up analyses directly compared studies that reported zero-order correlations between IQ at time 1, depression at time 1 and depression at time 2 (additional details described in the Supplementary Methods).
Statistical methods
Data were analyzed using Comprehensive Meta-Analysis software version 3.0 (Biostat Inc., USA). A random-effects model was used for expected heterogeneity across studies. A random-effects model also allows for broader generalization of results to the population at large. Heterogeneity of effects was calculated using the Q statistic, where a significant p value indicates that true effect varies across studies. The I 2 statistic was used to calculate the ratio of the true heterogeneity to total variation, acting as an index of signal-to-noise ratio. When I 2 is large, it is has been recommended to consider subgroup analysis or meta-regression to account for the variance (Borenstein et al. Reference Borenstein, Hedges, Higgins and Rothstein2011).
Subgroup analyses were conducted using a mixed-effects analysis in which a random effects model was used to combine studies within each subgroup, and a fixed effect model was used to combine subgroups and yield the overall effect (the study-to-study variance is not assumed to be the same for all subgroups). Subgroup analyses were conducted comparing type of outcome (continuous v. categorical), broad v. specific cognitive measures, and outcomes that were adjusted v. unadjusted for baseline depression symptoms.
Meta-regression was performed using the following variables on unadjusted analyses: age at baseline, age at follow-up, time between assessments, IQ, percent white, year of cognitive assessment, year of follow-up assessment, percent female, and study quality score.
Study quality and publication bias
Study quality was evaluated independently by M.S. and A.P. using a checklist adapted from Luppino & Wit (Luppino et al. Reference Luppino, de Wit, Bouvy, Stijnen, Cuijpers, Penninx and Zitman2010). The checklist contained 12 items and studies were rated with a ‘+’ if it met criteria for that item, a ‘−’ if it did not meet criteria for an item, and a ’?’ if unclear. ‘+’ were coded as a score of 1 and −/? were coded as a score of 0. Total scores and percentages were calculated. Articles with total scores of 0–3 were considered to be of low quality, scores of 4–7 were considered a medium quality, and scores of 8–12 were considered to be of high quality. Any discrepancies (approximately 3% of data points) were resolved via consensus.
Publication bias was assessed using a funnel plot, which presents study size on the vertical axis (as standard error, in this case) as a function of effect size on the x-axis. When no publication bias exists, the studies should be distributed symmetrically about the combined effect size (Borenstein et al. Reference Borenstein, Hedges, Higgins and Rothstein2011). If evidence of publication bias was observed, Duval & Tweedie's trim-and-fill method was used (Duval & Tweedie, Reference Duval and Tweedie2000), which recalculates effects based on imputing data from studies that are likely to be missing. Last, the Fail-safe N was calculated (Cooper, Reference Cooper1979), which indicates the number of missing studies that would need to exist to nullify the observed effect.
Results
A flow diagram of the search process is shown in Fig. 1. The search identified 2773 records through PubMed, 2158 through EMBASE and 1345 through PsycINFO, for a total of 6276 records. Duplicate records (1709) were removed in EndNote, resulting in 4567 unique records. After title and abstracts were reviewed, 329 records were identified as potentially eligible for the meta-analysis. These 329 records were reviewed in full and 300 articles were excluded hierarchically if they were: a review, baseline or protocol paper (n = 6), if the sample had a mean age over 65 at the depression assessment (n = 41), if the sample had a specific medical illness (n = 23), if the study was not a longitudinal design (n = 19), if MDD diagnosis, hospitalization or admission to treatment center was part of the inclusion criteria of the study (n = 18), if cognitive function was assessed only concurrently with or after depression (n = 36), if cognitive function was assessed by educational achievement or self-report (n = 26), if cognitive function was assessed by attribution style rather than neuropsychological measure (n = 7), if there was no measure of cognitive function (n = 18) or no uniquely measured depression outcome (n = 24). Furthermore, if articles reported on the same sample as another article with higher quality or more information, the duplicate articles were excluded (n = 8). Last, a number of studies appeared to measure both cognitive function and depression, but did not report enough information to be included in the meta-analysis and did not respond to requests for additional information (n = 74, approximately 59 unique samples). In total, 29 publication were included in the meta-analysis, comprising 34 samples (one study included two separate birth cohorts and another four reported data separately for men and women).
Study characteristics
The characteristics of included samples are detailed in Table 1. Sample sizes ranged from 43 to 50 053 with a median of 339.5. The most common types of samples were school samples (9/34), community samples (8/34), and birth cohorts (7/34). The samples were majority white, with two samples having exclusively black participants. Additionally, eight samples were men only, six samples were women only, and the rest reported combined effect sizes. Mean age of participants at baseline ranged from 3.5 to 59 years with a median of 12 years. Most samples did not report whether comorbid diagnoses were present (23/34).
Of the 74 papers excluded for having insufficient information (representing 60 unique samples), the median number of subjects was not statistically different between those studies and the studies included in the meta-analysis (n = 288 and n = 339.5, respectively, p = 0.19), nor did the average age of study participants at baseline statistically differ (median across studies = 11 v. 12, respectively, p = 0.57). The types of cognitive measures used were also similar across the excluded and included studies, with the most common measure being IQ (28/60 and 20/29), followed by Verbal Comprehension (8/60 and 5/29).
Meta-analysis
The overall analysis yielded a significant association between cognitive function and subsequent depression outcomes [r = −0.088, 95% confidence interval (CI) −0.121 to −0.054, p < 0.001; Fig. 2]. Results were similar when excluding the two studies that used beta-weights (r = −0.071, 95% CI −0.100 to −0.042, p < 0.001) or when using episodic memory in place of processing speed in a study reporting both outcomes (r = −0.085, 95% CI −0.118 to −0.051, p < 0.001). Follow-up analyses were conducted in the sample of studies reporting educational attainment and self-report outcomes (Supplementary Table S2). Heterogeneity across samples was significant (Q = 801.54, p < 0.001), suggesting substantial variation across the individual samples. The ratio of the true heterogeneity to total variation was large (I 2 = 95.88%). I 2 is on a relative scale and values close to 100 indicate that most of the observed variance is real rather than spurious and suggests that subgroup analyses or meta-regression may help to explain this variability (Borenstein et al. Reference Borenstein, Hedges, Higgins and Rothstein2011).

Fig. 2. Meta-analysis of the association between cognitive function and subsequent depression. A forest plot for all studies that investigated associations between cognition and later depression. Results are reported as correlation coefficients denoted by squares, and 95% confidence intervals (CI) indicated by lines (effect sizes are converted to correlation coefficients if reported as odds ratios). Meta-analysis results are displayed as the diamond. The overall analysis found a significant effect of cognition on depression (r = −0.088, 95% CI −0.121 to −0.054, p < 0.001).
Subgroup analyses and meta-regression
A significant difference was found between categorical and continuous effect sizes (p < 0.001). The studies assessing continuous outcomes were found to have a larger effect (r = −0.121, 95% CI −0.168 to −0.073, p < 0.001, n = 22) than studies assessing categorical outcomes (r = −0.035, 95% CI −0.054 to −0.017, p < 0.001, n = 12). No differences were observed between studies utilizing broad v. specific cognitive measures (p = 0.57).
Outcomes were also compared adjusting for baseline depression symptoms at the time of cognitive assessment. Nine studies provided enough detail to calculate the partial correlation coefficients adjusting for baseline depression symptoms. Using the partial correlation coefficients led to a null result (r = −0.032, 95% CI −0.078 to 0.014, p = 0.169; n = 9, Fig. 3). The null result does not seem to be due to a lack of power because using the unadjusted correlation coefficients for the same nine studies still led to a significant result (r = −0.120, 95% CI −0.169 to −0.070, p < 0.001, n = 9; Fig. 3). As a follow-up, the difference in effect sizes between the adjusted and unadjusted values for these 9 studies were tested (r = 0.082, 95% CI 0.069–0.095, p < 0.001, n = 9), suggesting that the effects are significantly different when directly comparing the values that do and do not control for baseline depression symptoms.

Fig. 3. Meta-analysis comparing values adjusted for baseline depression symptoms v. unadjusted. A forest plot for analysis comparing results from a subset of the same set of studies reported in Fig. 2 when using unadjusted values compared to using values that are adjusted for baseline depression. Effects are significant for unadjusted values [r = −0.120, 95% confidence interval (CI) −0.169 to −0.070; p < 0.001], but not for adjusted values (r = −0.032, 95% CI −0.078 to 0.014, p = 0.169). Results are reported as correlation coefficients denoted by squares, and 95% CIs indicated by lines. Meta-analysis results are displayed as diamonds.
Expanding the subgroup analyses to include studies that controlled for baseline depression plus other covariates (Zammit et al. Reference Zammit, Allebeck, David, Dalman, Hemmingsson, Lundberg and Lewis2004; Simons et al. Reference Simons, Jacobs, Derom, Thiery, Jolles, van Os and Krabbendam2009; Rawal & Rice, Reference Rawal and Rice2012), and studies that explicitly excluded for a history of depression diagnosis (Gale et al. Reference Gale, Deary, Boyle, Barefoot, Mortensen and Batty2008; Vinberg et al. Reference Vinberg, Miskowiak and Kessing2013; Papmeyer et al. Reference Papmeyer, Sussmann, Hall, McKirdy, Peel, Macdonald, Lawrie, Whalley and McIntosh2015), did not change the null result (r = −0.027, 95% CI −0.058 to 0.005, p = 0.097; n = 15).
None of the meta-regression analyses were significant, indicating that the between-study variance was not attributable to age at baseline, IQ, percent of sample that was female, percent of the sample that was white, age at follow-up, time between assessments, year of cognitive assessment, year of follow-up assessment, or study quality score.
Study quality and publication bias
Multiple samples within a study were combined for the purposes of quality assessment, given that studies within the same publication were found to employ the same methodology. Of the 29 publications reviewed, 12 were rated as high quality and 17 were rated as medium quality. Details are provided in Supplementary Table S1. Comparable results to the overall findings were obtained when just using high quality studies (r = −0.085, 95% CI −0.141 to −0.029, p = 0.003).
Inspection of the funnel plot (Fig. 4) found no evidence for publication bias to support the hypothesis. In fact, imputation of negative correlations suggested that additional studies favoring the hypothesis may be missing. While the calculated effect size is −0.088 (95% CI −0.121 to −0.054), using Duval & Tweedie's trim-and-fill method, the imputed effect size estimate is larger at −0.137 (95% CI −0.176 to −0.099, imputed studies n = 11). Last, the Fail-safe N procedure found that 3583 null studies would need to be located for the combined two-tailed p value to exceed 0.05. This suggests that significant results are not likely to be confounded by publication bias and may even underestimate true effect sizes.

Fig. 4. Trim-and-fill funnel plots for all samples. Fisher's Z, a measure of effect size, is plotted on the x-axis and the standard error is plotted on the y-axis. Larger studies appear toward the top of the graph and smaller studies towards the bottom. In the absence of publication bias, the studies are symmetrically distributed around the mean. Actual studies are shown in open circles and imputed studies would be shown in black circles. No additional studies would be expected in the opposite direction (to the right) of the observed effect, but an additional 11 studies are imputed to the left of the mean effect size. While the calculated effect size is −0.088 [95% confidence interval (CI) −0.121 to −0.054], using Duval & Tweedie's trim-and-fill method, the imputed effect size estimate is larger at −0.137 (95% CI −0.176 to −0.099; imputed studies n = 11).
Discussion
The present systematic review and meta-analysis of 29 longitudinal publications, including 1 21 749 participants, revealed that after accounting for baseline depression symptoms, variability in cognitive function did not predict subsequent depression. Consistent with prior reports, there was a significant contemporaneous association between higher depression symptoms and lower cognitive function. These patterns have implications for understanding the association between cognitive function and depression and may be important for advancing etiologic and treatment research.
First, our findings reinforce models positing that cognitive function tracks with depression severity (McDermott & Ebmeier, Reference McDermott and Ebmeier2009). One possible explanation for this contemporaneous association is that depression symptoms interfere with the capacity to complete cognitive assessments, possibly through the general lack of motivation that is one hallmark of the disorder. While this explanation represents an experimental confound for studies focused on assessment of cognitive function, it likewise represents an opportunity for studies to focus more comprehensively on the assessment of both depression and mood disorder symptoms, since performance on cognitive tests may be a sensitive measure of motivational state that could augment self-reported symptoms. Alternatively, the co-occurrence of cognitive deficits and depression symptoms may reflect shared genetic etiology (Hagenaars et al. Reference Hagenaars, Harris, Davies, Hill, Liewald, Ritchie, Marioni, Fawns-Ritchie, Cullen, Malik, Worrall, Sudlow, Wardlaw, Gallacher, Pell, McIntosh, Smith, Gale and Deary2016) and dysfunction of neural circuits supporting both cognitive and emotional processes (Scult et al. Reference Scult, Knodt, Swartz, Brigidi and Hariri2016). In particular, dysfunction of prefrontal and striatal circuits have been associated with both depression and cognitive function (Keedwell et al. Reference Keedwell, Andrew, Williams, Brammer and Phillips2005; Aarts et al. Reference Aarts, van Holstein and Cools2011).
Second, our findings suggest that prior studies of links between cognitive function and depression that did not assess baseline symptoms may have overestimated the potential protective role of higher cognitive function. While the importance of accounting for subclinical symptoms is not novel, the implementation of such accounting is often neglected in psychiatric epidemiology, given the current categorical, threshold-based diagnostic system. In our meta-analysis, larger effects were observed for continuous as compared to categorical outcomes, which aligns with growing emphasis on dimensional measures of psychopathology (Cuthbert & Kozak, Reference Cuthbert and Kozak2013).
Third, the associations between cognitive function and either current or later depression were not moderated by data quality or participant age, sex, and race. However, there are a number of additional potential moderators that could not be addressed in the current review and meta-analysis. For example, the number and type of comorbid conditions with depression were often not reported in the included studies, but could represent an important moderator of the observed effects. Modeling the effects of comorbid illness is an important avenue for future research.
One limitation of the current literature is that only a handful of studies reviewed explicitly excluded for depression diagnosis at baseline (Gale et al. Reference Gale, Deary, Boyle, Barefoot, Mortensen and Batty2008; Vinberg et al. Reference Vinberg, Miskowiak and Kessing2013; Papmeyer et al. Reference Papmeyer, Sussmann, Hall, McKirdy, Peel, Macdonald, Lawrie, Whalley and McIntosh2015); however, consistent with the finding that controlling for baseline depression symptoms led to a null association between cognition and subsequent depression, there was no effect observed when including these studies in the subgroup analyses, further suggesting that the association between cognitive function and depression is likely contemporaneous. It will be important to follow-up these analyses with individual studies that include rigorous assessment of baseline depression symptoms and other potentially confounding factors to further clarify this relationship.
An open question that remains for future research is whether deficits in cognitive function are likely to predict the development of more sever or recurrent depression later in life. Only one of the included studies (Koenen et al. Reference Koenen, Moffitt, Roberts, Martin, Kubzansky, Harrington, Poulton and Caspi2009), specifically investigated recurrent depression and found that lower IQ was associated with greater persistence of disorder.
A final consideration is that while our review and meta-analysis focused on general cognitive function mainly assessed via IQ, there may be specific subtypes of cognitive function that are more predictive of later depression. For example, a lack of cognitive flexibility may more closely match with the ruminative style characteristic of depression, and therefore tasks specifically measuring this component of cognitive function might have some predictive utility. While our review did not find differences between broad and specific measures of cognitive function, there were not enough studies identified to allow for precise consideration of differences between individual cognitive domains.
A limitation of the meta-analysis is that while the present study followed standard guidelines (Stroup et al. Reference Stroup, Berlin, Morton, Olkin, Williamson, Rennie, Moher, Becker, Sipe and Thacker2000; Atkinson et al. Reference Atkinson, Koenka, Sanchez, Moshontz and Cooper2014), decisions about study selection, data extraction, and quality assessment, include a number of decision points that necessarily involve a level of subjectivity. Reliability was ascertained by using independent raters, however, different inclusion/exclusion criteria or a different approach to the evaluation of those criteria, could result in a different set of studies being included. Ultimately, the quality of the meta-analysis is dependent upon the underlying studies that are analyzed. Furthermore, although studies with insufficient information to be included in the meta-analysis were not found to differ based on basic study data from those studies included in the meta-analysis, nonetheless it is unknown how if at all data from these studies could change the overall results.
Acknowledging these limitations, our present review and meta-analysis found that while an association is evident between cognitive function and later depression, general cognitive function does not appear to be a risk factor for depression, but rather is more likely related to performance decrements associated with concurrent depressive symptoms. Our results suggest that low cognitive function is therefore probably not a causal factor of depression and that clinical practice may benefit more from a focus on how decreased cognitive function in the depressed state is likely to influence treatment outcomes (Gyurak et al. Reference Gyurak, Patenaude, Korgaonkar, Grieve, Williams and Etkin2015). Our findings have important implications for better understanding depression and for the design of future studies in highlighting the need to control for subthreshold depression symptoms when investigating risk factors for mental illness as well as when assessing cognitive function more generally.
Supplementary material
The supplementary material for this article can be found at http://dx.doi.org/10.1017/S0033291716002075.
Acknowledgements
M.A.S. is supported by an National Science Foundation (NSF) Graduate Research Fellowship; A.R.H. is supported by National Institutes of Health (NIH) grants RO1DA033369 & R01AG049789; T.E.M. is supported by National Institutes of Health (NIH) grants R01AG049789. We would like to thank Harris Cooper PhD at Duke University, who provided invaluable insight into conducting the meta-analysis. We thank all of the authors of studies who provided additional information for this meta-analysis.
Declaration of Interest
None.


