Introduction
Individuals with body dysmorphic disorder (BDD) and those with anorexia nervosa (AN) express distortions in how the body is perceived, which suggests underlying abnormalities in visual information processing. In BDD, the cardinal diagnostic psychopathology is preoccupation with perceived defects in appearance, which are unnoticeable, or slight, to others (APA, 2013). Sufferers experience significant distress, disability, and functional impairment, often accompanied by depression and, in many, suicidality (Phillips, Reference Phillips2005). The pathophysiology is likely complex (Monzani et al. Reference Monzani, Rijsdijk, Iervolino, Anson, Cherkas and Mataix-Cols2012), including frontostriatal dysfunction (Rauch et al. Reference Rauch, Phillips, Segal, Makris, Shin, Whalen, Jenike, Caviness and Kennedy2003; Feusner et al. Reference Feusner, Bystritsky, Hellemann and Bookheimer2010a ), emotion recognition (Buhlmann et al. Reference Buhlmann, McNally, Wilhelm and Florin2002, Reference Buhlmann, McNally, Etcoff, Tuschen-Caffier and Wilhelm2004; Feusner et al. Reference Feusner, Moody, Hembacher, Townsend, McKinley, Moller and Bookheimer2010c ), and atypical visual processing (Feusner et al. Reference Feusner, Townsend, Bystritsky and Bookheimer2007, Reference Feusner, Moody, Hembacher, Townsend, McKinley, Moller and Bookheimer2010c ). Regarding the latter, functional magnetic resonance imaging (fMRI) studies using own-face (Feusner et al. Reference Feusner, Bystritsky, Hellemann and Bookheimer2010a ), other-face (Feusner et al. Reference Feusner, Townsend, Bystritsky and Bookheimer2007), and house stimuli (Feusner et al. Reference Feusner, Hembacher, Moller and Moody2011) point to abnormalities in primary and secondary visual-processing systems, particularly when images are filtered to selectively convey configural and holistic information. In accord with these results, one preliminary EEG study found increased N170 latencies in BDD subjects, suggesting increased use of detailed visual processing (Li et al. Reference Li, Lai, Moody, Loo, Strober, Bookheimer and Feusner2013).
Several behavioral studies in BDD suggest imbalances in global (configural and/or holistic) and local (detailed) visual processing, although the results are not entirely consistent. Several of these studies have tested the inversion effect, which is the phenomenon that recognition of inverted faces (or other naturalistic stimuli) is normally slower and less accurate compared to upright faces, due to the absence of a holistic template for inverted faces. One study found reduced face inversion effects in BDD compared to controls for long- but not short-duration stimuli, suggesting a greater propensity for detailed and piecemeal processing of faces, whether upright or inverted (Feusner et al. Reference Feusner, Moller, Altstein, Sugar, Bookheimer, Yoon and Hembacher2010b ). Another study found that individuals with BDD had superior recognition of inverted famous faces relative to controls; this reduced inversion effect may also be an indication of greater focus on single facial features (Jefferies et al. Reference Jefferies, Laws and Fineberg2012). A study using inverted faces, scenes, and bodies found that individuals with high degree of body dysmorphic concerns also had reduced inversion effects (Mundy & Sadusky, Reference Mundy and Sadusky2014). Individuals with BDD were found to be slower and less accurate on the Embedded Figures Test (EFT) and the Navon task, suggesting abnormal global and local processing (Kerwin et al. Reference Kerwin, Hovav, Hellemann and Feusner2014). However, a study examining holistic processing using the face inversion effect, composite face effect, and Navon task, found that the BDD and control groups performed similarly on all three tasks (Monzani et al. Reference Monzani, Krebs, Anson, Veale and Mataix-Cols2013). Thus, while evidence exists for abnormal global and/or local processing, the findings are still somewhat inconclusive. This may be attributed to differences in experimental conditions (e.g. stimulus duration), insufficient power, or else there may be nuances due to heterogeneity within BDD samples.
In AN, the image distortion is the perception of excess weight and fatness, culminating in a marked restriction of energy intake and lowering of body mass. Several studies (although not all) investigating neurocognition in AN have found enhanced local (detail) processing at the expense of visuospatial processing that is more global and integrated (Lopez et al. Reference Lopez, Tchanturia, Stahl and Treasure2008; Urgesi et al. Reference Urgesi, Fornasari, Canalaz, Perini, Cremaschi, Faleschini, Thyrion, Zuliani, Balestrieri, Fabbro and Brambilla2013). On the Rey–Osterrieth Complex Figures Task, which requires recall and re-creation of a complex figure, AN performed worse (Lopez et al. Reference Lopez, Tchanturia, Stahl and Treasure2009; Kim et al. Reference Kim, Lim and Treasure2011) or equal (Sherman et al. Reference Sherman, Savage, Eddy, Blais, Deckersbach, Jackson, Franko, Rauch and Herzog2006; Lopez et al. Reference Lopez, Tchanturia, Stahl and Treasure2008; Castro-Fornieles et al. Reference Castro-Fornieles, Bargalló, Lázaro, Andrés, Falcon, Plana and Junqué2009; Danner et al. Reference Danner, Sanders, Smeets, van Meer, Adan, Hoek and van Elburg2012; Stedal et al. Reference Stedal, Rose, Frampton, Landrø and Lask2012) relative to controls. Several of these studies found that those with AN drew detailed aspects of the figure first and showed less continuity in reproduction (Sherman et al. Reference Sherman, Savage, Eddy, Blais, Deckersbach, Jackson, Franko, Rauch and Herzog2006; Lopez et al. Reference Lopez, Tchanturia, Stahl and Treasure2008; Stedal et al. Reference Stedal, Rose, Frampton, Landrø and Lask2012). Individuals with AN have also been found to be faster and more accurate on the EFT, suggesting superior detail-focused processing (Jolliffe & Baron-Cohen, Reference Jolliffe and Baron-Cohen1997; Booth et al. Reference Booth, Charlton, Hughes, Happé and Happe2003). Other studies have found superior attention to detail and poor central coherence compared with controls, in active and recovered AN participants and their sisters (Tenconi et al. Reference Tenconi, Santonastaso, Degortes, Bosello, Titton, Mapelli and Favaro2010; Roberts et al. Reference Roberts, Tchanturia and Treasure2013). Several functional and structural imaging studies support these abnormal visual-processing findings in AN. An fMRI study using the EFT found greater activation in the fusiform gyrus in AN compared with healthy controls (Fonville et al. Reference Fonville, Lao-Kaim, Giampietro, Van den Eynde, Davies, Lounes, Andrew, Dalton, Simmons, Williams, Baron-Cohen and Tchanturia2013), suggesting a strategy marked by enhanced ventral visual stream activity, which is responsible for detailed image elements (Iidaka et al. Reference Iidaka, Matsumoto, Haneda, Okada and Sadato2006). Furthermore, an fMRI study by Favaro et al. (Reference Favaro, Santonastaso, Manara, Bosello, Bommarito, Tenconi and Di Salle2012) found decreased brain connectivity in a ventral visual network in both underweight and weight-restored individuals with AN, but hyperconnectivity within the somatosensory network only in the underweight group. Structurally, AN also show decreased gray-matter density in the left extrastriate body area, an area in the occipital cortex involved in processing human body parts, compared to controls (Suchan et al. Reference Suchan, Busch, Schulte, Grönemeyer, Grönermeyer, Herpertz and Vocks2010). These neurocognitive and brain-imaging studies suggest the possibility of aberrant visual processing in AN, although the body of research is still growing.
Thus, a potentially important clinical phenotype in AN and BDD is perceptual distortion of appearance. Both disorders tend to display a common pattern of abnormalities in visual processing and visuospatial organization, manifesting as over-attention to details with less global perception and feature integration (Madsen et al. Reference Madsen, Bohon and Feusner2013). However, no study has directly compared visual processing in these disorders.
A limitation of fMRI studies is their relatively poor temporal resolution, typically on the order of 2–3 s. Because of this it remains unclear if abnormal neural activation or connectivity patterns in visual systems result primarily from aberrant early visual cortex activity, or are due primarily to modulation from prefrontal and/or limbic systems. This question, however, is well suited for electroencephalography (EEG), which, unlike fMRI, allows characterization of fast-changing neuronal dynamics. EEG has a time resolution in the order of milliseconds, but has limited spatial resolution, while fMRI has the capability to localize, with higher spatial resolution, changes in blood oxygenation in the brain in the order of millimeters. Therefore, a combination of fMRI and EEG can be used to generate a joint spatiotemporal profile that leverages spatial and temporal resolution advantages of the respective modalities.
Herein we report what is, to the best of our knowledge, the first use of this dual modality approach to study visual processing in BDD and AN. We analyzed the P100 component of the event-related potential (ERP), which indexes first-order processing localized to V1 and V2 and early dorsal visual stream (Itier & Taylor, Reference Itier and Taylor2004), and the N170, which indexes higher level visual processing and structural encoding, and has sources including the ventral visual stream and posterior fusiform gyrus (Pascual-Marqui, Reference Pascual-Marqui1999). (As our principal interest was in early visual processing, we did not study P300 or N400.) We used independent component analysis of task-related fMRI data in combination with ERP data from a separate session, using the same stimuli and paradigm to perform joint independent component analysis (jICA). jICA combines data from these two modalities by joint estimation of the temporal ERP components and spatial fMRI components (Calhoun et al. Reference Calhoun, Adali, Pearlson and Kiehl2006) (see online Supplementary Information). For task stimuli, we used faces and houses. Faces are appearance-related stimuli that have been extensively studied using fMRI and EEG (Bentin et al. Reference Bentin, Allison, Puce, Perez and McCarthy1996; Costen et al. Reference Costen, Parker and Craw1996; Bartlett et al. Reference Bartlett, Searcy, Abdi, Peterson and Rhodes2003). We chose to use face rather than body images, as visual EEG profiles in response to body images have not been well characterized. Houses have a visuospatial complexity similar to faces, but they are of neutral salience, and have been previously studied using fMRI and EEG (Epstein & Kanwisher, Reference Epstein and Kanwisher1998; Iidaka et al. Reference Iidaka, Matsumoto, Haneda, Okada and Sadato2006; Desjardins & Segalowitz, Reference Desjardins and Segalowitz2013). We hypothesized that AN and BDD will differ from healthy controls (HC) in configural processing of unaltered face and house stimuli (normal spatial frequency; NSF), and in processing the same stimuli when they are filtered to contain only low spatial frequency (LSF) information. Although our overarching hypothesis was that AN and BDD may express similar abnormal visual-processing phenotypes, we did not expect to prove phenotypic or endophenotypic equivalence, both due to the preliminary nature of this study and the complexity inherent within psychiatric diagnostic categories.
We tested three specific primary hypotheses:
-
(1) AN and BDD would demonstrate hypoactivity compared with HC: (a) in early dorsal stream regions for the P100 component; and (b), ventral stream regions for the N170 component. We predicted that this would be observed for LSF faces and houses, as well as NSF images because they contain LSF information.
-
(2) Symptom severity in both groups will correlate negatively with activity in early dorsal and ventral stream regions for NSF and LSF joint P100 and N170 components.
-
(3) Neither BDD nor AN will differ from HC in visual system response to high spatial frequency (HSF) images, as these were not detected in previous fMRI studies using HSF faces and houses (Feusner et al. Reference Feusner, Townsend, Bystritsky and Bookheimer2007, Reference Feusner, Hembacher, Moller and Moody2011).
Method and materials
We recruited 15 AN, 15 BDD, and 15 HC participants, of equivalent age and sex, from UCLA and local treatment centers, as well as from the community through print and online advertisements. Diagnoses of clinical participants were confirmed through detailed interviews conducted by three of the authors (J.F., M.S. and C.B.), which included the Mini International Neuropsychiatric Interview (MINI) to determine a primary diagnosis of AN and/or co-morbid diagnoses (Sheehan et al. Reference Sheehan, Lecrubier, Sheehan, Amorim, Janavs, Weiller, Hergueta, Baker and Dunbar1998). The BDD Diagnostic Module (Phillips et al. Reference Phillips, Atala and Pope1995), a 6-item clinician-administered structured interview based on DSM-IV criteria for BDD, was used to make a primary diagnosis of BDD. Severity of concurrent psychiatric symptoms was measured using validated clinical scales [Hamilton Anxiety Rating Scale (HAMA; Hamilton, Reference Hamilton1960); Brown Assessment of Beliefs Scale (BABS; Eisen et al. Reference Eisen, Phillips, Baer, Beer, Atala and Rasmussen1998); Montgomery–Asberg Depression Rating Scale (MADRS; Williams & Kobak, Reference Williams and Kobak2008)]. BDD participants also received the BDD version of the Yale–Brown Obsessive–Compulsive Scale (BDD-YBOCS; Phillips et al. Reference Phillips, Hollander, Rasmussen, Aronowitz, Decaria and Goodman1997), and AN participants received the Eating Disorder Examination V16.0D (EDE; Fairburn et al. Reference Fairburn, Cooper and Connor2008). We did not administer the EDE to BDD participants, nor did we administer the BDD-YBOCS to AN participants, as these scales have not been validated in these populations.
Inclusion/exclusion criteria
Participants were free from psychoactive medications for at least 8 weeks prior to entering the study. Individuals who met criteria for BDD by the BDD Diagnostic Module (Phillips et al. Reference Phillips, Hollander, Rasmussen, Aronowitz, Decaria and Goodman1997) modeled after the DSM-IV were eligible. AN participants were weight-restored [body mass index (BMI) ≥18.5], but they were required to have previously met full DSM-IV criteria for AN at some point in their lifetime, as determined by the MINI. We chose to study weight-restored AN individuals to avoid confounds of starvation on brain activity. For individuals with co-morbid diagnoses, they were required to have had a primary diagnosis of AN or BDD based on symptom severity to be eligible. (See online Supplementary Information for additional inclusion/exclusion criteria; and Table 1 and online Supplementary Table S8 for categories and specific areas of BDD appearance concerns, respectively.)
Table 1. Demographics and psychometrics for anorexia nervosa (AN), body dysmorphic disorder (BDD), and healthy control (HC) participants.

EDE, Eating Disorder Examination V16.0D; BDD-YBOCS, BDD version of the Yale–Brown Obsessive–Compulsive Scale; BABS, Brown Assessment of Beliefs Scale; HAMA,Hamilton Anxiety Rating Scale; MADRS, Montgomery–Asberg Depression Rating Scale; n.a., not available.
a,b Different superscript letters indicate significant pairwise differences from post-hoc t tests at p < 0.05.
Face- and house-matching task
All participants performed a visual matching task in the fMRI scanner, and then performed the same tasks during a separate EEG session on a separate day. Participants were recalled for the EEG session after a mean of 191.8 ± 305.7 days (range 1–1006). The mean interval between sessions was not significantly different among groups (F 2,42 = 2.08, p = 0.14). The stimuli (Fig. 1) were face and house photographs that were NSF, or filtered to LSF or HSF, and circles/ovals or squares/rectangles as control images (see Feusner et al. Reference Feusner, Townsend, Bystritsky and Bookheimer2007). During the presentation, participants pressed a button corresponding to which of two images matched the target image in the top half of the screen. The face and house orders, for NSF, LSF, and HSF, were counterbalanced across participants. There were 72 trials for each category; each trial consisted of a 500 ms crosshair, then 4 s of face or house presentation (2 s for the EEG session, given constraints on total time) during which button responses were recorded.

Fig. 1. Left: Example stimuli used in the experiment, consisting of digital images filtered to normal, high, and low spatial frequencies. Right: Task paradigm, consisting of a face- or house-matching task.
EEG acquisition and processing
All participants were seated 1 m from the screen. EEG data were recorded using a high-density 256-channel Geodesic Hydrocel Sensor Net (Electrical Geodesics Inc., USA) with a sampling rate of 250 Hz, in a dimly lit, copper-shielded room. Between experiments, electrode impedances below 50 kΩ were ensured by reapplying saline solution to high-impedance electrodes. Data preprocessing included bandpass filtering from 0.1 to 30 Hz for visual ERPs.
Artifact detection: See online Supplementary Information.
Segmentation: Data were segmented 200 ms before and 500 ms after stimuli presentation. Segments were averaged across each stimuli condition, and grand averaged over all participants. ERP were baseline-corrected using the 200 ms baseline prior to the stimulus onset. All channels were referenced to an average reference of all electrodes except electrooculography.
fMRI acquisition and processing
Blood oxygen level dependent (BOLD) contrast images were acquired using a 3-T Trio MRI system (Siemens AG, Germany). We used a T2*-weighted echoplanar imaging gradient-echo pulse sequence (repetition time, 2.5 s; echo time, 25 ms; flip angle, 80°; acquisition matrix, 64 × 64 pixels; field of view, 192 × 192 × 120 mm; in-plane voxel size, 3 × 3 mm; section thickness, 3 mm; 0.75-mm intervening spaces; and 28 total sections). There were 133 whole-brain images per subject per run. We also obtained matched-bandwidth and high-resolution Magnetization Prepared Rapid Acquisition Gradient Echo (MPRAGE) T1-weighted images for each subject to provide detailed brain anatomy during structural image acquisition.
For processing and analysis of the fMRI data, we used Oxford Centre for Functional Magnetic Resonance Imaging of the Brain Software Library (FSL) (http://www.fmrib.ox.ac.uk/fsl). Preprocessing steps are described in the online Supplementary Information.
We used FEAT (fMRI Expert Analysis Tool version 5.4; FSL) for general linear model analyses. At the individual subject level, we modeled the hemodynamic response function using a convolution of the experimental paradigms of each stimulus type v. crosshair baseline with the canonical hemodynamic response function and its temporal derivative (Aguirre & Farah, Reference Aguirre and Farah1998). Motion correction was performed by adding 24 motion parameters, modeling the six rigid body motion parameters, their temporal derivatives, and their squares (Friston et al. Reference Friston, Williams, Howard, Frackowiak and Turner1996). We thresholded the z score images using clusters determined by z > 2.3 and a corrected cluster significance threshold of p < 0.05.
jICA
Inputs to jICA were BOLD responses to HSF, NSF, and LSF stimuli, contrasted to crosshair baseline, registered to the MNI brain. These contrasts were submitted to jICA using the Fusion ICA Toolbox (FIT) (http://icatb.sourceforge.net) in Matlab, and were combined with the ERP waveforms as described previously (Calhoun et al. Reference Calhoun, Adali, Pearlson and Kiehl2006). We performed ICA using the Infomax algorithm, a gradient descent algorithm to maximize entropy of the output of single layer neural network (Lee & Sejnowski, Reference Lee and Sejnowski1997), to generate the shared unmixing matrix and the fused ERP and fMRI sources (Calhoun et al. Reference Calhoun, Adali, Pearlson and Kiehl2006). We used principal components analysis to reduce dimensionality from subjects to components. Fifteen joint components were estimated from ERP time courses and fMRI activation maps. The jICA mixing matrix's rows consist of each participant's concatenated data; thus, the maximum number of components extracted from each group is 15 since this was the number of participants in each group. Fifteen independent components (ICs) thus maximizes the extent of separation between sources for this sample size.
Within-group jICA components
From the IC decomposition, we extracted P100 and N170 ICs using a template-matching algorithm that calculated similarity scores for each component. These scores were calculated by comparing each IC against the average ERP at 100 ms windows taken symmetrically around time-points 100 and 170 ms. We then submitted the IC with the largest similarity score for each component (P100 or N170) for analysis with dual regression.
To reduce the number of multiple comparisons, we restricted between-group comparisons by using masks constructed from each respective spatial frequency contrast using a group GLM analysis for each group. We created masks from thresholded images (z scores >1.7), from which we combined the two compared groups’ masks and then binarized the results.
Dual regression
We used Matlab's GIFT Toolbox's Spatiotemporal Reconstruction tool to create subject-level ICs from each group spatial map, by adopting a dual regression procedure (as previously described in Filippini et al. Reference Filippini, MacIntosh, Hough, Goodwin, Frisoni, Smith, Matthews, Beckmann and Mackay2009; see online Supplementary Information).
Statistical analyses
We performed permutation tests between groups to test for statistical differences using Statistical nonparametric Mapping (SnPM, http://warwick.ac.uk/snpm), with 10 000 iterations. We used a Bonferroni-corrected significance threshold of α = 0.016 to account for pairwise comparisons for each of our specific hypotheses; although our hypotheses only included two group pairwise comparisons (AN v. controls and BDD v. controls) we used a more conservative threshold of α = 0.05/3 = 0.016 to additionally account for the post-hoc AN v. BDD comparison.
Correlations with clinical variables
We calculated correlations between individual subject spatial map average intensity values and global scores on the EDE (for AN) and BDD-YBOCS (BDD), for NSF and LSF joint P100 and N170 components. We Bonferroni-corrected for multiple comparisons (α = 0.05/8 = 0.00625).
Results
Demographics and psychometrics (Table 1)
All participants were unmedicated. All AN participants met DSM-IV criteria for restricting type; one had co-morbid generalized anxiety disorder (GAD). Of the BDD participants, two had co-morbid major depressive disorder (MDD), three had dysthymic disorder, one had panic disorder, one had MDD and GAD, and one had MDD, GAD, and social anxiety disorder. In the BDD group, three had facial concerns, one had non-facial concerns, and 11 had facial and non-facial concerns.
Behavioral results
There were no significant differences among groups for accuracy or response times for the EEG or fMRI tasks (Accuracies and reaction times can be found in Table S1 and Fig. S1.)
Within-group jICA results
For AN, BDD, and HC groups the P100 component has associated activations in lingual gyrus and middle occipital cortex, while the N170 component has activations in fusiform gyrus, lingual gyrus, and inferior/middle occipital cortex. This is consistent with previous findings using EEG source localization that localized the P100 (Itier & Taylor, Reference Itier and Taylor2004) to early visual cortices and the N170 (Pascual-Marqui, Reference Pascual-Marqui1999) to mainly the posterior fusiform gyrus. Online Supplementary Figs S2 and S3 show example components for the P100 and N170 components, respectively, in AN, BDD and HC derived from jICA (thresholded at |Z| > 3.5 for display purposes). Supplementary Figs S4 and S5 show spatial maps as a linear sum of individual maps weighted by their ERP time-courses. (See supplementary Information for a spatiotemporal movie.)
Between-group jICA results: faces task
P100 component
There were no statistically significant differences among groups for any spatial frequencies for the joint P100 component.
N170 component
Compared to HC, AN and BDD groups each showed statistically significant hypoactivity in similar dorsal visual stream systems (precuneus, lateral occipital cortex) for LSF faces in the joint N170 component (p < 0.016) (Fig. 2 and online Supplementary Table S3).

Fig. 2. N170 joint component for low spatial frequency face stimuli. The body dysmorphic disorder group (green) demonstrated hypoactivity (p < 0.016) compared with healthy controls in regions including lateral occipital cortex, occipital pole, and precuneus. The anorexia nervosa group (blue) demonstrated hypoactivity (p < 0.016) compared with healthy controls in the precuneus and the lateral occipital cortex. See online Supplementary Table S4 for local maximally significant coordinates.
Between-group jICA results: houses task
P100 component
Compared with HC, AN and BDD groups each showed statistically significant hypoactivity in similar early visual regions (occipital fusiform gyrus) for LSF houses in the joint P100 component (p < 0.016) (Fig. 3 and online Supplementary Table S4).

Fig. 3. P100 joint component for low spatial frequency house stimuli. The body dysmorphic disorder group (green) and the anorexia nervosa group (blue) both demonstrated hypoactivity (p < 0.016) compared with healthy controls in regions including the middle temporal gyrus, the occipital fusiform gyrus, and the inferior temporal gyrus. See online Supplementary Table S5 for local maximum coordinates.
N170 component
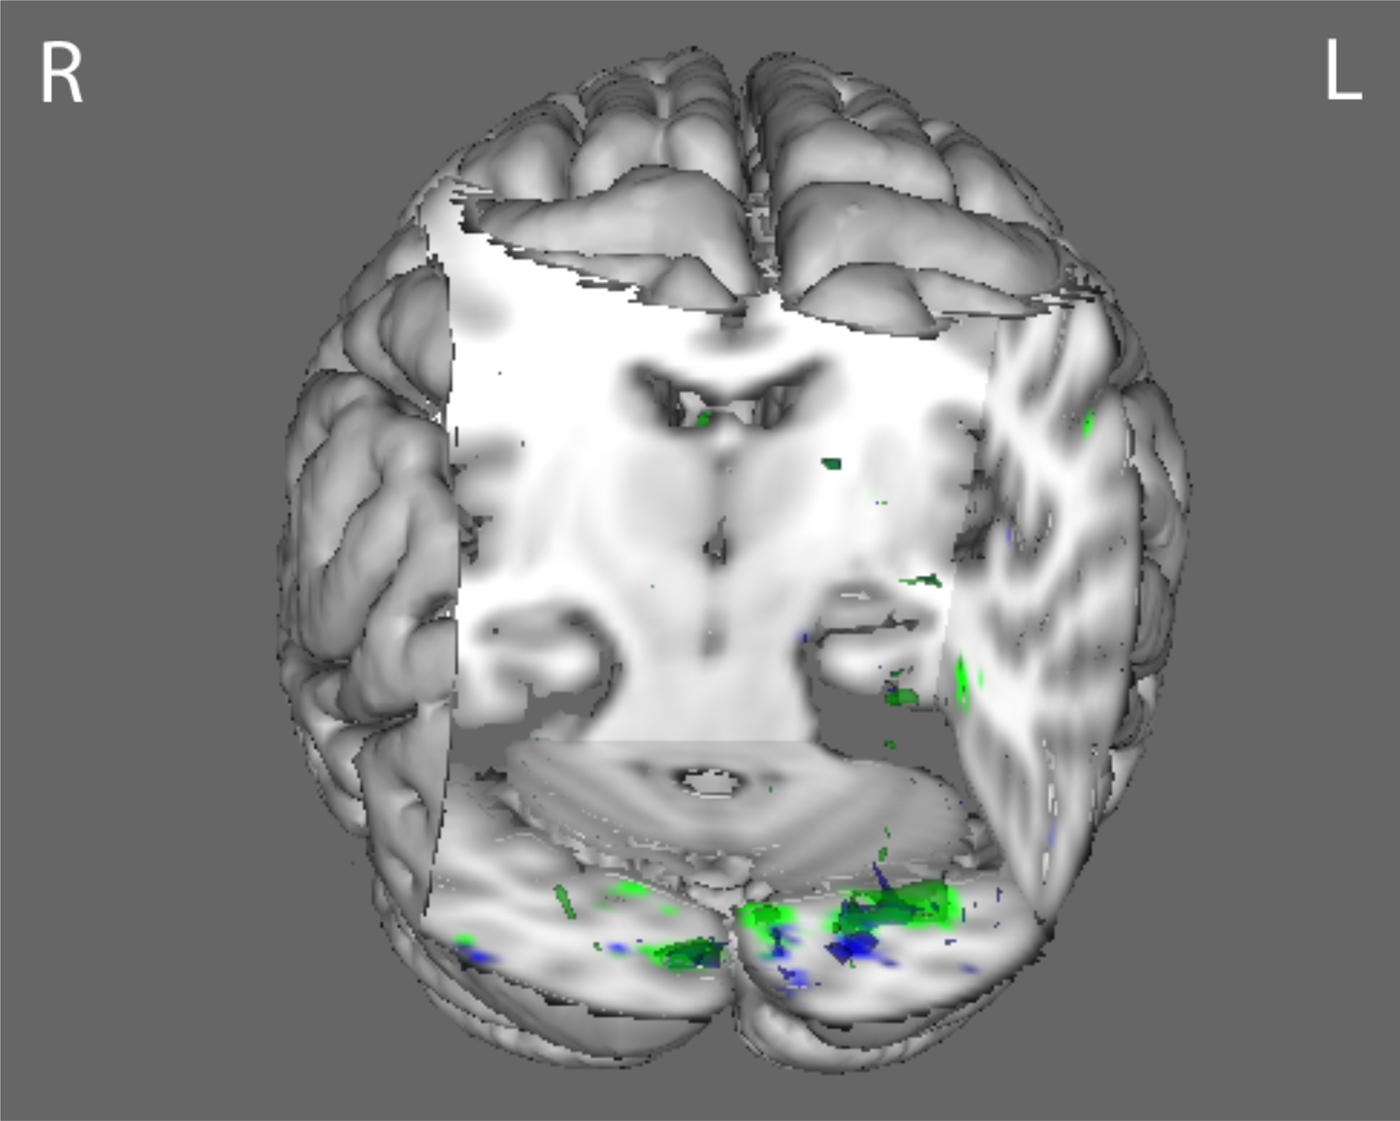
Compared with HC, the BDD group demonstrated statistically significant hyperactivity in regions including the posterior temporal fusiform cortex (part of the ventral visual stream) for HSF houses in the joint N170 component (p < 0.016) (Fig. 4 and online Supplementary Table S5). The BDD group demonstrated statistically significant hypoactivity compared with HC in early ventral visual stream areas (occipital fusiform, temporal occipital fusiform, and lateral occipital cortices), and dorsal visual stream areas (superior parietal lobule) for LSF houses in the joint N170 component stimuli (Fig. 5 and online Supplementary Table S6). By contrast, the AN group showed hypoactivity compared with HC in early ventral visual stream areas as well (occipital fusiform cortex, occipital pole, and precuneus), but only at a lower p threshold of p < 0.05 (Fig. 6).

Fig. 4. N170 joint component for high spatial frequency house stimuli. The body dysmorphic disorder group (red) demonstrated hyperactivity (p < 0.016) in regions including the temporal fusiform cortex compared with healthy controls. See online Supplementary Table S6 for local maximum coordinates.

Fig. 5. N170 joint component for low spatial frequency house stimuli. The body dysmorphic disorder group (green) demonstrated hypoactivity (p < 0.016) compared with healthy controls in regions including the occipital fusiform cortex, lateral occipital cortex, and frontal pole. See online Supplementary Table S7 for local maximum coordinates.

Fig. 6. N170 joint component for low spatial frequency house stimuli using a lower statistical threshold (p < 0.05). The body dysmorphic disorder group (green) demonstrated hypoactivity compared with healthy controls in regions including the occipital fusiform cortex, lateral occipital cortex, and frontal pole. The anorexia nervosa group (blue) demonstrated hypoactivity in occipital fusiform cortex, occipital pole, and precuneus.
Post-hoc AN v. BDD comparisons
Although not among our primary hypotheses, we conducted post-hoc comparisons directly between AN and BDD. The BDD group demonstrated statistically significant hypoactivity compared with AN in left lateral occipital cortex for the LSF houses in the joint N170 component (p < 0.016) (see online Supplementary Fig. S6 and Table S7). There were no other statistically significant differences for the other spatial frequencies and joint ERP components.
Correlational analyses
Activity for LSF faces in the joint N170 component in the AN group correlated negatively with global EDE scores: r = −0.55, p = 0.04, suggesting that lower activity for faces that only contain global and configural information was associated with worse eating disorder symptoms. However, this did not survive correction for multiple comparisons.
As exploratory post-hoc analyses, we calculated correlations between mean scores on ratings of face attractiveness, aversiveness, and degree to which the face triggered thoughts of their own appearance (obtained immediately after the fMRI session) and individual subject spatial map averages for all joint components that were significantly different among groups. There was a significant correlation between face attractiveness ratings for the BDD group and activation for HSF houses in the joint N170 component. [q = 0.035, corrected for multiple comparisons using false discovery rate (FDR)] (Fig. 7).

Fig. 7. (a) Scatterplot showing significant negative correlation (q = 0.035 after false discovery rate correction) between mean activation map intensities and attractiveness ratings for the body dysmorphic disorder (BDD) group for high spatial frequency (HSF) houses in the joint N170 component. (b) Scatterplot showing negative correlation (p = 0.04) between mean activation map intensities and Eating Disorder Examination V16.0D (EDE) ratings for the anorexia nervosa (AN) group for low spatial frequency (LSF) faces in the joint N170 component. The correlation was not significant after multiple comparison correction.
Because the BDD and AN groups differed significantly on depression, anxiety, and BMI (see Table 1), we conducted post-hoc analyses investigating the relationship between MADRS, HAMA, and BMI (and BABS scores, although not significantly different), and all joint components that were significantly different among groups. There were no significant correlational findings, using FDR correction with a q threshold of 0.05. (See online Supplementary Table S2 for full correlation results with psychometric scores.)
Discussion
To the best of our knowledge, this is the first study to investigate visual processing concurrently in individuals with AN and in those with BDD for appearance- and non-appearance-related images, and the first to use joint analysis of fMRI and EEG data to study brain activation patterns in these clinical populations. We found that both AN and BDD showed hypoactivity in dorsal visual stream systems for LSFs, suggesting that a common deficiency in holistic processing is operating in primary visual structures as early as 100 ms post-exposure, which extends later in time (170 ms) into dorsal higher-order processing regions. However, the patterns of hypoactivity are not identical; BDD demonstrated hyperactivity when compared with controls in ventral visual stream systems for HSF houses, but they showed hypoactivity in dorsal visual regions for LSF faces in comparison to participants with AN.
In line with our hypothesis, individuals with BDD and those with AN demonstrate hypoactivity in early secondary visual-processing regions when viewing faces that contain only LSF information, corresponding to electrical activity in the N170 component. But contrary to our hypotheses, we did not find hypoactivity in the P100 component profile for faces, which suggests that abnormalities in face visual processing may not manifest until the structural encoding that occurs ~170 ms after stimulus presentation.
Also in line with our hypotheses, BDD individuals demonstrate hypoactivity in primary and secondary visual regions for the P100 and N170 components, respectively, in response to LSF houses. This suggests deficient activation for configural/holistic information in the dorsal visual stream within the first 200 ms of visual processing, even for stimuli that are appearance neutral. Contrary to prediction, in response to HSF house images, individuals with BDD demonstrate hyperactivity in the fusiform gyrus (part of the ventral visual stream) in the N170 component, suggesting greater engagement of detailed processing. As we did not find this in our previous fMRI studies of BDD (Feusner et al. Reference Feusner, Townsend, Bystritsky and Bookheimer2007, Reference Feusner, Moody, Hembacher, Townsend, McKinley, Moller and Bookheimer2010c , Reference Feusner, Hembacher, Moller and Moody2011), the general linear modeling we used in those studies may not have had the sensitivity necessary for its detection, as jICA specifically isolates fMRI activations linked to electrophysiological activity at predefined time-points. The results herein suggest a general imbalance for detailed v. configural/holistic processing of visual information.
We observed similar hypoactivity in visual systems for LSF house images in participants with AN, but with some exceptions. In the P100 profile, they show hypoactivity in early visual areas, although more limited relative to that observed in participants with BDD. In the N170 profile, participants with AN did not show significant differences in activation at the (corrected) threshold of p < 0.016; however, they did show hypoactivity in primary visual areas at a lower threshold of p < 0.05. These support previous findings of poor central coherence and diminished holistic and configural processing in individuals with AN, for bodies (Lopez et al. Reference Lopez, Tchanturia, Stahl and Treasure2008; Urgesi et al. Reference Urgesi, Fornasari, Canalaz, Perini, Cremaschi, Faleschini, Thyrion, Zuliani, Balestrieri, Fabbro and Brambilla2013) and complex figures (Lopez et al. Reference Lopez, Tchanturia, Stahl and Treasure2009; Kim et al. Reference Kim, Lim and Treasure2011). We did not, however, find evidence of increased detailed processing in AN, from our HSF condition.
The post-hoc direct comparison of AN to BDD did not reveal significant differences in these primary visual areas, but there was lower activity in a superior portion of the left lateral occipital cortex in BDD compared to AN. One possibility is that AN is characterized by similar deficient activity in primary visual regions as seen in BDD, although of slightly lower magnitude and extent. Yet in later, dorsal stream structures, BDD may have reduced activity compared to AN, possibly signifying a greater deficiency in configural processing. Finally, although the AN group did not demonstrate the same ventral visual stream hyperactivity compared with controls as observed for BDD, the direct AN to BDD comparison was not statistically significant. Thus, an imbalance in detailed v. configural/holistic processing for non-appearance-related stimuli may characterize both disorders, but the defect appears to be more pronounced in BDD.
These findings may indicate a possible deficit in magnocellular pathway systems that normally construct a low-resolution holistic template of the visual field, which in turn may contribute to the distorted perceptions underlying appearance concerns in both disorders. However, similarities in abnormal neural activity as elicited by this experiment does not prove that AN and BDD have identical pathophysiology contributing to their respective clinical phenotypes. This is a preliminary study in these disorders, so further behavioral, connectivity, and neuropsychological research should be conducted to fully elucidate their differences.
The observation that case-control differences were more pronounced for the house than the face images is somewhat unexpected, given how often those with BDD perceive defects in their own faces. One possible explanation is that faces on average have more emotional and social saliency than houses, and this may also be more variable person-to-person. Such variability could introduce noise into the ERP responses from top-down modulation, resulting in a more heterogeneous signal (the specific emotional and cognitive reactions to faces would not likely be directly detected in this study, as we chose to focus solely on early visual joint components). The house stimuli, in contradistinction, may have allowed for a more consistent, less modulated response in visual systems and thus be more sensitive to underlying abnormalities.
The study has several limitations. First, the small sample size may have hindered full independent components decomposition. Second, although we collected the fMRI and EEG data using the same stimuli, task, and participants, they were not collected concurrently. This invites the possibility of subjective and experimental differences between sessions, although the normalization step when performing the jICA accounts for linear effects of habituation. However, concurrent fMRI-EEG studies have their own limitations, such as significant artifacts due to gradient and heartbeat noise. Third, although we chose face images for appearance-related stimuli as the N170 and P100 are well characterized, faces are more likely to be salient for participants with BDD. It is possible that this may have differentially affected attention. The N170 and P100 joint components are less likely than later components to be affected by top-down modulation, although it remains a possibility. Moreover, the BDD group may have misinterpreted neutral face expressions as being angry or contemptuous, as has been observed in other BDD studies (Buhlmann et al. Reference Buhlmann, Etcoff and Wilhelm2006), which, in turn, may have resulted in between-group differences in image salience or emotion. The BDD group had higher average anxiety and depression scores than both AN and HC participants, although this is unlikely to account for differences in activation patterns given a lack of significant correlations between component activation and these ratings. Finally, it remains unknown due to the cross-sectional design of the study if the differences found reflect intrinsic variations that enhance risk of illness, or epiphenomena of illness or correlates of other neural processes.
The results of this study suggest the possibility that a general visual-processing phenotype may operate in psychiatric disorders that involves distortion of one's appearance and is accompanied by emotional distress and related self-esteem concerns (Madsen et al. Reference Madsen, Bohon and Feusner2013). The phenotype may explain the peculiar, increased attention given to miniscule defects seen on the skin (in BDD), or areas of perceived cellulite, or ‘fat’, on thighs and stomach (in AN), and the inability to process these perceptions contextually, i.e. to see them as inconsequential relative to the body as a whole (Madsen et al. Reference Madsen, Bohon and Feusner2013). The finding in the BDD group that greater degree of activation for high detail stimuli is associated with lower face attractiveness ratings supports this interpretation; enhanced detail processing may lead to a greater likelihood of flaw detection, and hence lower perception of attractiveness. The fact that this relationship was significant for house stimuli and not face stimuli is somewhat unexpected, but may be due to the aforementioned possibility of greater neural signal variability related to differences in salience of the faces. For the AN group, lower activation for LSF faces is associated with worse eating disorder symptoms, suggesting a possible link between deficiencies in global and configural processing and clinical symptomatology, although this correlation did not survive correction for multiple comparisons. As the neural differences observed are linked to ERP components as early as 100 ms post-stimulus, we speculate that abnormalities exist in BDD and AN in primary and secondary visual brain regions before this information is transferred forward to areas that form and regulate memory, emotion, and cognitive schemas.
The results, although preliminary given the small sample and need for replication, suggest potential translational implications. The results may have promise in informing study of these phenotypes as biomarkers of risk, persistence of symptom-conferring pathophysiology, or endophenotypes. Finally, they may inform the development of novel, adjunctive perceptual remediation therapies targeting impairment in early dorsal v. ventral visual streams.
Supplementary material
For supplementary material accompanying this paper visit http://dx.doi.org/10.1017/S0033291715000045.
Acknowledgements
This work was funded by NIH MH093535-02S1 (Feusner). Dr Strober received support from the Resnick Endowed Chair in Eating Disorders.
Declaration of Interest
None.