


Introduction
Obsessive–compulsive disorder (OCD) is a disabling disorder that affects 2–3% of the general population (Kessler et al. Reference Kessler, Petukhova, Sampson, Zaslavsky and Wittchen2012). Despite advances in effective pharmacological and behavioural treatments, an estimated 10% of patients with OCD remain treatment-resistant and continue to suffer from severe symptoms (Denys, Reference Denys2006). Deep brain stimulation (DBS) has been proposed as an alternative treatment for this group of patients with treatment-resistant OCD.
DBS consists of the implantation of electrodes that send electrical pulses to deep brain areas. Since dysfunction in cortico–striato–thalamo–cortical (CSTC) circuits is central to most of the prevailing neurobiological models of OCD (Menzies et al. Reference Menzies, Chamberlain, Laird, Thelen, Sahakian and Bullmore2008; Milad & Rauch, Reference Milad and Rauch2012; Eng et al. Reference Eng, Sim and Chen2015; van den Heuvel et al. Reference van den Heuvel, van Wingen, Soriano-Mas, Alonso, Chamberlain, Nakamae, Denys, Goudriaan and Veltman2016), structures of the basal ganglia such as the ventral striatum and the subthalamic nucleus (STN) have become the main anatomical targets of DBS (Alonso et al. Reference Alonso, Cuadras, Gabriëls, Denys, Goodman, Greenberg, Jimenez-Ponce, Kuhn, Lenartz, Mallet, Nuttin, Real, Segalas, Schuurman, du Montcel and Menchon2015).
Research on the brain functional changes induced by DBS has shown some convergence with neuroimaging studies describing functional abnormalities in OCD patients. Figee et al. (Reference Figee, Luigjes, Smolders, Valencia-Alfonso, van Wingen, de Kwaasteniet, Mantione, Ooms, de Koning, Vulink, Levar, Droge, van den Munckhof, Schuurman, Nederveen, van den Brink, Mazaheri, Vink and Denys2013) showed that DBS targeted at the nucleus accumbens (NA) reduced functional connectivity (FC) of this region with the prefrontal cortex, while different studies have consistently reported increased FC between these structures in OCD (Harrison et al. Reference Harrison, Soriano-Mas, Pujol, Ortiz, López-Solà, Hernández-Ribas, Deus, Alonso, Yücel, Pantelis, Menchon and Caronder2009; Reference Harrison, Pujol, Cardoner, Deus, Alonso, López-Solà, Contreras-Rodríguez, Real, Segalàs, Blanco-Hinojo, Menchon and Soriano-Mas2013; Jung et al. Reference Jung, Kang, Kim, Shin, Jang and Kwon2013). Such concurring findings provide a neurobiological framework to understand the mechanism of action of DBS in OCD.
There is a lack, however, of similar studies focusing on the other basal ganglia targets of DBS for OCD. For example, no studies to date have specifically assessed the FC of the STN in patients with OCD. The STN plays a key role in indirect and hyperdirect CSTC pathways (Jahanshahi et al. Reference Jahanshahi, Obeso, Rothwell and Obeso2015), and abnormalities in its FC may therefore critically account for the suspected imbalance between different CSTC pathways in OCD (Graybiel & Rauch, Reference Graybiel and Rauch2000; Mataix-Cols & van den Heuvel, Reference Mataix-Cols and van den Heuvel2006; van den Heuvel et al. Reference van den Heuvel, van der Werf, Verhoef, de Wit, Berendse, Wolters, Veltman and Groenewegen2010).
Moreover, clinical research has started to investigate other DBS targets beyond the CSTC pathways for patients with treatment-resistant OCD. Among them, the bed nucleus of the stria terminalis (BNST) stands out as one of the most targeted regions (Neumann et al. Reference Neumann, Huebl, Brücke, Gabriëls, Bajbouj, Merkl, Schneider, Nuttin, Brown and Kühn2014; Islam e t al. Reference Islam, Franzini, Messina, Scarone and Gambini2015; Luyten et al. Reference Luyten, Hendrickx, Raymaekers, Gabriëls and Nuttin2016). The BNST has classically been associated with sustained anxiety responses (Walker et al. Reference Walker, Miles and Davis2009; Somerville et al. Reference Somerville, Whalen and Kelley2010; Alvarez et al. Reference Alvarez, Chen, Bodurka, Kaplan and Grillon2011), and it is considered part of the extended amygdala because of its location and its strong structural and functional interactions with this medial temporal lobe structure (Davis et al. Reference Davis, Walker, Miles and Grillon2010). In this context, despite there being no reports of altered BNST function, FC of the amygdala seems to be altered in OCD, with reports of reduced FC at rest (Göttlich et al. Reference Göttlich, Krämer, Kordon, Hohagen and Zurowski2014), task-related increases of FC with frontal regions (de Vries et al. Reference de Vries, de Wit, Cath, van der Werf, van der Borden, van Rossum, van Balkom, van der Wee, Veltman and van den Heuvel2014), and associations with cognitive-behavioural therapy response (Göttlich et al. Reference Göttlich, Krämer, Kordon, Hohagen and Zurowski2015). Therefore, an assessment of FC of the BNST is warranted to provide an explanatory framework of the alleged effectiveness of DBS targeting this structure in refractory OCD.
The aim of this study was to assess the FC of the STN and the BNST in a large sample of OCD patients in comparison with an equally large sample of healthy control subjects. Moreover, to further investigate the importance of such FC patterns for OCD pathophysiology, its association with OCD severity was also explored. Despite this being essentially an exploratory study, we hypothesized that FC of these two nuclei with structures within CSTC circuits would be altered in OCD, and that such alterations would be associated with disorder severity.
Material and methods
Participants
A total of 86 outpatients were recruited from the OCD Unit of Bellvitge University Hospital, Barcelona, Spain. Psychiatric diagnoses were established using the Structured Clinical Interview for DSM-IV Axis I Disorders-Clinician Version (First et al. Reference First, Spitzer, Gibbon and Williams1997). A primary diagnosis of OCD was given if OCD symptoms were persistent and constituted the primary cause of distress and interference in the patient's life. Exclusion criteria were being aged younger than 18 or older than 65, current or history of psychotic disorders, mental retardation, any severe organic or neurological disease other than tic disorder, current or past substance abuse/dependence, presence of any contraindication to magnetic resonance imaging (MRI), or the presence of any abnormality in the MRI scan. Each patient was assessed using the Yale-Brown Obsessive–Compulsive Scale (YBOCS) (Goodman et al. Reference Goodman, Price, Rasmussen, Mazure, Fleischmann, Hill, Heninger and Charney1989), the YBOCS Symptom Checklist (Goodman et al. Reference Goodman, Price, Rasmussen, Mazure, Fleischmann, Hill, Heninger and Charney1989), the Hamilton Rating Scale for Anxiety (HRSA) (Hamilton, Reference Hamilton1959) and the Hamilton Rating Scale for Depression (HRSD) (Hamilton, Reference Hamilton1960).
The control sample included 104 healthy participants of comparable age and gender in relation to patients. In order to rule out the possibility of current or lifetime psychiatric disorders and the use of psychotropic medication, subjects from the comparison group underwent a medical anamnesis and the Structured Clinical Interview for DSM-IV Axis I Disorders non-patient version (First et al. Reference First, Spitzer, Gibbon and Williams2002). The rest of exclusion criteria were the same used for the OCD group. The sociodemographic characteristics of all participants and the clinical characteristics of patients with OCD are described in Table 1.
Table 1. Sociodemographic and clinical characteristics of the study samples

OCD, obsessive-compulsive disorder; YBOCS, Yale-Brown obsessive-compulsive scale; HRSA, Hamilton Rating Scale for anxiety; HRSD, Hamilton Rating Scale for depression; SSRIs, selective serotonin reuptake inhibitors; MAOI, monoamine oxidase inhibitor.
a Independent samples t test for continuous variables, χ2 test for categorical variables.
After receiving approval from the ethical committee of clinical research (CEIC) of Bellvitge University Hospital, all participants gave written informed consent to participate in this study, which was performed in accordance with the Declaration of Helsinki.
Image acquisition and preprocessing
A 1.5-T Signa Excite system (General Electric, Milwaukee, Wisconsin) equipped with an eight-channel phased-array head coil and single-shot echo-planar imaging software was used. The functional sequence consisted of gradient recalled acquisition in the steady state (repetition time, 2000 ms; echo time, 50 ms; and pulse angle, 90°) in a 24-cm field of view, with a 64 × 64 pixel matrix and a slice thickness of 4 mm (interslice gap, 1 mm). Twenty-two interleaved sections, parallel to the anterior–posterior commissure line, were acquired to generate 120 whole-brain volumes, excluding four initial dummy volumes. Participants were instructed to simply relax, stay awake, and to lie still without moving, while keeping their eyes closed throughout image acquisition. We also acquired a high-resolution T1-weighted anatomical image for each subject using a three-dimensional fast spoiled gradient inversion-recovery prepared sequence with 130 contiguous slices (repetition time, 11.8 ms; echo time, 4.2 ms; flip angle, 15°) in a 30-cm field of view, with a 256 × 256 pixel matrix and a slice thickness of 1.2 mm.
Imaging data were processed on a Microsoft Windows platform using technical computing software (MATLAB 7.14; The MathWorksInc, Natick, Mass) and Statistical Parametric Mapping (SPM8; The Welcome Department of Imaging Neuroscience, London, UK). After an initial pre-alignment step to the first image of the time-series, motion correction was performed by aligning (within subject) each time-series to the mean image using a least-squares minimisation and a 6-parameter (rigid body) spatial transformation. These realigned functional sequences were subsequently coregistered to the each participant's anatomical scan, which had been previously coregistered and normalized to the SPM-T1 template. Normalization parameters were then applied to the coregistered functional images, which were smoothed with an 8 mm full-width at half-maximum (FWHM) isotropic Gaussian kernel.
Regions of interest
We extracted the signal from four seed-regions of interest (two per hemisphere), centred on the bed nucleus of the stria terminalis (BNST) region and the subthalamic nucleus (STN) region. Seeds were defined with the MarsBar region-of-interest toolbox as 2 mm radial spheres centred at the following MNI coordinates (following Höflich et al. Reference Höflich, Savli, Comasco, Moser, Novak, Kasper and Lanzenberger2013 and Krüger et al. Reference Krüger, Shiozawa, Kreifelts, Scheffler and Ethofer2015): (i) BNST region [x = ±5, y = 0, z = 4] and (ii) STN region [x = ±10.3, y = −16.7, z = −1]. All these four seeds were spatially separated between each other by at least 8 mm (>1 FWHM), according to the formula:
 $$\surd ((x_1 - x_2)^2 + {\rm (}y_1 - y_2{\rm )}^2 + {\rm (}z_1 - z_2{\rm )}^2)$$
where (x 1 y 1 z 1 & x 2 y 2 z 2) refer to the coordinates of any two voxels in MNI space, which allowed us to obtain specific FC maps for each region. For anatomical reference, online Supplementary Fig. S1 depicts the location of our seeds of interest overlaid on normalized structural images from a selected group of study participants.
In addition to our signals of interest, we derived estimates of white matter, cerebrospinal fluid (CSF) and global brain signal fluctuations to be included as nuisance variables in first-level analyses. Specifically, white matter and CSF SPM tissue probability maps were eroded so to keep voxels with a probability of at least 0.2 or 0.6 of being white matter or CSF, respectively. Such tissue-specific masks were then binarized to create nuisance variable masks, together with a binary mask for global brain signal, which was the sum of the white matter and CSF masks plus a gray matter mask. Across the time-series, nuisance signals were derived from each mask by averaging signal from all in-mask voxels.
Statistical analyses
Sociodemographic data were compared between groups using the Statistical Package for Social Sciences (SPSS) v.21 (SPSS Inc., Chicago, IL).
Regarding imaging analyses, first-level FC maps of each seed were calculated for each participant by estimating the regression coefficient between the seed's and each brain voxel's time series using an SPM multiple regression model. A high-pass filter set at 128 seconds was used to remove low-frequency drifts of less than approximately 0.008 Hz, and, before model estimation, the three nuisance covariates were mutually orthogonalized using an iterative Gram–Schmidt procedure. First-level FC images of each participant were then included in a second-level (group) analysis. We used an independent two-sample model to derive t-statistic maps comparing the FC patterns between patients with OCD and healthy participants. Specifically, we estimated 4 SPM models, resulting from the analysis of the four seeds of interest (left BNST, right BNST, left STN and right STN regions). In each model, we initially estimated positive and negative FC patterns of each group, which were thresholded at a significance threshold of p < 0.05, Family-Wise error (FWE) corrected for multiple comparisons across the whole brain. These group specific patterns were then combined to create a mask in which we investigated between-group differences in FC.
In addition, we assessed the association between clinical severity and FC patterns using multiple regression analyses. More specifically, clinical severity, as measured by YBOCS score, was included as an independent predictor in the SPM multiple regression models to evaluate its relationship with BNST and STN FC patterns. Importantly, this analysis was focused on the pattern of significant results derived from the above between-group comparisons. In all between-group comparisons and regression analyses, statistical significance was set at p < 0.05, FWE corrected for multiple comparisons across all in-mask voxels (i.e. using small-volume correction procedures across all voxels showing positive or negative FC in patients or controls with our seed regions of interest).
Likewise, to assess for the association between other sociodemographic and clinical variables and FC alterations, we conducted a series of analyses with the FC estimates from the peak coordinates of the above analyses. Thus, we assessed Pearson correlations with age, age at onset, illness duration, HRSA and HRSD scores and obsessive–compulsive symptom dimension scores. Also, to evaluate the potential effects of pharmacological treatment on our findings, we performed two kinds of two-sample t test comparisons. Firstly, we compared those patients receiving no pharmacological or standard treatments (i.e. SSRIs or Clomipramine) v. those on other regimens denoting higher pharmacological resistance (i.e. antipsychotic augmentation, SSRIs + Clomipramine or MAO inhibitors, see Table 1). Secondly, we compared patients with v. those without dopaminergic medications. Finally, a two-sample t test comparison was also used to evaluate potential between-sex differences. In these analyses, which were performed in SPSS v.21 (SPSS Inc., Chicago, IL), we used a statistical significance threshold of p < 0.05 after a Bonferroni correction for multiple comparisons.
Finally, in a complementary analysis, to assure our analyses were based on the FC patterns of our regions of interest and that we were not capturing signal from surrounding structures, online Supplementary Figs S2 and S3 depict the patterns of functional connectivity from our seeds of interest as compared with the patterns of surrounding structures (nucleus accumbens and substantia nigra pars compacta).
Results
Sociodemographic and clinical characteristics
As can be seen in Table 1, groups did not differ in sociodemographic characteristics. Table 1 also presents the descriptive statistics of the clinical variables from the OCD group.
Neuroimaging analyses
Between-group comparisons
In comparison with healthy participants, patients with OCD showed: (1) increased FC between the left STN and the right pre-motor cortex (rPMC); (2) decreased FC between the right STN and the bilateral lenticular nuclei (bLN), including the left putamen and the right globus pallidus (rGP); and (3) increased FC between the left BNST and the right frontopolar cortex (rFPC). The FC pattern of the right BNST did not significantly differ between groups (see Table 2 and Fig. 1).

Fig. 1. (a) Functional connectivity between left subthalamic nucleus (STN) and the right pre-motor cortex, increased in patients with obsessive–compulsive disorder (OCD). (b) Functional connectivity between the right subthalamic nucleus and the bilateral lenticular nuclei, decreased in patients with OCD. (c) Functional connectivity between the left bed nucleus of the stria terminalis (BNST) and right frontopolar cortex, increased in patients with OCD. Color bar represents t values. L indicates left hemisphere. Voxels are thresholded at p < 0.001 (uncorrected) for illustrative purposes.
Table 2. Brain areas showing functional connectivity differences between patients with OCD and healthy participants

lSTN, left subthalamic nucleus; rSTN, right subthalamic nucleus; lBNST, left bed nucleus of the stria terminalis; rPMC, right pre-motor cortex; bLN, bilateral lenticular nuclei; lputamen, left putamen; rGP, right globus pallidus; rFPC, right frontopolar cortex. x, y, z-coordinates are reported in standard Montreal Neurological Institute (MNI) space.
a FWE corrected for multiple comparisons.
For replication of previous findings involving alterations in FC of the ventral striatum, we also evaluated between-group differences in the FC patterns of the nucleus accumbens. These results are presented in online Supplementary Fig. S4.
Relationship with clinical severity and other clinical and sociodemographic factors
The multiple regression analysis using clinical severity (YBOCS score) as the independent predictor of the FC patterns revealed a significant (t = 2.22; p = 0.044) negative association between clinical severity and the FC estimate between the rSTN and the right LN (x = 20, y = 6, z = 2) (see Fig. 2). No further correlations with clinical severity were observed. Likewise, post-hoc analyses did not reveal any significant relationship between the other clinical and sociodemographic variables (including age, sex, age at onset, illness duration, HRSA and HRSD scores, symptom subtypes and pharmacological regimen) and FC alterations.

Fig. 2. Scatter plot depicting the association between right subthalamic-right lenticular nuclei (rSTN-rLN) functional connectivity and clinical severity (YBOCS score).
Finally, we performed an exploratory analysis to evaluate the possible association between the FC patterns of our regions of interest and the age and sex of our control subjects. These results of these analyses, reported in online Supplementary Fig. S5, showed increased FC between both BNST and right thalamus in women.
Discussion
In the present study we investigated potential alterations in the FC of two different DBS targets used for patients with refractory OCD: the STN and the BNST. We observed: (1) increased FC between the left STN and the right PMC, (2) decreased FC between the right STN and the bilateral LN, including the left putamen and the right GP, and (3) increased FC between the left BNST and the right FPC. In addition, the FC between the right STN and the right LN was negatively associated with clinical severity. These findings provide a neurobiological framework to interpret future results on the neurobiological mechanisms accounting for the effectiveness of DBS on the STN and the BNST as a treatment for OCD.
The STN is crucially involved in response inhibition capacity (see Chambers et al. Reference Chambers, Garavan and Bellgrove2009; Aron, Reference Aron2011 or Bari & Robbins, Reference Bari and Robbins2013 for a review). Specifically, as a central relay structure of the hyperdirect and the indirect CSTC pathways, it receives direct excitatory input from the prefrontal cortex (i.e. inferior frontal cortex and pre-supplementary motor area (pre-SMA)) and inhibitory input from the external globus pallidus, respectively. In turn, it provides excitatory output to the internal globus pallidus, which results in a net inhibition of thalamo-cortical activity and consequent inhibited motor response (Nambu et al. Reference Nambu, Tokuno and Takada2002; Jahanshahi et al. Reference Jahanshahi, Obeso, Rothwell and Obeso2015; Rae et al. Reference Rae, Hughes, Anderson and Rowe2015). The results reported here show that, while FC with cortical structures providing input to the STN is not altered in OCD, FC with basal ganglia structures (e.g. globus pallidus) may be decreased, which could account for the decreased inhibition of motor responses that has been consistently reported in OCD. Indeed, we also observed increased connectivity between the STN and rPMC, which in all likelihood stems from disruptions in motor inhibitory pathways. Thus, according to the CSTC circuits model depicted in Fig. 3a , in healthy conditions it is expected that STN activity will be coupled with decreased activity in motor and premotor areas, the last step of central motor programming before sending excitatory inputs to the spinal cord (Nambu et al. Reference Nambu, Tokuno and Takada2002; Rae et al. Reference Rae, Hughes, Anderson and Rowe2015). Conversely, we report increased connectivity between these two regions, which could imply that patients with OCD may show decreased inhibitory response because of decreased FC between the STN and the internal part of the GP, resulting in a net excitation of the motor cortices.
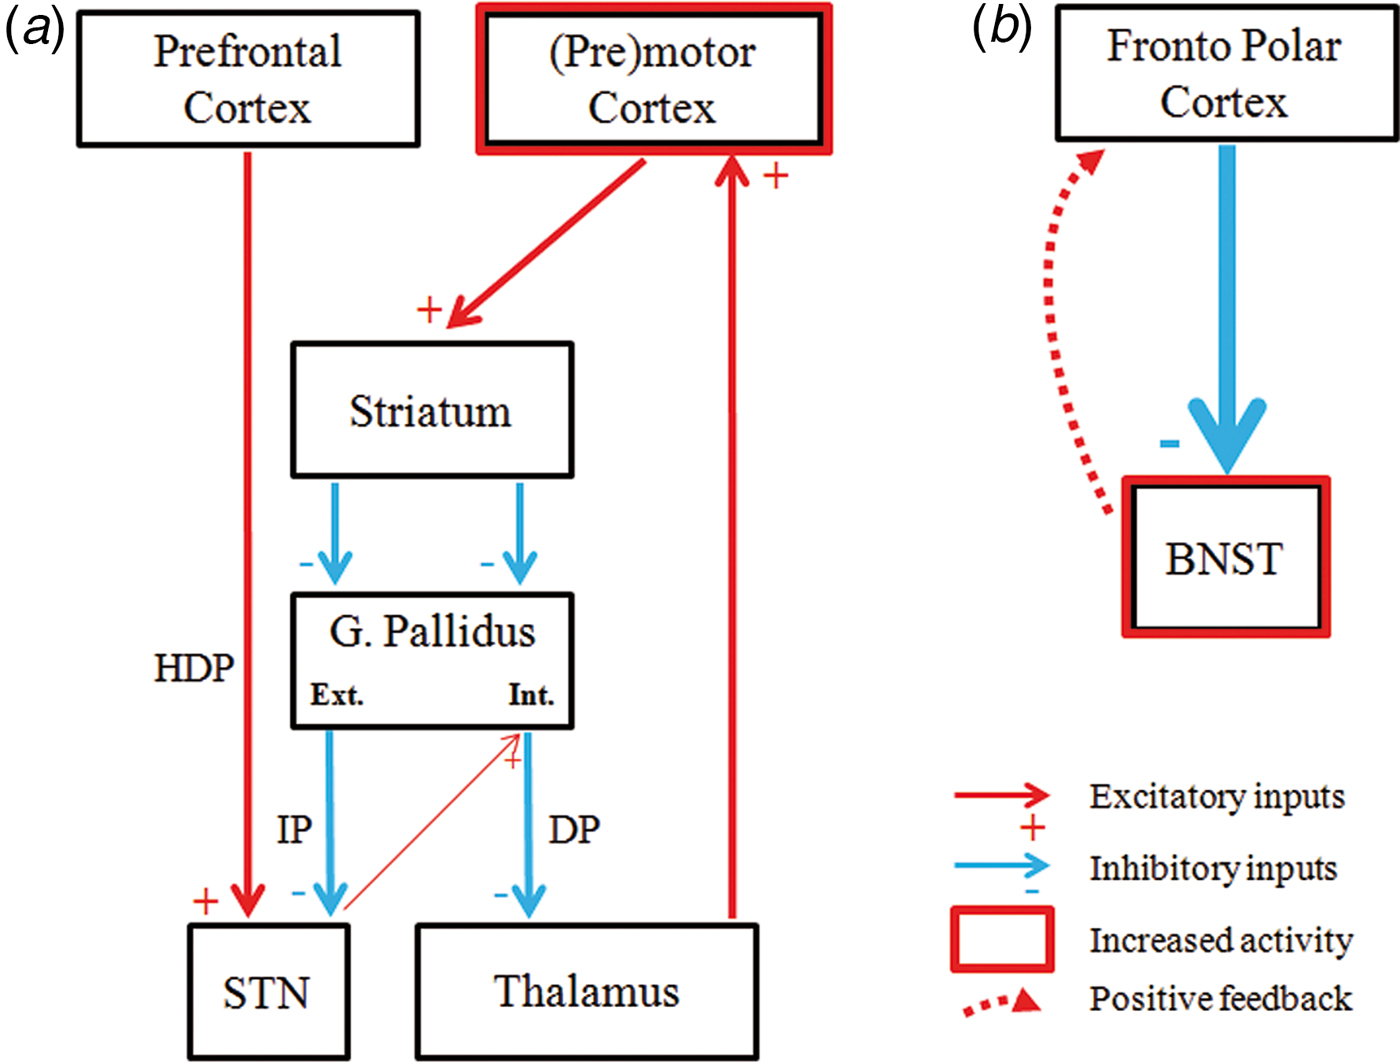
Fig. 3. Schematic representation of our findings and tentative explanatory hypotheses. (a). According to our data, within the cortico–striatal–thalamo–cortical circuits, patients with OCD showed reduced functional connectivity between the subthalamic nucleus (STN) and the internal globus pallidus, which leads to a disinhibition of the (pre)motor cortex. HDP, hyperdirect pathway; IP, indirect Pathway; DP, direct pathway. (b). The fronto polar cortex showed increased functional connectivity with the bed nucleus of the stria terminalis (BNST), likely as a consequence of the increased excitatory feedback received from this structure. In a and b, thinner and thicker lines refer to alterations in functional connectivity in OCD patients.
Hyperactivity of premotor and motor cortices and decreased activation in the basal ganglia, including the caudate, the putamen and the GP, has been consistently reported in OCD, especially during motor inhibition tasks (see Van Velzen et al. Reference van Velzen, Vriend, de Wit and van den Heuvel2014 for review). Indeed, patients with OCD show increased stop-signal reaction time and higher error rates on go/no-go paradigms compared with healthy controls (Chamberlain & Sahakian, Reference Chamberlain and Sahakian2007; Penadés et al. Reference Penadés, Catalán, Rubia, Andrés, Salamero and Gastó2007; Kang et al. Reference Kang, Jang, Han, Kim, Jung, Choi, Choi and Kwon2013, but also see Kalanthroff et al. Reference Kalanthroff, Teichert, Wheaton, Kimeldorf, Linkovski, Ahmari, Fyer, Schneier, Anholt and Simpson2016). Such alterations in motor inhibition have been proposed as a behavioural endophenotype of the disorder (Chamberlain & Sahakian, Reference Chamberlain and Sahakian2007; Menzies et al. Reference Menzies, Achard, Chamberlain, Fineberg, Chen, del Campo, Sahakian, Robbins and Bullmore2007).
Likewise, we also observed that decreased FC between the STN and the LN was associated with disorder severity. These findings were restricted to the right hemisphere, and such greater relative relevance of right CSTC circuits is in agreement with the right lateralization of motor inhibitory pathways in healthy controls (Aron & Poldrack, Reference Aron and Poldrack2006). Nevertheless, at more lenient significance thresholds, the left STN also showed FC alterations with bilateral lenticular nuclei (data not shown). Therefore, our results are also consistent with the ‘efficient-inhibition hypothesis’, which stresses the role of the left hemisphere for efficient response inhibition (Hirose et al. Reference Hirose, Chikazoe, Watanabe, Jimura, Kunimatsu, Abe, Ohtomo, Miyashita and Konishi2012). However, since the significant correlation with disease severity was restricted to right hemisphere structures, our results may be supportive of the intriguing hypotheses that right unilateral DBS of the STN might be a reasonable treatment alternative. Indeed, unilateral DBS of the STN has been shown to modulate motor and cognitive symptoms in Parkinson's disease (Hershey et al. Reference Hershey, Wu, Weaver, Perantie, Karimi, Tabbal and Perlmutter2008). Likewise, in OCD, unilateral treatments have already been explored for other targets, such as the nucleus accumbens, showing partial clinical response (Huff et al. Reference Huff, Lenartz, Schormann, Lee, Kuhn, Koulousakis, Mai, Daumann, Maarouf, Klosterkötter and Sturm2010).
Regarding our findings of increased FC between the BNST and the FPC in patients with OCD, this should be interpreted in the context of anxiety processing. It is well accepted that, although OCD is not classified as an anxiety disorder in the latest version of the Diagnostic and Statistical Manual of Mental Disorders (American Psychiatric Association, 2013), it shares many behavioural and neural characteristics with other anxiety disorders (van den Heuvel et al. Reference van den Heuvel, van Wingen, Soriano-Mas, Alonso, Chamberlain, Nakamae, Denys, Goudriaan and Veltman2016). Indeed, anxiety and distress are important modulators of OCD symptomatology (Gillan et al. Reference Gillan, Robbins, Sahakian, van den Heuvel and van Wingen2016), and limbic circuits involved in anxiety processing have been typically included in neurobiological models of OCD (Milad & Rauch, Reference Milad and Rauch2012). In this context, it should be noted that the BNST has been considered as part of the extended amygdala (Davis et al. Reference Davis, Walker, Miles and Grillon2010), although, whereas the amygdala has been related with transient anxious responses, the BNST has been associated with more sustained anxious responses (Davis et al. Reference Davis, Walker, Miles and Grillon2010; Somerville et al. Reference Somerville, Whalen and Kelley2010; Alvarez et al. Reference Alvarez, Chen, Bodurka, Kaplan and Grillon2011).
Activity in the FPC, as in other medial prefrontal structures, has been shown to downregulate hyperactivation of subcortical limbic structures (Etkin et al. Reference Etkin, Prater, Schatzberg, Menon and Greicius2009). Indeed, increased FC between the FPC and the amygdala has been observed during threat-induced anxiety (Gold et al. Reference Gold, Morey and McCarthy2015), and similar findings could be expected regarding FPC-BNST connectivity during sustained anxiety, although this has not been explored. In any case, the FPC is indeed functionally connected with the BNST (Torrisi et al. Reference Torrisi, O'Connell, Davis, Reynolds, Balderston, Fudge, Grillon and Ernst2015). Therefore, our findings may provide a tentative explanation regarding increased anxiety responses in OCD. We hypothesize that OCD anxiety symptoms may be related with BNST hyperactivation, and that increased FC with the FPC may result from the (unsuccessful) attempts of this cortical region to downregulate abnormally increased BNST activation (see Fig. 3b ), though the correlational nature of the study precludes firm conclusions.
This study has a number of limitations. Firstly, most patients were on medication. Therefore, we cannot determine what effect, if any, concurrent pharmacological treatment had on our results. However, all patients had been stably medicated for at least 3 months before undergoing image acquisition. Moreover, we observed no differences between patients on standard pharmacological regimens and those on treatments denoting a certain degree of pharmacological resistance or with dopaminergic drugs. In any case, it is important to bear in mind that the present study was motivated by the use of the two structures assessed as DBS targets in OCD, and patients undergoing DBS have generally been medicated for a long time. Therefore, the population assessed here is representative of this group of patients with OCD. Secondly, we did not assess possible FC alterations of other clinically effective DBS targets such as, for example, the inferior thalamic peduncle. In this sense, further research is needed to provide a comprehensive description of the alterations in FC associated with the different DBS targets used for OCD. Finally, our analyses have been performed with 1.5 T data, which hinders the localization of tiny subcortical structures such as the ones assessed here. Further research with ultra-high field neuroimaging (i.e. 7 T), as recently reported by Gorka et al. Reference Gorka, Torrisi, Shackman, Grillon and Ernst2017, will certainly permit a better localization of these structures.
In conclusion, this study provides the first evidence of altered FC in patients with OCD from two subcortical regions that are increasingly being used as DBS targets for refractory OCD. The STN showed decreased FC with the lenticular nucleus (including the putamen and the globus pallidum) and increased FC with the premotor cortex, which may relate with the impaired motor response inhibition observed in OCD populations. Likewise, the BNST showed greater FC with the frontopolar cortex, most likely as a consequence of the increased basal tone of this subcortical structure and the attempts of the prefrontal cortex to downregulate its activity and therefore control anxiety symptoms. Such results provide a neurobiological framework to understand the mechanism of action of DBS treatment for OCD.
Supplementary material
The supplementary material for this article can be found at https://doi.org/10.1017/S0033291717002288
Acknowledgements
This study was supported in part by the Carlos III Health Institute (PI13/01958, PI13/00918, PI14/00413 and CIBER-CB06/03/0034); FEDER funds (‘A way to build Europe’) and by the Agency of University and Research Funding Management of the Catalan Government (2014SGR1672). M.C. is supported by a grant from the Spanish Ministry for Education, Culture and Sport (FPU13/02141). M.S. is supported by a Río Hortega contract (CM15/00189), E.R. by a Juan Rodés contract (JR14/00038), and C.S.-M. by a Miguel Servet contract (CPII16/00048) from the Carlos III Health Institute.
Declaration of Interest
None.


