


Introduction
Schizotypy refers to subclinical schizophrenia-like traits found in the general population (Meehl, Reference Meehl1962; Sarig, Dar, & Liberman, Reference Sarig, Dar and Liberman2012). Its clinical manifestations include cognitive-perceptual (positive), interpersonal (negative), and cognitive disorganized features (Polner et al., Reference Polner, Faiola, Urquijo, Meyhöfer, Steffens, Rónai and Ettinger2019; Raine et al., Reference Raine, Reynolds, Lencz, Scerbo, Triphon and Kim1994), which are qualitatively similar to schizophrenia symptoms and correlate with schizophrenia liability (Grant, Green, & Mason, Reference Grant, Green and Mason2018). Schizotypy may represent an ‘endophenotype’ on the path to schizophrenia (Grant, Reference Grant2015), and can be quantitatively assessed using the Schizotypal Personality Questionnaire (SPQ; Raine, Reference Raine1991). Epidemiological studies have shown that the proportion of individuals with a high level of schizotypal traits in the general population is about 10% (Ettinger, Meyhöfer, Steffens, Wagner, & Koutsouleris, Reference Ettinger, Meyhöfer, Steffens, Wagner and Koutsouleris2014; Lenzenweger, Reference Lenzenweger2011). Studying schizotypy could help in understanding schizophrenia-related psychopathology (Kwapil & Barrantes-Vidal, Reference Kwapil and Barrantes-Vidal2014) and putative schizophrenia endophenotypes (Lenzenweger, Reference Lenzenweger2015).
Previous studies have suggested that the neurobiological basis of schizophrenia may be ‘brain disconnection’ or ‘brain dysconnection’ (Friston, Brown, Siemerkus, & Stephan, Reference Friston, Brown, Siemerkus and Stephan2016; Friston & Frith, Reference Friston and Frith1995; Stephan, Friston, & Frith, Reference Stephan, Friston and Frith2009; Wang et al., Reference Wang, Zou, Xie, Yang, Cheung, Sørensen and Chan2018b). Specifically, one study has found that fractional anisotropy values of the fronto-temporal white matter tracts correlated negatively with scores on the SPQ cognitive-perceptual subscale in the general population (Nelson et al., Reference Nelson, Seal, Phillips, Merritt, Wilson and Pantelis2011). Resting-state functional magnetic resonance imaging (rs-fMRI) studies have found that individuals with a high level of schizotypal traits exhibited reduced functional connectivity between the precuneus and the parahippocampus, which was negatively correlated with SPQ total scores (Zhu et al., Reference Zhu, Tang, Zhang, Li, Tang, Li and Wang2017). In the general population, SPQ cognitive-perceptual subscale scores correlated positively with functional connectivity between the ventral striatum and the frontal cortex, and negatively with the functional connectivity between the dorsal striatum and the posterior cingulate cortex (Wang, Ettinger, Meindl, & Chan, Reference Wang, Ettinger, Meindl and Chan2018a, Reference Wang, Zou, Xie, Yang, Cheung, Sørensen and Chan2018b). An independent component analysis study found that SPQ cognitive-perceptual subscale scores correlated positively with low-frequency oscillations of the visual network, while SPQ interpersonal subscale scores correlated negatively with low-frequency oscillations of the auditory network in the general population (Lagioia, Van De Ville, Debbané, Lazeyras, & Eliez, Reference Lagioia, Van De Ville, Debbané, Lazeyras and Eliez2010). These findings suggest that the development of schizotypy may be related to changed brain network connectivity (Mohr & Claridge, Reference Mohr and Claridge2015). Comprehensive investigation in individuals with a high level of schizotypal traits could enhance our understanding of the differences and similarities in structural and functional connectivity changes associated with schizotypy and could identify which of these changes are important in individuals with high schizotypy (Lenzenweger, Reference Lenzenweger2006).
Previous studies on schizotypy have also paid little attention to the time dynamics of functional connectivity. Temporal coupling between brain sub-regions is time-variant rather than time-invariant (Nomi et al., Reference Nomi, Vij, Dajani, Steimke, Damaraju, Rachakonda and Uddin2017). Dynamic functional connectivity (DFC), also called ‘chronnectome’, could provide insight into the mutability of interacted functional connectivity networks. One previous study has found that schizophrenia patients exhibited dynamic changes in thalamic hyperconnectivity and sensory hypoconnectivity (Damaraju et al., Reference Damaraju, Allen, Belger, Ford, McEwen, Mathalon and Calhoun2014). Another study found that individuals with psychotic-like experiences exhibited altered brain dynamics associated with hyperconnectivity of the visual network and hypoconnectivity of the default mode network (Barber, Lindquist, DeRosse, & Karlsgodt, Reference Barber, Lindquist, DeRosse and Karlsgodt2018). Overall, the stability of DFC in individuals with high level of schizotypal traits warrants further investigation.
In this study, we investigated the structural connectivity, static functional connectivity and DFC using diffusion tensor imaging (DTI), and resting-state functional magnetic resonance imaging (rs-fMRI) technology. We estimated structural connectivity by probabilistic tractography and DFC by a new and reliable Dynamic Conditional Correlation (DCC) method (Lindquist, Xu, Nebel, & Caffo, Reference Lindquist, Xu, Nebel and Caffo2014), which is more reliable than slide-window and non-parametric estimation methods with a quantitative description of time-varying characteristics (Choe et al., Reference Choe, Nebel, Barber, Cohen, Xu, Pekar and Lindquist2017). The representative whole-brain template we used in this study was identified by Power et al. (Reference Power, Cohen, Nelson, Wig, Barnes, Church and Petersen2011), which included 264 regions of interest (ROI) belonging to diverse brain networks. The structural connectivity probability, the static mean functional connectivity strength and DFC indices including the DFC variability and the DFC stability between these ROIs were calculated.
Based on previous findings of both deficits and compensatory brain connectivity changes between brain regions or networks associated with the development of schizophrenia spectrum disorder (Abram et al., Reference Abram, Wisner, Fox, Barch, Wang, Csernansky and Smith2017; Andreasen, Paradiso, & O'leary, Reference Andreasen, Paradiso and O'leary1998; Chan et al., Reference Chan, Yan, Qing, Wang, Wang, Ma and Yu2011; Cho et al., Reference Cho, Shenton, Kubicki, Jung, Lee, Yun and Kwon2015; Pettersson-Yeo, Allen, Benetti, McGuire, & Mechelli, Reference Pettersson-Yeo, Allen, Benetti, McGuire and Mechelli2011), we propose a neurobiological developmental possibility of schizophrenia called the ‘Connectivity Decompensation Hypothesis’, which hypothesize that the pathological development of schizophrenia spectrum continuum is a gradual process from functional compensation to partial decompensation to complete decompensation. In this model, some neural circuits associated with emotion, sensory and perceptual inference may gradually become impaired in susceptible individuals due to a combination of genetic and/or undesirable internal and external environmental factors (Friston et al., Reference Friston, Brown, Siemerkus and Stephan2016). These abnormalities could still be partially compensated initially and these individuals could maintain normal functioning by gradual structural proliferation, remyelination, adaptive functional adjustment or reorganization of brain sub-regions associated with cognitive regulation and self-monitoring (Mohr & Claridge, Reference Mohr and Claridge2015). The majority of them would never develop the illness. However, if these predisposing factors are excessive and persistent, or if neural compensation mechanisms fail, psychotic-like features and cognitive function maladjustment could be further aggravated, leading to clinical illness onset. Individuals with a high level of schizotypal traits are in the early stage of this process, and investigation of them could offer the best opportunity for early intervention and prevention and avoid confounding factors such as antipsychotic medication exposure and psychiatric comorbidities (Barrantes-Vidal, Grant, & Kwapil, Reference Barrantes-Vidal, Grant and Kwapil2015).
Thus, the objectives of our study were (1) to investigate common and specific changes in functional and structural connectivity in individuals with a high level of schizotypal traits compared with controls; and (2) to verify the connectivity decompensation hypothesis in individuals with a high level of schizotypal traits. If functional and structural connectivity between ROIs were both increased in the high schizotypy group, it could be considered as a compensation effect in this pathway. If functional connectivity between ROIs were decreased while structural connectivity was increased, it could imply decompensation. Based on previous studies, we hypothesized that changes in structural and functional connectivity in individuals with a high level of schizotypal traits would exhibit both decompensatory and compensatory effects, which could indicate ‘brain disconnection’.
Material and methods
Participants
We first collected 4000 online schizotypal personality questionnaire (SPQ) responses from various universities randomly in Beijing through advertisement in 2018. Every voluntary participant was a college student and was paid. The 90th percentile of the SPQ total score (41 points) among these participants was taken as the cut-off score, which was in accord with previous studies setting individuals scoring in the top 10% of SPQ scores in the general population as the high schizotypy group (Chan et al., Reference Chan, Yan, Qing, Wang, Wang, Ma and Yu2011; Ettinger et al., Reference Ettinger, Meyhöfer, Steffens, Wagner and Koutsouleris2014; Lenzenweger, Reference Lenzenweger2011; Shan et al., Reference Shan, Zhang, Jiang, Wang, Liu, Cheung and Chan2020; Shi et al., Reference Shi, Liu, Shi, Yan, Wang, Wang and Chan2017; Wang et al., Reference Wang, Yan, Yin, Fan, Cheung, Pantelis and Chan2014, Reference Wang, Yang, Cai, Zhou, Zhang, Yang and Chan2020a, Reference Wang, Zhang, Cai, Yang, Cheung and Chan2020b). Students with a score above 41 were assigned to the high schizotypy group, and those with a score below 41 were assigned as controls. Then individuals allocated to the high schizotypy group and a corresponding number of controls were contacted by text message to invite them to participate in the subsequent MRI experiment. Of the total, 90% of the participants responded to the online survey. Of which, 246 responders agreed to undertake the brain scan. Inclusion criteria for all participants included Han ethnicity and aged 18 years or above. Exclusion criteria for all participants included any diagnosis of physical or psychiatric disorders and substance dependence, any family history of psychiatric disorder and any contraindications for MRI scanning. In addition, any participant who did not complete all study procedures, whose imaging quality was poor, and who had head motions greater than 2 mm and/or 2° during scanning were excluded. With these criteria, 35 participants were excluded. The study was approved by the Ethics Committee of the Department of Psychology, the University of the Chinese Academy of Sciences. All participants gave written informed consent.
Questionnaire assessment
The SPQ is a 74-item self-assessment scale that assesses schizotypal traits (Raine, Reference Raine1991). These items can be clustered into three factors, namely the cognition-perceptual, interpersonal and disorganization factors (Chen, Hsiao, & Lin, Reference Chen, Hsiao and Lin1997). The Chinese version of the SPQ has been shown to possess good psychometric properties (Cronbach α coefficient = 0.91, test-retest reliability = 0.82; Chen et al., Reference Chen, Hsiao and Lin1997; Wang et al., Reference Wang, Wang, Yan, Wang, Cheung and Chan2013). The intelligence quotient (IQ) of all participants was estimated with the short-form of the Chinese version of the Wechsler Adult Intelligence Scale – Revised (Gong, Reference Gong1992). The participants were asked to fill in the SPQ again before MRI scanning so that their SPQ scores were determined on the same day as the IQ estimation.
MRI acquisition
After the participants had completed the questionnaire assessment, resting-state functional magnetic resonance (rs-fMRI), anatomical and diffusion tensor images (DTI) were acquired in sequence using a 3.0 T GE MR scanner at the Institute of Psychology, the Chinese Academy of Sciences, Beijing, China from 2018 to 2019. Rs-fMRI was obtained using a T2-weighted echo planar imaging (EPI) sequence. Three hundred volumes were acquired with 37 slices, a slice thickness of 3.5 mm, a slice spacing of 0.5 mm, repetition time (TR) of 2000 ms, echo time (TE) of 30 ms, a field of view (FOV) of 220 mm, flip angle of 90°, in-plane acquisition matrix size of 64 × 64, and voxel size of 3.4 × 3.4 × 4 mm3.
The anatomical images were obtained using a T1-weighted sagittal oriented magnetization prepared rapid gradient echo (MPRAGE) sequence with the following parameters: 176 slices, a slice thickness of 1 mm, TR of 6.90 ms, TE of 2.99 ms, FOV of 256 mm, flip angle of 8°, inversion time of 450 ms, matrix size of 256 × 256, and voxel size of 1 × 1 × 1 mm3.
DTI with 64 directions were acquired with a spin echo pulse sequence: 74 slices, thickness of 2 mm, TR of 8500 ms, TE of 81 ms, FOV of 256 mm, flip angle of 90°, b-value of 1000 s/mm2, matrix size of 128 × 128, and voxel size of 2 × 2 × 2 mm3.
DTI data preprocessing
DTI data were preprocessed by the FSL (https://fsl.fmrib.ox.ac.uk/fsl; Smith et al., Reference Smith, Jenkinson, Johansen-Berg, Rueckert, Nichols, Mackay and Behrens2006) and PANDA 1.3.1 (http://www.nitrc.org/projects/panda; Cui, Zhong, Xu, He, & Gong, Reference Cui, Zhong, Xu, He and Gong2013). The processing was the same as our another schizophrenia DTI study (Wang et al., Reference Wang, Yang, Cai, Zhou, Zhang, Yang and Chan2020a). The data weres first screened by an experienced radiologist to rule out incidental structural abnormalities. Two participants were excluded. The raw images were then cropped using the fslroi command of the FSL (for DWI, f(skull removal) of 0.25; for T1 imaging, f(skull removal) of 0.5; cropping gap is 3 mm). Correction of DWI eddy-current induced distortion and head motion during scanning was then carried out. DWI was registered to the b-value of 0 images with affine transformation (the average of these b-values was used as reference). Individual images in native space were normalized to the FMRIB58_FA template (https://fsl.fmrib.ox.ac.uk/fsl/fslwiki/FMRIB58_FA) in MNI space (Mori et al., Reference Mori, Oishi, Jiang, Jiang, Li, Akhter and Mazziotta2008), and smoothed using a 6 mm Gaussian kernel. Then test bvecs utility was used to find the correct Invert and Swap parameter of the DWI orientation. BedpostX was used to build up distributions on diffusion parameters at each voxel and create all the files necessary for running the next probabilistic tractography procedure with the following parameters: fibres = 2, weight = 1, and Burn-in = 1000 (Behrens, Berg, Jbabdi, Rushworth, & Woolrich, Reference Behrens, Berg, Jbabdi, Rushworth and Woolrich2007). Probabilistic tractography between 264 ROIs with 6 mm radius was performed with the following parameters: curvature threshold = 0.2, maximum number of steps = 1000, step length = 0.5 mm, number of samples = 50 000, and tracking type of path distribution (Cho et al., Reference Cho, Shenton, Kubicki, Jung, Lee, Yun and Kwon2015). For each ROI, probabilistic tractography was performed by seeding from all voxels in a particular ROI. The white matter connection probability from ROI i to ROI j was defined by the number of water molecules passing through ROIs divided by the total number of fibres sampled from the ROIs (Behrens et al., Reference Behrens, Berg, Jbabdi, Rushworth and Woolrich2007). A 264 ROIs × 264 ROIs probabilistic matrix was generated for every participant. Then a threshold value of 0.001 was applied to reduce false-positive connections between ROIs (Fang et al., Reference Fang, Zeng, Shen, Wang, Li, Liu and Hu2012). Since the connection probability from region i to region j was not necessarily equivalent to the one from j to i, these two probabilities were averaged to acquire a symmetrical non-directional connectivity matrix for each participant, which resulted in 34 716 connection probability values.
Rs-fMRI data preprocessing
Rs-fMRI data were preprocessed by the Statistical Parametric Mapping Software (SPM12, https://www.fil.ion.ucl.ac.uk/spm/) and Data Processing & Analysis for Brain Imaging (DPABI4.0, http://www.rfmri.org/dpabi) and brainwavelet 1.1 (http://www.brainwavelet.org) Software in MATLAB R2016b (MathWorks Inc., https://www.mathworks.com; Patel et al., Reference Patel, Kundu, Rubinov, Jones, Vértes, Ersche and Bullmore2014; Yan & Zang, Reference Yan and Zang2010). The first 10 volumes were discarded. Then slice timing, realignment and wavelet despiking were performed using DPABI and brainwavelet, respectively. Subsequently, nuisance covariates, including Friston 24 head motion parameters, white matter signal and cerebrospinal fluid signal were regressed out (Friston, Williams, Howard, Frackowiak, & Turner, Reference Friston, Williams, Howard, Frackowiak and Turner1996). Structural images were manually co-registered and realigned with the anterior commissure-posterior commissure line, and co-registered to the mean functional image, and segmented as grey matter, white matter and cerebrospinal fluid using DARTEL in SPM. Then each functional image was normalized to standard Montreal Neurological Institute space in 3 × 3 × 3 mm3 voxels and the images were then band-pass filtered (0.01–0.1 Hz). Spatial smoothing was performed with a 6 mm full-width at half-maximum kernel. The mean frame-wise displacement (FD) was included as a covariate in the subsequent analysis (Power, Barnes, Snyder, Schlaggar, & Petersen, Reference Power, Barnes, Snyder, Schlaggar and Petersen2012; Yan et al., Reference Yan, Cheung, Kelly, Colcombe, Craddock, Di Martino and Milham2013). The time series of 264 ROIs with 6 mm radius of each participant were then extracted. The resting-state fMRI networks were constructed using Pearson correlation in the DPABI 4.0, and dynamic brain networks were constructed using the dynamic conditional correlation (DCC) script in the dynamic connectivity toolbox of Martin Lindquist in MATLAB 2016b (Lindquist et al., Reference Lindquist, Xu, Nebel and Caffo2014; https://github.com/canlab/ Lindquist_Dynamic_Correlation). A 264 ROIs × 264 ROIs static functional connectivity matrix and 264 ROIs × 264 ROIs × 290 time series DFC matrix of every participant were generated. The mean functional connectivity strength, the DFC standard deviation and the DFC stability of every connection between two ROIs were calculated, which resulted in 34 716 values. DFC standard deviation (variability) indicates the overall fluctuation level of DFC over time. DFC stability describes the continuousness of the temporal changes in DFC between adjacent time series (Liu, Liao, Xia, & He, Reference Liu, Liao, Xia and He2018). The formula for DFC stability is:

where r (i,j)t is the strength of functional connectivity between node i and node j at time t; T is the total number of time series: 290.
Data analysis
ANCOVA analysis of the mean functional connectivity strength, the DFC variability, the DFC stability, the white matter connectivity probability between the two groups was performed while regressing out the gender, age, IQ (FD values were also entered as a covariate in the functional connectivity analysis) based on a false discovery rate (FDR) of 0.05 using the network-based statistic software and Matlab 2016b (Verhoeven, Simonsen, & McIntyre, Reference Verhoeven, Simonsen and McIntyre2005; Zalesky, Fornito, & Bullmore, Reference Zalesky, Fornito and Bullmore2010). The resultant images were visualized with BrainNet Viewer (https://www.nitrc.org/projects/bnv; Xia, Wang, & He, Reference Xia, Wang and He2013). Finally, Pearson correlation analysis were performed between connection probability and functional connectivity values with significant group differences and SPQ scores within the high schizotypy group while regressing out the gender, age, IQ (and FD in functional connectivity analysis) with a significance level set at FDR 0.05 correction using fdr_bh function in matlab 2016b (Benjamini & Hochberg, Reference Benjamini and Hochberg1995).
Results
After screening and quality control, 87 individuals with high schizotypy and 122 controls were included in the final analysis. The mean age, IQ and FD of all participants was 21.44 years (s.d. = 2.18, range = 18–28 years), 124.89 (s.d. = 9.08, range = 90–145), 0.05 (s.d. = 0.02, range = 0.02–0.20) respectively. There were no significant differences between the two groups in gender, age, IQ and mean FD (38 men and 49 women, age = 21.17 ± 2.22, IQ = 125.15 ± 9.14, mean FD = 0.05 ± 0.03 in the high scizotypy group; 38 men and 84 women, age = 21.62 ± 2.15, IQ = 124.72 ± 9.04, mean FD = 0.05 ± 0.02 in the control group). The two groups differed significantly in SPQ scores (48.60 ± 5.53 in the high schizotypy group; 23.43 ± 10.62 in controls; t = 20.22, p < 0.001).
Compared with controls, the high schizotypy group exhibited increased white matter connectivity probability between the right insula (the cingulo-opercular task control network, COTCN) and the right middle frontal gyrus (the fronto-parietal task control network, FPTCN); between the left precuneus (the default mode network; DMN) and the left angular gyrus (the DMN); and increased DFC variability and decreased stability between the right precuneus (the DMN) and the left middle temporal gyrus (the DMN); as well as decreased stability between the right superior temporal gyrus (the auditory network) and the right putamen (the subcortical network), and between the left precuneus (the DMN) and the left middle occipital gyrus (the DMN).
In addition, 18 mean functional connectivity strength values exhibited significant between-group differences. Sixteen of them were decreased in the high schizotypy group compared with controls, which mainly involved the sensorimotor network, the auditory network, the visual network, the DMN and the task control network. Increased strength values were found between the left superior frontal gyrus (the FPTCN) and the right rolandic operculum area (the auditory network), and between the right superior frontal gyrus (the DMN) and the right medial superior frontal gyrus (medsFG, the DMN; see Table 1 and Fig. 1).
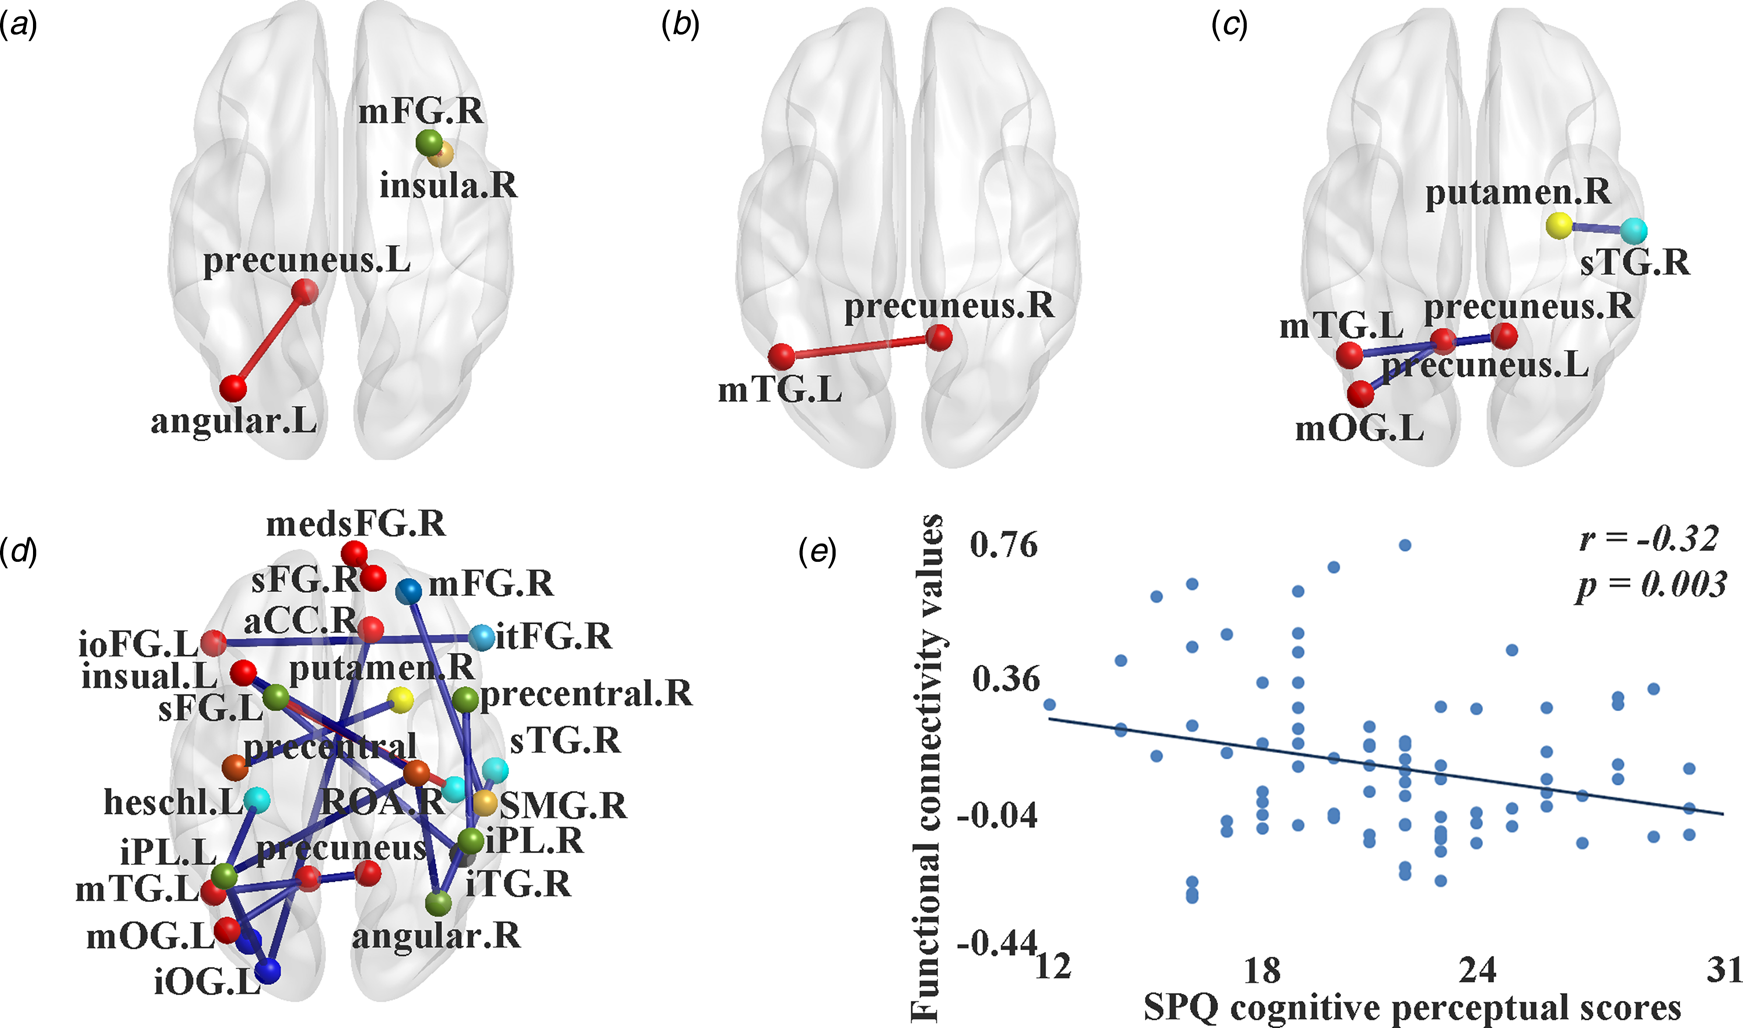
Fig. 1. Significant differences of white connectivity probability and functional connectivity values between individuals with high schizotypy and controls. (a) Significant differences in white matter connectivity probability. (b) Significant differences in dynamic functional connectivity variability. (c) Significant differences in dynamic functional connectivity stability. (d) Significant differences in static mean functional connectivity strength. (e) The negative correlation between SPQ cognitive-perceptual scores and static mean functional connectivity strength between the left middle occipital gyrus and the left inferior parietal lobule. In (a–d), red line, significant increased values in individuals with high schizotypy; blue line, significant decreased values in individuals with high schizotypy; red spot: sub-regions of the default mode network; light blue spot: sub-regions of the salience network; crimson spot: sub-regions of the sensorimotor network; blue spot: sub-regions of the visual network; green spot: sub-regions of the auditory network; cyan spot: sub-regions of the ventral attention network; lawngreen spot: sub-regions of the frontal-parietal task control network; orange spot: sub-regions of the cingulo-opercular task control network; yellow spot: sub-regions of the subcortical network; black spot: sub-regions of the uncertain area. SPQ, schizotypal personality questionnaire; medsFG, medial superior frontal gyrus; ioFG, inferior frontal gyrus, orbital part; itFG, inferior frontal gyrus, triangular part; sFG, superior frontal gyrus; mFG, middle frontal gyrus; aCC, anterior cingulate cortex; iPL, inferior parietal lobule; mOG, middle occipital gyrus; iOG, inferior occipital gyrus; sTG, superior temporal gyrus; mTG, middle temporal gyrus; iTG, inferior temporal gyrus; SMG, supramarginal gyrus; ROA, rolandic operculum area; L, left; R, right.
Table 1. Significant white and dynamic functional connectivity differences between the high schizotypal groups and controls

ROI, region of interest; SCP, structural connection probability; DFC, dynamic functional connectivity; SFC, static functional connectivity; s.d., standard deviation; sta, stability; NaN, not a number or un-significant; DMN, default mode network; SN, salience network; VAN, ventral attention network; FPTCN, fronto-parietal task control network; COTCN, cingulo-opercular taskcontrol network; SMN, sensorimotor network; VN, visual network; AN, auditory network; SCN, subcortical network; UN, uncertain area; medsFG, medial superior frontal gyrus; ioFG, inferior frontal gyrus, orbital part; itFG, inferior frontal gyrus, triangular part; sFG, superior frontal gyrus; mFG, middle frontal gyrus; aCC, anterior cingulate cortex; iPL, inferior parietal lobule; mOG, middle occipital gyrus; iOG, inferior occipital gyrus; sTG, superior temporal gyrus; mTG, middle temporal gyrus; iTG, inferior temporal gyrus; SMG, supramarginal gyrus; ROA, rolandic operculum area; L, left; R, right; regions are presented as name (network, peak MNI coordinates); values are presented as means (standard deviation).
**FDR 0.05 corrected; *p < 0.05, uncorrected.
Correlation analysis in the high schizotypy group found that scores on the SPQ cognition-perceptual subscale were negatively correlated with the mean functional connectivity strength between the left middle occipital gyrus (the visual network) and the left inferior parietal lobule (the FPTCN; r = −0.32, p = 0.003).
Discussion
In this study, we investigated changes in both whole-brain structural and functional connectivity in individuals with a high level of schizotypal traits. We found increased DFC variability, decreased DFC stability, and static functional connectivity strength within sub-regions of the posterior DMN and within the task control network, and decreased static functional connectivity strength between the auditory network and the task control network in the high schizotypy group. At the same time, structural connectivity between them was significantly increased in the high schizotypy group. These results support our connectivity decompensation hypothesis in individuals with high schizotypy. However, we also found increased static functional connectivity strength within the sub-regions of the anterior DMN, and between the FPTCN and the auditory network, and increased structural connectivity between the FPTCN and the auditory network in the high schizotypy group, which may indicate compensatory effects. At the same time, we found both decreased static functional connectivity and structural connectivity between the superior temporal gyrus (the auditory network) and the angular gyrus (the FPTCN). It may represent impaired neural pathways. Finally, we did not find any pathway with both increased functional connectivity and decreased structural connectivity. Our findings could extend our understanding of the temporal dynamic coupling between brain sub-regions and may provide insight into the separated large-scale brain structural and functional connectivity patterns in the high schizotypy group (Loas, Monestes, Ingelaere, Noisette, & Herbener, Reference Loas, Monestes, Ingelaere, Noisette and Herbener2009). Moreover, our results support our hypothesis of the coexistence of ‘brain connectivity decompensation’ and ‘brain connectivity compensation’ in individuals with a high level of schizotypal traits.
Previous meta-analytic studies have reported that schizophrenia patients mainly exhibit a reduction in structural connectivity, especially at the frontal lobe and the temporal lobe (Ellison-Wright & Bullmore, Reference Ellison-Wright and Bullmore2009; Pettersson-Yeo et al., Reference Pettersson-Yeo, Allen, Benetti, McGuire and Mechelli2011). In contrast, we found that individuals with high schizotypy exhibited increased white matter connectivity probability between the right insula (the COTCN) and the right middle frontal gyrus (mFG, the FPTCN), and between the left precuneus (the DMN) and the left angular gyrus (the DMN) compared with controls. The angular gyrus and the insula integrate and connect numerous surrounding regions (Seghier, Reference Seghier2013; Uddin, Nomi, Hebert-Seropian, Ghaziri, & Boucher, Reference Uddin, Nomi, Hebert-Seropian, Ghaziri and Boucher2017) and increased structural connectivity between these regions may represent a compensatory mechanism associated with synaptic plasticity and axonal proliferation, which mitigate dysfunctional executive control and self-sensory integration (Cai, Ryali, Chen, Li, & Menon, Reference Cai, Ryali, Chen, Li and Menon2014; Nelson et al., Reference Nelson, Seal, Phillips, Merritt, Wilson and Pantelis2011; Stephan et al., Reference Stephan, Friston and Frith2009; Zhu et al., Reference Zhu, Tang, Zhang, Li, Tang, Li and Wang2017). Whether these compensatory changes in white matter pathways are effective or not could be speculated from their functional connectivity changes.
However, we also found that increased DFC variability decreased DFC stability, and static functional connectivity strength within sub-regions of the posterior DMN and within the task control network, and a negative correlation between SPQ cognition-perceptual subscale scores and the mean functional connectivity strength between the sub-regions of the visual network and the task control network in the high schizotypy group. These dysfunctions may be associated with unstable brain activity, disordered self-referential thought, and impaired consciousness (Crone et al., Reference Crone, Schurz, Höller, Bergmann, Monti, Schmid and Kronbichler2015; Hare et al., Reference Hare, Ford, Mathalon, Damaraju, Bustillo, Belger and Turner2018), and may be the important neuro-functional basis of abnormal perception and suspiciousness in individuals with a high level of schizotypal traits (Wong & Raine, Reference Wong and Raine2018). Together with the results of increased structural connectivity between them in the high schizotypy group, this may indicate discordant brain connectivity and ineffective neurological compensation between these regions in individuals with a high level of schizotypal traits, and support the presence of connectivity decompensation within the posterior DMN, and between the auditory network, the visual network and the task control network during the development of schizophrenia spectrum disorders.
Furthermore, the high schizotypy group also exhibited decreased DFC stability and static functional connectivity strength between sub-regions of the auditory network, the sensorimotor network and the putamen; as well as decreased static functional connectivity strength mainly between the sensorimotor network, the auditory network, the visual network, the DMN and the task control network compared with controls. The former may reflect that ineffective dopaminergic transmission for processing afferent sensory signals have already emerged in individuals with high schizotypy (Pawlak & Kerr, Reference Pawlak and Kerr2008). The latter may indicate dysfunctional segregation between auditory, visual, perceptual processing, and cognitive control ability (Carter et al., Reference Carter, Astafiev, Lang, Connor, Rengachary, Strube and Corbetta2010; Rolland et al., Reference Rolland, Amad, Poulet, Bordet, Vignaud, Bation and Jardri2015), deficits in self-awareness and external environmental information integration and perception-behaviour integration (Friston & Frith, Reference Friston and Frith1995; Moore & Pope, Reference Moore and Pope2014). These changes may be the key features associated with early psychosis proneness including cognitive disturbances (Kraguljac et al., Reference Kraguljac, White, Hadley, Hadley, ver Hoef, Davis and Lahti2016; Wang et al., Reference Wang, Zou, Xie, Yang, Cheung, Sørensen and Chan2018b; Woodward, Rogers, & Heckers, Reference Woodward, Rogers and Heckers2011), and the tendency to favour prior subjective knowledge rather than incoming sensory information (Friston et al., Reference Friston, Brown, Siemerkus and Stephan2016; Rolland et al., Reference Rolland, Amad, Poulet, Bordet, Vignaud, Bation and Jardri2015). Furthermore, most of these sub-regions with decreased functional connectivity features did not exhibit any changes in structural connectivity, suggesting that these dysfunctions may be caused by grey matter neuronal dendritic changes or mediated by other connectivity (Timmler & Simons, Reference Timmler and Simons2019).
In addition, we found increased static functional connectivity strength within the sub-regions of the anterior DMN, mainly between the superior frontal gyrus and the medsFG, and between sub-regions of the FPTCN and the auditory network, and increased structural connectivity between the FPTCN and the auditory network in the high schizotypy group. The increased connectivity between these sub-regions may indicate their self-adaptive efforts of advanced cognitive regulation for relieving sensorimotor and social-emotional dysfunction (Mohr & Claridge, Reference Mohr and Claridge2015; Yin et al., Reference Yin, Jin, Hu, Duan, Li, Song and Li2011). This may be an important neurobiological compensatory mechanism for maintaining normal social behaviour in individuals with high schizotypy. The neurochemical basis of these changes may be due to the increase in functionally overlapping neural transmitters such as dopamine, glutamine, acetylcholine, and 5-hydroxytryptamine together with synaptic plasticity and axonal proliferation (Friston et al., Reference Friston, Brown, Siemerkus and Stephan2016; Lau & Zukin, Reference Lau and Zukin2007; Miuller & Schwarz, Reference Miuller and Schwarz2007; Wolf, Reference Wolf2003; Wolf, Mangiavacchi, & Sun, Reference Wolf, Mangiavacchi and Sun2003). We also found both decreased static functional connectivity and structural connectivity between the superior temporal gyrus (the auditory network) and the angular gyrus (the FPTCN) in the high schizotypy group. It may indicate defective axonal function associated with abnormal auditory sensory monitoring and self-referential processing (Cui et al., Reference Cui, Liu, Guo, Chen, Chen, Xi and Wang2017; Friston et al., Reference Friston, Brown, Siemerkus and Stephan2016).
Taken together, these structural and functional connectivity results may imply that enhanced connectivity within the DMN and within the task control network could not completely compensate for sensory-perceptual dysfunctional changes in individuals with a high level of schizotypal traits (Lindner, Thier, Kircher, Haarmeier, & Leube, Reference Lindner, Thier, Kircher, Haarmeier and Leube2005). The aberrant synaptic integration caused by hypofunction of the n-methyl-d-aspartate receptors (NMDAR) rather than axonal pathology may be the key neurochemical basis of the majority of decreased functional connectivity in individuals with high schizotypy (Tseng & O'Donnell, Reference Tseng and O'Donnell2004; Wei et al., Reference Wei, Lin, Wu, Jin, Lee and Wu2006), and these changes may correlate with schizophrenia genetic risk variants including DISC1, PPP1R1B, PRODH, and ZNF804A (Mothersill, Kelly, Rose, & Donohoe, Reference Mothersill, Kelly, Rose and Donohoe2012). Meanwhile, white matter structural alterations found in schizophrenia patients may be the pathophysiological consequence of deteriorating schizophrenia symptoms rather than the cause of the disorder (Friston et al., Reference Friston, Brown, Siemerkus and Stephan2016).
This study has several limitations. First, we ascertained the absence of a psychiatric diagnosis, medication exposure, and history of psychiatric disorders of the participants only by self-report. The structured clinical interview should be adopted for higher validity in future studies. Secondly, it is difficult to clearly distinguish between compensatory and abnormal brain functional changes, and some other indirect pathways or dendritic connections between brain regions could also take effect (Timmler & Simons, Reference Timmler and Simons2019). Thus, our connectivity decompensation hypothesis requires further verification. Furthermore, the correlation between macroscopic connectivity and microscopic neurotransmitter and synaptic changes also requires further investigation. For example, inhibition of the dopamine D2 receptor could enhance NMDAR-dependent synaptic plasticity (Laruelle, Frankle, Narendran, Kegeles, & Abi-Dargham, Reference Laruelle, Frankle, Narendran, Kegeles and Abi-Dargham2005), which may be crucial for schizophrenia pathophysiology (Abi-Saab, D'ouza, Moghaddam, & Krystal, Reference Abi-Saab, D'Souza, Moghaddam and Krystal1998; Hahn et al., Reference Hahn, Wang, Cho, Talbot, Gur, Berrettini and Arnold2006). Finally, investigations on specific schizotypal dimensions or symptoms are also important and future studies could focus on specific brain features of positive schizotypy or negative schizotypy or unusual perception or anhedonia.
In conclusion, our results suggest that individuals with high schizotypy exhibited both compensatory and deficient connectivity mainly associated with the DMN, the task control network and the sensorimotor network. Our results indicate the underlying brain connectivity adaptive changes in individuals with high schizotypy and provide a possible neurobiological basis for the connectivity decompensation hypothesis in schizophrenia spectrum disorders.
Acknowledgements
This work was supported by the National Key Research and Development Programme (2016YFC0906402), the Beijing Municipal Science & Technology Commission Grant (Z161100000216138), the Beijing Training Project for the Leading Talents in S & T (Z151100000315020), the Strategic Priority Research Program (B) of the Chinese Academy of Science (XDB02030002), and the CAS Key Laboratory of Mental Health, Institute of Psychology.
Author contributions
YM Wang collected, analyzed and interpreted the data, and wrote up the drafts of the manuscript. YM Wang, XL Cai, RT Zhang, YJ Zhang, HY Zhou, YY Wang, Y Wang, Y Wang, and J Huang collected the data, administered assessment and interpreted the findings. EFC Cheung interpreted the findings and commented on the drafts critically. RCK Chan generated the idea, designed the study, interpreted the findings, and commented on the drafts critically.
Conflict of interest
The authors report no conflict of interest.


