


Introduction
Despite bipolar disorder (BD) being a highly heritable condition, no well-replicated neuroimaging risk markers for BD have been identified. Interpretation of neuroimaging abnormalities in those with established BD is challenging, as observed changes may represent either causes or consequences of the illness, or be related to its treatment (Hajek et al. Reference Hajek, Carrey and Alda2005). As first-degree relatives of patients with BD are relatively free of psychotropic medications and illness burden, imaging studies of BD offspring and siblings may shed light on biological risk factors involved in the development of this condition.
Previous meta-analyses of grey matter volume in patients with established BD have reported heterogeneity of findings across studies (McDonald et al. Reference McDonald, Zanelli, Rabe-Hesketh, Ellison-Wright, Sham, Kalidindi, Murray and Kennedy2004b ; Selvaraj et al. Reference Selvaraj, Arnone, Job, Stanfield, Farrow, Nugent, Scherk, Gruber, Chen and Sachdev2012). Furthermore, findings of grey matter volumetric studies of high-risk cohorts have also been inconsistent (Ladouceur et al. Reference Ladouceur, Almeida, Birmaher, Axelson, Nau, Kalas, Monk, Kupfer and Phillips2008; Karchemskiy et al. Reference Karchemskiy, Garrett, Howe, Adleman, Simeonova, Alegria, Reiss and Chang2011; Hajek et al. 2013), although reports of increased insular cortex and right inferior frontal gyrus (IFG) volumes have been replicated (Walterfang et al. Reference Walterfang, Wood, Barton, Velakoulis, Chen, Reutens, Kempton, Haldane, Pantelis and Frangou2009; Matsuo et al. Reference Matsuo, Kopecek, Nicoletti, Hatch, Watanabe, Nery, Zunta-Soares and Soares2012; Hajek et al. Reference Hajek, Cullis, Novak, Kopecek, Blagdon, Propper, Stopkova, Duffy, Hoschl and Uher2013). The heterogeneity of the results may be related to methodological differences such as the age of subjects, small sample sizes and the particular neuroimaging technique used.
To date, the majority of structural neuroimaging studies in BD have examined grey matter volume. As cortical volume is a function of both cortical thickness and area, a reduction in cortical volume may be due to reduced thickness, reduced area or both. Importantly, recent studies have found that cortical thickness and surface area are genetically and phenotypically independent (Winkler et al. Reference Winkler, Kochunov, Blangero, Almasy, Zilles, Fox, Duggirala and Glahn2010). Area and thickness are also believed to arise from different progenitor cells, which create glial cells and neurons at distinct points in cortex development, resulting in surface area ultimately reflecting the number of cortical columns and cortical thickness representing the number of neurons within the columns (Pontious et al. Reference Pontious, Kowalczyk, Englund and Hevner2007). Morphometric studies investigating the neuroanatomical substrates of heritable neuropsychiatric disorders, such as BD, should therefore separately assess cortical thickness and surface area. Advances in the analysis of neuroimaging data using programs such as FreeSurfer now permit independent measurements of multiple parameters including grey and white matter volumes, cortical thickness and surface area (Dale et al. Reference Dale, Fischl and Sereno1999; Alemán-Gómez et al. Reference Alemán-Gómez, Janssen, Schnack, Balaban, Pina-Camacho, Alfaro-Almagro, Castro-Fornieles, Otero, Baeza and Moreno2013).
Previous studies have reported reduced cortical thickness in BD (Lyoo et al. Reference Lyoo, Sung, Dager, Friedman, Lee, Kim, Kim, Dunner and Renshaw2006; Foland-Ross et al. Reference Foland-Ross, Thompson, Sugar, Madsen, Shen, Penfold, Ahlf, Rasser, Fischer and Yang2011; Hegarty et al. Reference Hegarty, Foland-Ross, Narr, Sugar, McGough, Thompson and Altshuler2012; Hulshoff Pol et al. Reference Hulshoff Pol, van Baal, Schnack, Brans, van der Schot, Brouwer, van Haren, Lepage, Collins, Evans, Boomsma, Nolen and Kahn2012). One study has reported both reductions in cortical thickness and increases in surface area in BD (Hartberg et al. Reference Hartberg, Sundet, Rimol, Haukvik, Lange, Nesvåg, Dale, Melle, Andreassen and Agartz2011). Three others have distinguished between cortical thinning and reduced cortical surface area in BD, finding regional reductions in cortical thickness, but no significant changes in surface area (Fornito et al. Reference Fornito, Malhi, Lagopoulos, Ivanovski, Wood, Saling, Pantelis and Yücel2008; Rimol et al. Reference Rimol, Nesvåg, Hagler, Bergmann, Fennema-Notestine, Hartberg, Haukvik, Lange, Pung and Server2012; Elvsåshagen et al. Reference Elvsåshagen, Westlye, Bøen, Hol, Andreassen, Boye and Malt2013).
Few studies have reported on abnormalities in cortical thickness in those at high risk for BD. Unaffected co-twins of BD patients have been found to have a thicker hippocampus compared with controls (Van Erp et al. Reference van Erp, Thompson, Kieseppa, Bearden, Marino, Hoftman, Haukka, Partonen, Huttunen, Kaprio, Lonnqvist, Poutanen, Toga and Cannon2012), while thinning of the corpus callosum was seen in BD subjects but not their at-risk relatives (Walterfang et al. Reference Walterfang, Wood, Barton, Velakoulis, Chen, Reutens, Kempton, Haldane, Pantelis and Frangou2009). Genetic liability scores for BD have been associated with thinner hippocampal and orbitofrontal cortices and thicker temporoparietal and left superior motor cortices (Hulshoff Pol et al. 2012). To the best of our knowledge, no study has reported on surface area in unaffected relatives of patients with BD, or the independent contributions of cortical thickness and surface area to volumetric differences in regions relevant to emotion regulation in this at-risk population.
To date, the few studies examining white matter volume in individuals at high genetic risk of BD have reported reductions in the right medial frontal gyrus (Matsuo et al. Reference Matsuo, Kopecek, Nicoletti, Hatch, Watanabe, Nery, Zunta-Soares and Soares2012) and an association between genetic liability and white matter deficits in the CC and temporoparietal regions (McDonald et al. Reference McDonald, Bullmore, Sham, Chitnis, Wickham, Bramon and Murray2004a ). Previous investigations have also identified decreased corpus callosal thickness (Walterfang et al. Reference Walterfang, Wood, Barton, Velakoulis, Chen, Reutens, Kempton, Haldane, Pantelis and Frangou2009) and volumetric reductions in the anterior limb of the internal capsule in BD probands (McIntosh et al. Reference McIntosh, Job, Moorhead, Harrison, Lawrie and Johnstone2005), when compared with unaffected relatives and controls.
The aim of this study was to test the hypothesis that first-degree relatives of BD patients who have not developed BD themselves have regional morphometric abnormalities in fronto-limbic regions, using multiple complementary measures of brain morphometry. Despite considerable heterogeneity regarding the direction of findings, BD is consistently associated with fronto-limbic differences. Vulnerable brain areas in fronto-limbic networks that subserve cognitive and emotional regulation were selected based on previous findings in patients with established BD and those at high risk (Selvaraj et al. Reference Selvaraj, Arnone, Job, Stanfield, Farrow, Nugent, Scherk, Gruber, Chen and Sachdev2012; Strakowski et al. Reference Strakowski, Adler, Almeida, Altshuler, Blumberg, Chang, DelBello, Frangou, McIntosh, Phillips, Sussman and Townsend2012; Nery et al. Reference Nery, Monkul and Lafer2013; Phillips & Swartz, Reference Phillips and Swartz2014). The present cross-sectional analysis compared grey and white matter volumes and measures of cortical morphometry including volume, cortical thickness and surface area between BD patients, subjects at high genetic risk of developing BD (at risk; AR) and controls (CON). A strength of the current study is its focus on participants who are in the peak age of onset ‘window’ of 12–30 years, unlike many previous high-risk studies (Loranger & Levine, Reference Loranger and Levine1978; Goodwin & Jamison, Reference Goodwin and Jamison2007; Hajek et al. Reference Hajek, Cullis, Novak, Kopecek, Blagdon, Propper, Stopkova, Duffy, Hoschl and Uher2013). Further, our sample of 72 AR individuals is one of the largest to date to report on morphometric findings. The inclusion of a BD comparison group allowed us to investigate: (i) if brain changes associated with familial risk are present in those with established BD; and (ii) if any apparent illness-related morphological changes in the BD group are absent in unaffected relatives. Finally, to our knowledge, the present study is the first to employ an automated parcellation approach to measure multiple complementary morphometric measures in a BD high-risk group. We would contend that assessing multiple distinct morphometric measures may potentially yield more precise information on underlying disease mechanisms.
Method
Participants
Subjects comprised three groups: (1) 72 participants genetically at risk for BD who had not yet developed this condition (AR) [children or siblings of a proband with a confirmed Diagnostic and Statistical Manual of Mental Disorders, fourth edition (DSM-IV) diagnosis of bipolar I or II disorder]; (2) 72 CON participants (subjects with no parent or sibling with bipolar I or II disorder, recurrent major depression, schizo-affective disorder, schizophrenia, recurrent substance abuse or any past psychiatric hospitalization; and no parent with a first-degree relative who had a past mood disorder hospitalization or history of psychosis); and (3) 38 BD participants, 19 of whom met DSM-IV criteria for bipolar I and 19 with bipolar II. Subjects in all three groups were aged between 12 and 30 years. As significant differences in brain structures between Asian and Caucasian populations have been demonstrated, Asian subjects were excluded from this analysis (Vadakkumpadan et al. Reference Vadakkumpadan, Tong and Sun2006; Tang et al. Reference Tang, Hojatkashani, Dinov, Sun, Fan, Lin, Qi, Hua, Liu and Toga2010). Further details of the three groups and their assessment are described in the online Supplementary materials and elsewhere (Perich et al. Reference Perich, Lau, Hadzi-Pavlovic, Roberts, Frankland, Wright, Green, Breakspear, Corry, Radlinska, McCormack, Joslyn, Levy, Lenroot, Nurnberger and Mitchell2015).
Materials
Proband consensus DSM-IV diagnoses were determined by two independent raters (P.B.M. and H.N. Chan) following best estimate methodology (Leckman et al. Reference Leckman, Sholomskas, Thompson, Belanger and Weissman1982), using information from the Diagnostic Interview for Genetic Studies (DIGS) version 4 (Nurnberger et al. Reference Nurnberger, Blehar, Kaufmann, York-Cooler, Simpson, Harkavy-Friedman, Severe, Malaspina and Reich1994), the Family Interview for Genetic Studies (FIGS; Maxwell, Reference Maxwell1992) and medical records (where available). Structured diagnostic interviews were also performed on all AR, CON and BD participants. For those aged between 12 and 21 years (AR, n = 35; CON, n = 32; BD, n = 9), an adapted version of the Schedule for Affective Disorders and Schizophrenia for School-Age Children – Present and Lifetime Version (K-SADS-BP) was developed specifically for use in the US–Australia collaborative study of young people at genetic risk for BD (Nurnberger et al. Reference Nurnberger, McInnis, Reich, Kastelic, Wilcox, Glowinski, Mitchell, Fisher, Erpe, Gershon, Berrettini, Laite, Schweitzer, Rhoadarmer, Coleman, Cai, Azzouz, Liu, Kamali, Brucksch and Monahan2011). The K-SADS-BP was administered to both the child and one parent. For participants aged between 22 and 30 years (AR, n = 37; CON, n = 40; BD, n = 29), the DIGS (version 4) was used to measure the current and lifetime presence of Axis I DSM-IV disorders. Consensus DSM-IV diagnoses of the AR, BD and CON subjects were determined by two independent raters (two of P.B.M, F.L., R.L. and H.N. Chan) with best estimate methodology (Leckman et al. Reference Leckman, Sholomskas, Thompson, Belanger and Weissman1982), using the K-SADS-BP or DIGS, the FIGS (Maxwell, Reference Maxwell1992) and medical records (where available).
To assess current depressive mood state, for those aged between 12 and 21 years, the Children's Depression Inventory (CDI) was used (Kovacs, Reference Kovacs1992), and for participants aged 22–30 years, the Montgomery–Åsberg Depression Rating Scale (MADRS; Montgomery & Åsberg, Reference Montgomery and Åsberg1979) was administered. Intelligent quotient (IQ) was assessed with the Wechsler Abbreviated Scale of Intelligence (Wechsler, Reference Wechsler1999). To assess current manic symptoms, the Young Mania Rating Scale (YMRS; Young et al. Reference Young, Biggs, Ziegler and Meyer1978) was used for participants aged 22–30 years.
Magnetic resonance image (MRI) acquisition
Images were acquired with a 3-T Philips Achieva scanner at Neuroscience Research Australia in Sydney. Each scan started with 1 min of standard scout images to adjust head positioning, followed by a reference scan to resolve sensitivity variations. A total of 180 T1-weighted anatomic three-dimensional turbo field-echo sagittal images (voxel size = 1 × 1 × 1 mm3 resolution; field of view = 256 × 256 × 180 mm3; repetition time/echo time = 5.5/2.5 ms; flip angle = 8°) were acquired to allow subsequent spatial normalization. The scanning time was 371 s.
MRI analysis
Structural MRI data were analysed using Freesurfer v4.5 (Fischl et al. Reference Fischl, van der Kouwe, Destrieux, Halgren, Segonne, Salat, Busa, Seidman, Goldstein, Kennedy, Caviness, Makris, Rosen and Dale2004). Briefly, the preprocessing stream consisted of motion correction, skull stripping, Talairach transformation, intensity normalization, tissue type segmentation of white matter and grey boundary throughout the brain, and cortical parcellation. From this, data summaries for each cortical region were computed, including regional grey matter volume, white matter volume surface area, and thickness (for more details, see http://surfer.nmr.mgh.harvard.edu/). Surface area was derived by taking the sum of the area of the vertices in each parcellation (Meda et al. Reference Meda, Pryweller and Thornton-Wells2012; Venkatasubramanian et al. Reference Venkatasubramanian, Zutshi, Jindal, Srikanth, Kovoor, Kumar and Janardhan Reddy2012), and cortical thickness was calculated by taking the distance between the grey–white matter border and the pial surface at each vertex (Fischl & Dale, Reference Fischl and Dale2000). Cortical and subcortical volumes constituted the sum of all voxels within the corresponding region of interest (ROI).
Raw images were viewed for errors such as motion or poor contrast. Automated output was manually examined for failures to fit cortical surfaces (e.g. inadequate skull stripping), major topological defects in surfaces, and failures in subcortical segmentation. All scans were visually inspected by trained raters who were blind to diagnosis at several points along the pipeline processing, errors were manually edited, and scans re-processed.
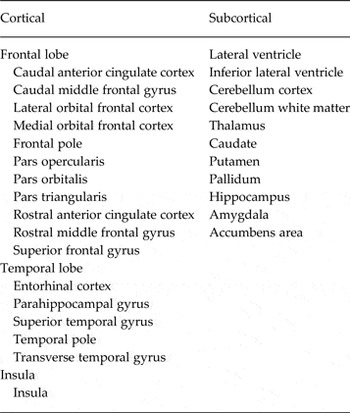
We extracted values based on the Desikan–Killiany Freesurfer atlas (Desikan et al. Reference Desikan, Ségonne, Fischl, Quinn, Dickerson, Blacker, Buckner, Dale, Maguire and Hyman2006). For each participant, per hemisphere, we extracted cortical grey matter volume, cortical white matter volume, surface area and thickness for 17 ROIs. We also extracted grey matter volumes bilaterally for an additional 11 subcortical ROIs. Table 1 lists cortical and subcortical ROIs.
Table 1. Cortical and subcortical regions of interest
Statistical analyses
All statistical analyses were carried out using SPSS v.22 (IBM). Sociodemographic differences between groups were assessed using univariate analysis of variance followed by least significant difference (LSD) pairwise comparisons. To compare neuroanatomic variables of interest across diagnostic groups, generalized estimating equations (GEE) models were used to accommodate within-family correlation arising from the inclusion of siblings from within the same family in either the AR or CON groups (not between groups). Each GEE model was run with neuroanatomic measure as the dependent variable, hemisphere (right and left) as a within-subject factor, diagnostic group as the between-subject factor, and age and gender as covariates. A hemisphere × group interaction term was also included in order to test whether group differences varied across hemispheres and/or hemisphere differences varied between groups.
A second set of GEE models was fitted, which included adjustment for overall differences in brain size: total intracranial volume (ICV) was included as a covariate in analyses of brain volumes, and total surface area as a covariate in analyses of regional surface areas. As the relationship between cortical thickness and ICV is controversial (Ashburner et al. Reference Ashburner, Csernansk, Davatzikos, Fox, Frisoni and Thompson2003), ICV was not included as a covariate in analyses of cortical thickness. All GEE models were run with an exchangeable covariance matrix using an identity link function.
Correction for multiple testing of the main effects of group, hemisphere and the group × hemisphere interaction was carried out using false-discovery rate (FDR) q values (Benjamini & Hochberg, Reference Benjamini and Hochberg2000). We ranked 51 comparisons separately for cortical grey matter volume, cortical white matter volume, surface area and thickness, and 33 comparisons for subcortical volume. We considered a corrected threshold of q < 0.05 statistically significant but we also report p < 0.05 uncorrected as potentially interesting for investigation in future, larger-scale studies. Pairwise comparisons were carried out using the LSD method: nine group × hemisphere a priori interaction comparisons (three between-group differences within the left and right hemispheres, respectively, in addition to three between-hemisphere differences within each study group), and three between-group comparisons. When a significant group × hemisphere interaction or group effect survived FDR correction, we carried out the statistically conservative step of a secondary FDR correction on post-hoc pairwise comparisons.
For ROIs that showed a main effect of group or a group ×hemisphere interaction after correction for multiple comparisons, additional tests were performed within the BD group: t tests were performed to investigate effects of current exposure to lithium, antidepressants or antipsychotics, or BD sub-type; and relationships between ROI structures and measures of illness severity and course (as assessed separately by: age of onset of first manic, hypomanic or depressive episode; number of episodes of hypomania, mania or depression; or age of onset of any first mood episode) were explored using correlational analyses. For ROIs that showed a main effect of group or a group × hemisphere interaction after correction for multiple comparisons, within each group relationships between ROI and current depressive mood [as assessed separately for younger (12–21 years) and older (22–30 years) groups] were explored using correlational analyses.
Results
Demographic and clinical data
Demographic and clinical data for each group are provided in Table 2. The groups did not differ significantly on IQ or gender distribution; the BD group was slightly older than both the AR and CON samples. As would be expected, 22- to 30-year-old subjects in the BD group had significantly higher MADRS and YMRS scores than both the AR and CON participants, with no significant differences found between the latter two groups. Among the 12- to 21-year-old subjects, the BD group also had significantly higher scores on the CDI when compared with both the AR and CON participants. The younger AR participants had significantly higher scores than the CON participants.
Table 2. Demographic and clinical data for CON, AR and BD groupsa
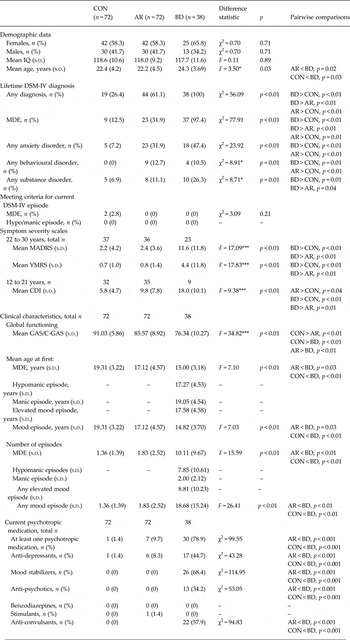
CON, Healthy controls; AR, at risk; BD, bipolar disorder; IQ, intelligence quotient; s.d., standard deviation; DSM-IV, Diagnostic and Statistical Manual of Mental Disorders, fourth edition; MDE, major depressive episode; MADRS, Montgomery–Åsberg Depression Rating Scale; YMRS, Young Mania Rating Scale; CDI, Children's Depression Inventory; GAS, Global Assessment Scale; C-GAS, Children's Global Assessment Scale.
a All participants had an IQ above 80. A lifetime MDE is defined as meeting DSM-IV criteria for at least one MDE. Confidence rating ranges using the best estimate methodology vary from 1 to 4, where 1 represents criteria not met for a diagnosis and 4 represents a definite diagnosis. All diagnoses listed here have a confidence rating of 3 or higher. Among the 13 participants with a behavioural disorder, 10 had attention-deficit/hyperactivity disorder (five current), three had oppositional defiant disorder (one current) and three had conduct disorder (none current). The average age of onset of any anxiety disorder in our sample was 13.0 (s.d. = 6.1) years in the AR group, 9.8 (s.d. = 7.1) years in the CON group and 12.5 (s.d. = 5.6)years in the BD group.
* p < 0.05, *** p < 0.001.
Current and lifetime consensus best-estimate DSM-IV diagnoses in all three groups are detailed in Table 2. At the time of testing, no participants met DSM-IV criteria for hypo/mania and two CON participants met DSM-IV criteria for a diagnosis of a current episode of major depression. It was revealed by χ2 comparisons that the lifetime occurrence of at least one major depressive episode (MDE) or any lifetime affective disorder was significantly higher in the AR group compared with the CON group (p < 0.01), consistent with prior reports of at-risk populations (Birmaher et al. Reference Birmaher, Axelson, Monk, Kalas, Goldstein, Hickey, Obreja, Ehmann, Iyengar, Shamseddeen, Kupfer and Brent2009; Nurnberger et al. Reference Nurnberger, McInnis, Reich, Kastelic, Wilcox, Glowinski, Mitchell, Fisher, Erpe, Gershon, Berrettini, Laite, Schweitzer, Rhoadarmer, Coleman, Cai, Azzouz, Liu, Kamali, Brucksch and Monahan2011). There were also significantly higher rates of anxiety (p < 0.05) and behavioural disorders amongst AR individuals (p < 0.01). All participants were of Caucasian decent. Of the 72 AR participants, 72.2% had a parent with BD and 27.8% had a sibling with BD. The 182 participants belonged to 157 families.
Group effects (not lateralized)
Table 3 details uncorrected significant bilateral group effects. No bilateral group differences remained significant after correcting for multiple tests and adjusting for age, gender and ICV/surface area.
Table 3. Group effects

CON, Healthy controls; AR, at risk; BD, bipolar disorder; ICV, intracranial volume; SA, surface area; s.d., standard deviation; FDR, false discovery rate; n.s., not significant.
a SA only applicable to parahippocampal gyrus whereas ICV applicable to all other regions.
b Effects that survive FDR correction at a threshold of p < 0.05. All other regions reported in the Table were significant (p < 0.05) prior to correcting for multiple tests.
Group × hemisphere interactions
Table 4 reports uncorrected significant group × hemisphere interactions. After controlling for multiple comparisons and adjusting for relevant covariates, group × hemisphere interactions remained significant for pars orbitalis thickness (covariates age and gender) and parahippocampal grey matter volume (covariates age, gender and ICV) (Fig. 1).

Fig. 1. Significant group x hemisphere interactions after correction for multiple testing. (A) Parahippocampal volume: effects survived false discovery rate (FDR) correction with age, gender and intracranial volume as covariates. (B) Pars orbitalis thickness: effects survived FDR correction with age and gender as covariates. Values are means, with standard errors represented by vertical bars. Significant difference: * p < 0.05, *** p < 0.001. a Effect did not survive a conservative secondary FDR correction that was applied to post-hoc pairwise comparisons of regions of interest. CON, Controls; AR, at risk; BD, bipolar disorder.
Table 4. Group × hemisphere interactions

ICV, Intracranial volume; CON, healthy control; s.d., standard deviation; AR, at risk; BD, bipolar disorder; FDR, false discovery rate; l, left; r, right; n.s., not significant; n.a., not applicable.
a Effects that survive FDR correction at a threshold of p < 0.05. All other regions reported in the Table were significant (p < 0.05) prior to correcting for multiple tests.
b Effect did not survive a secondary FDR correction that was applied to pairwise comparisons of regions of interest that showed a significant main effect that survived FDR correction.
Post-hoc pairwise comparisons revealed that AR subjects had significant left lateralized cortical thinning of the pars orbitalis compared with CON subjects. This difference did not survive a statistically conservative secondary FDR correction of pairwise comparisons. Further, compared with the CON group, post-hoc pairwise comparisons showed that, within the AR group, the pars orbitalis was thinner in the left hemisphere compared with the right, with this difference surviving secondary FDR correction. We found no differences in left pars orbitalis thickness when we compared AR participants with versus without lifetime DSM-IV diagnosis of MDE [n = 23 AR with MDE, 49 AR without MDE; Wald χ2 = 0.64, degrees of freedom (df) = 1, p = 0.42]. Additionally, to exclude any effect of current depressive episodes in the CON sample, we removed the two CON participants who met DSM-IV criteria for a current episode of major depression; the differences remained significant (n = 70 CON, n = 72 AR, n = 38 BD; Wald χ2 = 10.09, df = 2, group × hemisphere interaction p = 0.01; left AR < right AR p < 0.01; left AR < left CON p = 0.03).
Left hemisphere parahippocampal volume was greater for AR compared with BD participants, with this difference surviving secondary FDR correction. Left hemisphere parahippocampal volumes in the CON group were intermediate between AR and BD but not significantly different from either. Across all three groups, parahippocampal volume was greater in the left compared with the right hemisphere, with this difference surviving secondary FDR correction.
Within the BD group, measures of illness severity and course did not correlate with either left parahippocampal volume or left pars orbitalis thickness (all p's > 0.05). Within the BD group there were no left parahippocampal volume or left pars orbitalis thickness differences between participants currently taking either lithium, antidepressants or antipsychotics compared with those who were not, nor were there differences between bipolar I and bipolar II patients (p > 0.05). Within each group, no correlations were found between left pars orbitalis thickness or left parahippocampal volume and current depressive symptom severity (all p's > 0.05). Mean values of grey matter cortical and subcortical volume, cortical thickness, surface area and white matter volume are presented by group in online Supplementary Table S1. As differences in values between left and right hemispheres were not a focus of the current study, they are available from the authors upon request. Regions in which there was some indication of group effects, but where results were no longer significant after correction for multiple testing, are described in the online Supplementary materials.
Discussion
In this study, we report reduced cortical thickness in the left pars orbitalis of the IFG of AR subjects compared with CON subjects and increased left parahippocampal volume in AR participants compared with those with established BD. It should be acknowledged, though, that the difference in left pars orbitalis thickness did not survive the statistically conservative step of a secondary FDR correction. Our finding of differences in the pars orbitalis adds to a converging body of evidence, from both structural and functional studies, which suggests that the IFG plays an important role in the aetiology of BD (Chen et al. Reference Chen, Suckling, Lennox, Ooi and Bullmore2011; Hajek et al. Reference Hajek, Cullis, Novak, Kopecek, Blagdon, Propper, Stopkova, Duffy, Hoschl and Uher2013; Roberts et al. Reference Roberts, Green, Breakspear, McCormack, Frankland, Wright, Levy, Lenroot, Chan and Mitchell2013; Brotman et al. Reference Brotman, Deveney, Thomas, Hinton, Yi, Pine and Leibenluft2014; Breakspear et al. Reference Breakspear, Roberts, Green, Nguyen, Frankland, Levy, Lenroot and Mitchell2015). As neither of these IFG or parahippocampal findings were driven by mood, they may reflect underlying trait-related disturbances.
To our knowledge, the present study provides the first evidence of significant thinning of the pars orbitalis in subjects at high genetic risk of developing BD, a region that comprises the orbital part of the IFG and corresponds approximately to Brodmann area (BA) 47 (Badre & Wagner, Reference Badre and Wagner2007). In recent years there have been a number of reports of IFG differences in high-risk subjects, though there have been inconsistencies with regard to the direction and lateralization of such change. Differences in IFG thickness have been reported in a recent publication from a study of high-risk individuals and controls aged 15–30 years (Papmeyer et al. Reference Papmeyer, Giles, Sussmann, Kielty, Stewart, Lawrie, Whalley and McIntosh2015). In that study, while baseline scans revealed no group differences, longitudinally – across two time points – both control and high-risk individuals who remained well showed reductions in left IFG thickness, whereas those who later developed major depressive disorder showed left IFG thickening relative to high-risk well individuals (Papmeyer et al. Reference Papmeyer, Giles, Sussmann, Kielty, Stewart, Lawrie, Whalley and McIntosh2015). Another investigation found larger grey matter volumes in the right IFG of young (16–25 years) healthy offspring of BD patients, as well as in their affected relatives, compared with controls (Hajek et al. Reference Hajek, Cullis, Novak, Kopecek, Blagdon, Propper, Stopkova, Duffy, Hoschl and Uher2013).
In a machine-learning study of that same cohort, the bilateral IFG was one of the key regions which contributed to discriminating high-risk participants and BD participants from controls (Hajek et al. Reference Hajek, Cooke, Kopecek, Novak, Hoschl and Alda2015). In our study, although we did not find group differences in the right IFG, we did observe that within the AR group the left pars orbitalis was thicker than the right. In a further recent study of subjects aged 18–65 years, IFG (BA 47) volumes were larger bilaterally in 30 BD patients and 28 unaffected high-risk subjects compared with 30 controls (Sarıçiçek et al. Reference Sarıçiçek, Yalın, Hıdıroğlu, Çavuşoğlu, Taş, Ceylan, Zorlu, Ada, Tunca and Özerdem2015). In further support of anatomical convergence of the IFG, our group recently reported reduced IFG (BA 47) activation in high-genetic-risk individuals during response inhibition to fearful stimuli in an emotional Go-NoGo task (Roberts et al. Reference Roberts, Green, Breakspear, McCormack, Frankland, Wright, Levy, Lenroot, Chan and Mitchell2013; Breakspear et al. Reference Breakspear, Roberts, Green, Nguyen, Frankland, Levy, Lenroot and Mitchell2015), while Brotman et al. (Reference Brotman, Deveney, Thomas, Hinton, Yi, Pine and Leibenluft2014) reported similar reduced modulation in the IFG during face emotion processing in an at-risk group.
We did not find IFG differences in our sample of individuals with established BD, unlike several previous studies, including a 2011 meta-analysis (Houenou et al. Reference Houenou, Frommberger, Carde, Glasbrenner, Diener, Leboyer and Wessa2011). Previous studies have reported a negative association between IFG volume and illness severity measures (López-Larson et al. Reference López-Larson, DelBello, Zimmerman, Schwiers and Strakowski2002; Lyoo et al. Reference Lyoo, Kim, Stoll, Demopulos, Parow, Dager, Friedman, Dunner and Renshaw2004; Matsuo et al. Reference Matsuo, Kopecek, Nicoletti, Hatch, Watanabe, Nery, Zunta-Soares and Soares2012), with longitudinal structural MRI studies suggesting loss of grey matter volume in the prefrontal cortex over time among BD patients (Lim et al. Reference Lim, Baldessarini, Vieta, Yucel, Bora and Sim2013).
Our pars orbitalis finding is of particular interest given that the IFG, specifically BA 47, is known to play an integral role in a number of cognitive processes of potential relevance, such as emotional regulation (Singh & Chang, Reference Singh and Chang2013). The IFG appears to be lateralized in function, such that the right side mediates processing of non-verbal material, whereas the left side mainly governs language production and verbal comprehension (Greenlee et al. Reference Greenlee, Oya, Kawasaki, Volkov, Kaufman, Kovach, Howard and Brugge2004). It is not known which among these functions of the IFG are most relevant to the aetiology of BD.
This study is the first to find differences in the left parahippocampus in high-risk subjects compared with those with established BD. The parahippocampus is of particular interest for the aetiology of BD given its potential role in emotion regulation and the importance of the hippocampus in declarative memory (Phillips et al. Reference Phillips, Ladouceur and Drevets2008; Otten & Meeter, Reference Otten and Meeter2015). Previous studies have reported left parahippocampal volume increases in unaffected relatives of BD patients compared with controls (Ladouceur et al. Reference Ladouceur, Almeida, Birmaher, Axelson, Nau, Kalas, Monk, Kupfer and Phillips2008; Sarıçiçek et al. Reference Sarıçiçek, Yalın, Hıdıroğlu, Çavuşoğlu, Taş, Ceylan, Zorlu, Ada, Tunca and Özerdem2015), and reduced cortical thickness in the right parahippocampus in high-risk subjects compared with controls (Papmeyer et al. Reference Papmeyer, Giles, Sussmann, Kielty, Stewart, Lawrie, Whalley and McIntosh2015). A further study of twins concordant and discordant for BD revealed an association between higher genetic liability scores for BD and thinner parahippocampi bilaterally (Hulshoff Pol et al. Reference Hulshoff Pol, van Baal, Schnack, Brans, van der Schot, Brouwer, van Haren, Lepage, Collins, Evans, Boomsma, Nolen and Kahn2012). Differences between our findings and these previous studies may be related to the differences in the age of participants: one of these latter studies recruited participants under 18 years (Ladouceur et al. Reference Ladouceur, Almeida, Birmaher, Axelson, Nau, Kalas, Monk, Kupfer and Phillips2008), whilst two included participants who would have passed the peak risk age of onset (>30 years) (Hulshoff Pol et al. Reference Hulshoff Pol, van Baal, Schnack, Brans, van der Schot, Brouwer, van Haren, Lepage, Collins, Evans, Boomsma, Nolen and Kahn2012; Sarıçiçek et al. Reference Sarıçiçek, Yalın, Hıdıroğlu, Çavuşoğlu, Taş, Ceylan, Zorlu, Ada, Tunca and Özerdem2015). Finally, two of the aforementioned studies did not include a BD comparison group (Ladouceur et al. Reference Ladouceur, Almeida, Birmaher, Axelson, Nau, Kalas, Monk, Kupfer and Phillips2008; Papmeyer et al. Reference Papmeyer, Giles, Sussmann, Kielty, Stewart, Lawrie, Whalley and McIntosh2015). We found no association in our BD subjects between left parahippocampal volume and indices of BD illness course and severity, or current psychotropic medications, suggesting that this white matter abnormality was not secondary to either illness course or severity, or medication exposure.
We did not find significant differences in hippocampal morphometry in either the AR or BD groups. Results of studies to date have been inconsistent with regard to effects of BD or genetic risk for BD on hippocampal morphometry, with several not finding significant differences in hippocampal morphometry in BD patients across a range of ages compared with controls (Brambilla et al. Reference Brambilla, Harenski, Nicoletti, Sassi, Mallinger, Frank, Kupfer, Keshavan and Soares2003; Chen et al. Reference Chen, Sassi, Axelson, Hatch, Sanches, Nicoletti, Brambilla, Keshavan, Ryan and Birmaher2004; Chang et al. Reference Chang, Karchemskiy, Barnea-Goraly, Garrett, Simeonova and Reiss2005; Dickstein et al. Reference Dickstein, Milham, Nugent, Drevets, Charney, Pine and Leibenluft2005; Frazier et al. Reference Frazier, Hodge, Breeze, Giuliano, Terry, Moore, Kennedy, Lopez-Larson, Caviness and Seidman2008; Geller et al. Reference Geller, Harms, Wang, Tillman, DelBello, Bolhofner and Csernansky2009). In high-risk subjects, others have reported no differences in hippocampal volume (Noga et al. Reference Noga, Vladar and Torrey2001; Karchemskiy et al. Reference Karchemskiy, Garrett, Howe, Adleman, Simeonova, Alegria, Reiss and Chang2011) and shape (Connor et al. Reference Connor, Ng, McDonald, Schulze, Morgan, Dazzan and Murray2004) between first-degree relatives of BD patients and controls.
The domains in our study that survived correction for multiple testing were specific to cortical thickness and volume. Both cortical thickness and surface area contribute to volume. As research suggests that both cortical thickness and surface area are heritable, yet genetically independent – indicating that measures of cortical volume combine at least two distinct sources of genetic effects (Winkler et al. Reference Winkler, Kochunov, Blangero, Almasy, Zilles, Fox, Duggirala and Glahn2010) – the specificity of our findings highlights the importance of individual consideration of aspects of brain morphometry with different developmental origins. Further, as our IFG finding was specific to a sub-region, the current study suggests that selection of smaller parcellations may better elucidate subtle group differences.
The inclusion of a matched BD group allowed us to disentangle potential familial risk from illness-related changes. As our results are not suggestive of a clear trajectory, they highlight the complexity of the illness. We cannot assume a stepwise progression as the findings reported here arise from a cross-sectional report of a high-risk group that has not passed the peak age of onset for developing BD. Our subjects are likely to be heterogeneous in terms of future long-term outcome, comprising both those who will later convert to BD, as well as those who are resilient. As typical cortical development is non-linear, interpretation of the results of cross-sectional studies with regard to developmental outcomes remains a challenge. The structural abnormalities reported in high-risk individuals both here and in other cross-sectional studies could be related either to vulnerability or to resilience, for example preservation of adaptive emotional regulation which may help prevent the onset of BD. The finding of increased thinning in the pars orbitalis potentially reflects early neurodegenerative processes. As this abnormality is not evident in those early in the course of BD illness, it could be hypothesized that neural mechanisms may initially compensate for the effects of illness onset. In view of previous findings suggesting a loss of IFG volumes over time, the current lack of structural differences in the IFG in our BD group may be related to the relatively young age (⩽30 years) and short duration of illness of our sample compared with participants in most published studies. We found no effects of current psychotropic medications in our BD subjects on left pars orbitalis thickness, suggesting that medication exposure was not masking effects in the BD group. Although the relationship between differences associated with genetic liability and differences in those with established BD is beyond the scope of this study, IFG differences found in our three group comparisons helps to further disentangle trajectories in the brain region most consistently reported in the BD literature to date. The increased left parahippocampal volume is consistent with other reports of increased volumes in some brain regions in those at high -risk (Gogtay et al. Reference Gogtay, Ordonez, Herman, Hayashi, Greenstein, Vaituzis, Lenane, Clasen, Sharp, Giedd, Jung, Nugent III, Toga, Leibenluft, Thompson and Rapoport2007). In that group, cortical grey matter decreased bilaterally in the anterior (and subgenual) cingulate cortex after BD illness onset. As all the present participants are in an ongoing longitudinal study; follow-up data will hopefully elucidate the underlying mechanism that contributes to trajectories that result in BD.
In conclusion, we have identified two regions of particular neurodevelopmental interest in a large sample of subjects with increased genetic liability for BD. Those regions comprise the left parahippocampus and the pars orbitalis of the left IFG, both of which subserve emotional regulation and have been implicated in prior imaging studies. Extending prior findings, our results were specific to volume and thickness. Assessing multiple complementary morphometric measures – as undertaken in the present high-risk study – may assist in developing a better understanding of abnormal developmental processes in BD.
Supplementary material
For supplementary material accompanying this paper visit http://dx.doi.org/10.1017/S0033291716000507
Acknowledgements
This study was funded by the Australian National Medical and Health Research Council (programme grant 1037196) and the Lansdowne Foundation. Brain images were created by Bronwyn Overs.
Declaration of Interest
None.


