


Coldrum is one of the Medway group of megalithic monuments (Alexander Reference Alexander1959; Reference Alexander1962; Ashbee Reference Ashbee1993; Reference Ashbee2000; Reference Ashbee2005; Barber Reference Barber2004; Bennett Reference Bennett1913; Bewley et al. Reference Bewley, Crutchley and Grady2004; Clarke Reference Clarke1982; Daniel Reference Daniel1950; Evans Reference Evans1950; Holgate Reference Holgate1981; Jessup Reference Jessup1970): nine constructions apparently grouped around the river Medway, Kent, as it cuts through the North Downs (Fig. 1). The monuments lie in two clusters along the southern scarp of the North Downs, east and west of the Medway, with both good access to the river and one of the lowest fords over the river, a natural crossing at Aylesford (Jessup Reference Jessup1970, 95). Together with Addington long barrow (Jessup Reference Jessup1970) and Chestnuts (Alexander Reference Alexander1962), Coldrum forms the eastern group, while the more poorly preserved western group, some 8–10 km distant, includes Kit's Coty (Fig. 1). Other early Neolithic sites in close proximity include the post-and-slot structures at White Horse Stone and Pilgrim's Way (Glass Reference Glass2000; Hayden & Stafford Reference Hayden and Stafford2006; Garwood Reference Garwood2011; Booth et al. Reference Booth, Champion, Garwood, Glass, Munby and Reynolds2011; cf. Ashbee Reference Ashbee2005).

Fig. 1 The location of Coldrum and other Medway Neolithic monuments
The Medway monuments appear geographically isolated from larger groups of early Neolithic monuments such as those in Yorkshire and Lincolnshire, and the Cotswold-Severn region. The group does share some defining architectural motifs, which have no very close parallels elsewhere in Britain and which suggest regional cohesion: massive rectangular chambers in the eastern end of mounds, chambers compartmentalised with medial stones, and rectangular mounds with peristaliths (Holgate Reference Holgate1981; Kinnes Reference Kinnes1992; Reference Kinnes2004; cf. Ashbee Reference Ashbee1993; Reference Ashbee2005, 112; Jessup Reference Jessup1970, 111). However, as with other regional groupings, such as the Costwold-Severn tombs, there are also idiosyncracies and diversity: the rectilinear shape at Coldrum, the façade at Chestnuts, and the long thin mounds at Addington and Kit's Coty House. As the only dated site – and the only site likely to be dated (see below) – Coldrum plays an important role in understanding the development of regional Neolithic burial practices, though without further scientific dating the relationships of these sites within such traditions will remain a matter for speculation.
Origins or influences have been suggested from sources including Scandinavia (Daniel Reference Daniel1950), Germany (Evans Reference Evans1950), and the Low Countries (Piggott Reference Piggott1935), though it is to be noted that those discussions belonged to an era with different chronologies to those available today. Jessup (Reference Jessup1970) and Holgate (Reference Holgate1981, 230–1) emphasised the strategic position of Kent as ‘a leading reception centre for continental imports, immigrants and visitors throughout the Neolithic’. No obvious single precedents can be identified. The geographically closest continental monuments, for example at Wéris in eastern Belgium, while bearing some general similarity in terms of box-like chambers, belong to late Neolithic traditions of the late 4th and into the 3rd millennia cal bc (Toussaint Reference Toussaint2003; Toussaint et al. Reference Toussaint, Frébutte and Hubert2009). Western Belgium appears largely devoid of megalithic monuments (Toussaint Reference Toussaint2003). Further potential continental connections include the proximity of eastern Kent pit sites to middle Neolithic sites on the adjacent continent (such as in the Pas-de-Calais; cf. Sheridan Reference Sheridan2010).
Antiquarian and archaeological research at Coldrum was detailed by the late Paul Ashbee (Reference Ashbee1998, 42–3). There was no capstone in the 1840s when the first known drawings of the monument were made. A reconstruction by Evans (Reference Evans1950, 73) emphasised the ‘square’ morphology, devoid of fore-court ‘horns’ common in many Cotswold-Severn or Yorkshire and Lincolnshire long barrows. The site now consists of a low rectangular mound, c. 15 by 15 m, orientated east–west, with a partly ruined revetment of sarsens. A rectangular (c. 4 by 1.5 m) chamber of four massive sarsens is located at the east end. The monument sits on the edge of a terrace, with collapsed sarsens located at its foot (Evans Reference Evans1950, 74; Jessup Reference Jessup1970, 108). The chamber was divided into east and west compartments by orthostats, possibly forming a port-hole entrance; these had collapsed or been removed by the 1890s (Bennett Reference Bennett1913).
History of Antiquarian Research, Excavation, and the Archive
The earliest existing plans are found in the mid-19th century Beale Post manuscript, which also records that two ‘sculls’ were recovered from the site in 1804 and 1825 (Evans Reference Evans1949, 132, 137; Ashbee Reference Ashbee1998, 2). Human remains were removed at intervals until 1893 (Bennett Reference Bennett1913; Evans Reference Evans1950).
In 1910, the geologist and antiquary F.J. Bennett surveyed the monument, and excavated the apparently undisturbed western part of the chamber, simply digging down to recover human skeletal remains from two levels or ‘platforms’ (Bennett Reference Bennett1913; Ashbee Reference Ashbee1998, 20–2; Figs 2–3). Plans and sections from this excavation were drawn by E.W. Filkins. A single potsherd, recovered from the surface, and identified as plain Neolithic A ware by Piggottt (Reference Piggott1931, 93), was later reliably reclassified as Anglo-Saxon, and is now missing (Giles Guthrie, pers. comm.).

Fig. 2 The plan of the Coldrum monument, with a detail of the chamber at the level of ‘platform 1’ (adapted from Bennett Reference Bennett1913)

Fig. 3 The platforms identified by Bennett (adapted from Bennett Reference Bennett1913); it is now only possible to associate four skulls with these levels
Bennett (Reference Bennett1913, 81) recovered two skulls, teeth and bone, rude pottery, and a flint saw on ‘platform 1’, a level identified in the north-west corner of the chamber and close to the south wall, the few stone slabs suggesting to him some sort of paved floor.
Substantial undisturbed human remains were discovered in two groups c. 75 cm below this, on stone slabs which Bennett interpreted as a second ‘platform’ (Fig. 3). Six skulls and post-cranial parts lay against the terminal orthostat at the west of the chamber. A second discrete bone group consisting of two skulls and further post-cranial remains occupied the central area of the west compartment. Such distributions are similar to examples at Lanhill, West Kennet, Pipton, and Penywyrlod (Keiller & Piggott Reference Keiller and Piggott1938; Piggott Reference Piggott1962, Bayliss et al. Reference Bayliss, Whittle and Wysocki2007b; Savory Reference Savory1956; Reference Savory1984; Wysocki & Whittle Reference Wysocki and Whittle2000). Importantly for the site chronology, we can relate four skulls to the levels identified by Bennett (Reference Bennett1913); this is not the case with the post-cranial material.
Bennett (Reference Bennett1913) interpreted the platforms as in situ superimposed Neolithic stone pavements. While this is not inconceivable, such an arrangement is almost unprecedented in southern British Neolithic monuments, although something similar has been noted at Le Déhus, Guernsey, and Broadsands in Devon (Schulting et al. Reference Schulting, Sebire and Robb2010b; Sheridan et al. Reference Sheridan, Schulting, Quinnell and Taylor2008). There is a possibility that finds on the first ‘platform’ were redeposited upcast from previous disturbances in the eastern half of the chamber. Alternatively, the upper level finds could represent chamber infilling as at West Kennet, where human remains were incorporated with chalk rubble, pottery, and other artefacts (Piggott Reference Piggott1962; Bayliss et al. Reference Bayliss, Whittle and Wysocki2007b).
Filkins, earlier the draughtsman who produced the drawings for Bennett's report, continued excavating in the chamber in 1922, 1923, and 1926 after Bennett's death (Filkins Reference Filkins1928; Ashbee Reference Ashbee1998), and recovered further scattered, residual fragmentary human remains.
Most of the human material recovered by Bennett and Filkins was held together at the Royal College of Surgeons (RCS) until the Second World War. Subsequently the post-cranial remains were transferred to the Natural History Museum, London, and the skulls to the Duckworth Laboratory Collection, Cambridge. A small assemblage of human and animal bone recovered from Coldrum by Bennett was presented to Trottiscliffe Parish Church and is now stored at the Maidstone Museum and Bentlif Art Gallery, Maidstone.
Aims of this Study
Coldrum is the only Medway monument to have yielded substantial human remains (Mays Reference Mays2004). The Chestnuts produced two human teeth and cremated bone (Alexander Reference Alexander1962). The other Medway monuments were built on acid soils, or were extensively robbed (Jessup Reference Jessup1970; Holgate Reference Holgate1981). This study presents osteological analysis, Bayesian modelling of radiocarbon dates, and carbon and nitrogen stable isotope analysis to inform on the demography, burial practices, diet and subsistence, and chronology of the Coldrum population.
Osteological Analysis
The skeletal remains were analysed using methods, techniques, and data presented in Buikstra & Ubelaker (Reference Buikstra and Ubelaker1994); Steele & Bramblett (Reference Steele and Bramblett1988); Scheuer & Black (Reference Scheuer and Black2000), Bass (Reference Bass1992), White (Reference White2000), and Hillson (Reference Hillson1996).
Human remains from the Bennett excavations
Keith (Reference Keith1913) suggested that the Bennett assemblage represented 22 individuals, but this is probably an over-estimate (cf. Wysocki & Whittle Reference Wysocki and Whittle2000). We estimate – on the basis of anatomical duplication in adult left femora and developmental age-related differences in immature left and right femora – that the minimum number of individuals (MNI) is 17 (White Reference White2000, 291–2). We have identified nine adults (probably five males and four females), two older sub-adults (probably 16–20 years old), four older children, and two younger children (one around 5 years of age, the other of 24–30 months). Four adults were aged c. 20–40+ years, and one older female may have been over 50 years.
Human remains from the Filkins excavations
The human remains recovered by Filkins (Reference Filkins1928) cannot be robustly associated with burial contexts; some were recovered from the western part of the chamber, others from the eastern part. The Filkins cranial assemblage includes fragments of vault and occipital bone, ten petrous temporal portions (six from the right side, four from the left), and parts of six maxillae with dentition. The majority of the remains are hand and foot bones. Duplications of right metatarsal I indicate a minimum of 11 adults. Two immature metatarsals (IV and V) are probably from a sub-adult of 12–16 years and two immature foot phalanges may be from a child. Sex assessments of the calcanei and tali (Steele & Bramblett Reference Steele and Bramblett1988) indicate the presence of six possible males and two females. It is uncertain if any of these fragments represent additional individuals to the 17 already identified, as many of those cranial remains are incomplete in the regions represented in the Bennett assemblage.
Human taphonomy
Keith (Reference Keith1913) argued that many of the Coldrum bones were deliberately broken around the time of deposition (cf. Keith Reference Keith1916; Daniel Reference Daniel1950). As currently understood, the assemblage does not support such a view. Fracture morphologies of the limb shafts (almost invariably transverse and right-angled) are consistent with dry-bone breakage attributes (Villa & Mahieu Reference Villa and Mahieu1991; Whittle & Wysocki Reference Whittle and Wysocki1998). There is one exception: a left ulna shaft (in the Maidstone archive) which displays a typical green-bone/peri-mortem fracture.
There is no evidence of sub-aerial type weathering modifications (Lyman Reference Lyman1994) that could indicate long-term post-mortem exposure, but many elements are lightly or moderately root-etched. Several limb shafts display rodent gnawing marks with unpatinated exposed cortical bone which are likely to be of relatively recent origin. Bennett (Reference Bennett1913) records the presence of animal runs and burrows within the precincts of the burial chamber and numerous bones of burrowing animals were recovered during his excavation.
Pathology and cut-marked specimens
The Coldrum assemblage includes very notable anthropogenic modifications. Three skulls with evidence of cranial trauma indicative of interpersonal violence have been reported elsewhere (Schulting & Wysocki Reference Schulting and Wysocki2005, 113–14); a probable female adult (Eu.1.5.120) had an unhealed injury to the left frontal and cut-marks on the left temporal bone, an unhealed fracture of the left frontal was present on an adult of indeterminate sex (No. 8), and a second probable female adult (Eu.1.5.125) exhibited a healed depressed fracture of the right frontal.
A total of 522 post-cranial elements were analysed for stone tool cut-marks following the methods of Shipman and Rose (Reference Shipman and Rose1983), Eickhoff and Herrmann (Reference Eickhoff and Herrmann1985), Olsen and Shipman (Reference Olsen and Shipman1988), and Lyman (Reference Lyman1994, 297–9). Samples were inspected macroscopically and by hand lens (×10) under oblique light. Selected specimens were inspected using a light microscope and scanning electron microscope (SEM).
Cut-marks were identified on four post-cranial skeletal elements, on two proximal femur fragments – a left element (CMF1) and a right element (CMF2), both broken just inferior to the lesser trochanter (Fig. 4) – and on a left innominate (CMI1) (Fig. 5), and a right innominate (CMI2).

Fig. 4 Cut-marked right proximal femur fragment (CMF2) from Coldrum

Fig. 5 A detail of the cut-marked left innominate (CMI1) from Coldrum
CMF1 and CMF2 are identified as possibly male based on metric analysis. CMI1 was identified as male based on a sciatic notch-acetabular index of 81.98 (Kelly 1979). The cut-marked right innominate (CMI2) could not be sexed. The elements could represent four separate individuals, but could also represent the remains of a single adult male of moderate stature. They do not pair convincingly with other surviving adult hip-joint bones.
On CMI1 three short, transverse, notch-like incisions are evident at the remnant of the superior ramus of the pubis anterior to the iliopubic eminence.
On CMI2 two notch-like incisions are located at the anterior inferior iliac spine. There are numerous thin, linear, parallel and sub-parallel scratch marks located at the internal posterior iliac fossa, near the margin of the auricular surface, superior to the arcuate line (Fig. 6). These incisions are very similar to those displayed on the anterior surface of the neck of CMF2.

Fig. 6 SEM image of fine linear incisions on innominate CMI2, displaying stone tool characteristics, V-shaped profile, and multiple fine striae. (Photograph: Y.F-J)
On CMF1 eight short, deep, tightly grouped, V-shaped and patinated transverse parallel incisions are located medially at the inferio-anterior border of the femoral neck marginal to the femoral head.
On CMF2 six deep, tightly grouped, short, parallel incisions are located medially at the inferior surface of the neck. The incisions exhibit V-shaped profiles, patinated inner surfaces and run transversely (posterio-anterior orientation) to the long axis of the neck. Under hand lens and oblique light, faint striae are visible at the base of the incisions. The posterior surface of the femoral neck displays some 14 deep, parallel and sub-parallel fine linear incisions at the approximate medio-lateral mid-point of the neck. The incisions are transversal and oblique, orientated superio-inferiorly to the long axis of the neck. The specimen also exhibits a roughly circular area of black, charred bone (c. 15 by 13 mm) on the articular surface of the head, anterior to the foveal margin (Fig. 4). The charring is relatively superficial, affecting 2–3 mm of the underlying trabecular bone.
The thin, linear, scratch-like incisions on CMF2 and CMI2 are very fine and almost invisible under direct light. They are truncated in places by root etchings, pre-date excavation and are almost certainly ancient. Under the SEM micro-striations observed inside the incisions indicate that they were made with a stone implement.
The cut-marks at the medial inferior neck in both femora are deep, purposeful, tightly grouped and isolated, and exhibit bilateral repetition of anatomical placement. Their location suggests that the cutting tool was applied to the capsule attachment of the hip joint at the area of the zona orbicularis where the iliofemoral and pubofemoral ligaments overlap. The slight anterior bias of the cut-marks may indicate that the corpse (or articulated skeleton) was laid on its back. The grouping of fine cut-marks on the anterior neck of the right femur suggests rapid slicing or slashing at the iliofemoral ligament.
The cut-marks suggest dismemberment and dissection of ligaments following partial decomposition or removal of other soft tissues (cf. White Reference White2000, 422, fig. 19.2). If the corpse was still fleshed or partially fleshed, the cuts could have severed the pectineus and iliacus muscles (among others) in order to separate the upper thigh from the hip.
On CMI2, two notch-like cut-marks are located approximately at the attachment site of the iliofemoral ligament and the tendon of the rectus femoris muscle. Multiple, fine cut-marks on the internal surface of the iliac fossa are located at the ventral attachment sites of the iliolumbar and sacroiliac ligaments. On CMI1 the cut-marks relate most closely to the attachment areas of the pectineal and pubofemoral ligaments.
The cut-marks are discretely and precisely located; they do not suggest frenzied hacking or mutilation. Dismemberment at the hip joint of a fleshed or relatively fresh human corpse would result in additional modifications to underlying bone. The absence of incisions at any of the major muscle attachment sites, or at the acetabular rim, may suggest that these elements were already partially skeletonised when dismembered.
Cut-marked early Neolithic human remains
The Coldrum cut-marked human bone assemblage (two femora, two innominates, and one cranium) is the largest exhibiting peri-mortem dismemberment so far reported from a southern British Neolithic long barrow. Other Neolithic cut-marked human bones (cf. Smith & Brickley Reference Smith and Brickley2009, table 4, 49) comprise an adult clavicle each from West Tump (Smith & Brickley Reference Smith and Brickley2004) and Eyford (Rolleston Reference Rolleston1876), an adult rib fragment and an immature femur and humerus from Adlestrop (Smith & Brickley Reference Smith and Brickley2009, 49–51), an adult humerus from Haddenham (Lee & Wakely Reference Lee and Wakely2006), and 23 human bone fragments from Hambledon Hill (McKinley Reference McKinley2008). Many of the Hambledon Hill incisions appear to relate to the process of defleshing, whereas the cut-marks on bones from chambered tombs and barrows are much more indicative of dismemberment and decapitation (Smith & Brickley Reference Smith and Brickley2009, 49–51). The cut-marks on the Haddenham humerus were distributed at the attachment areas of the brachialis and the medial head of the triceps (Lee & Wakely Reference Lee and Wakely2006, 148), and were interpreted as indicative of the defleshing of these muscles from the bone.
The Coldrum, West Trump, Eyford, Aldestrop, and Haddenham incised bones can be located within the wider spectrum of corpse manipulation practices which occurred at Neolithic monuments (Smith & Brickley Reference Smith and Brickley2009, 51). Skulls may be separated from post-cranial remains and bones from several individuals may be found stacked or arranged in discrete groups (e.g. Wysocki et al. Reference Wysocki, Bayliss and Whittle2007; Savory Reference Savory1956; Keiller & Piggott Reference Keiller and Piggott1938). Such arrangements have been interpreted as evidence of secondary burial following exposure or excarnation. Alternatively such evidence may represent decomposition of fleshed in situ interments with subsequent rearrangement. Both processes may have taken place at different monuments, or at the same monument (Saville Reference Saville1990; Whittle & Wysocki Reference Whittle and Wysocki1998; Bayliss & Whittle Reference Bayliss and Whittle2007; Smith & Brickley Reference Smith and Brickley2009). In any case, stacking, rearrangement, separation, and possibly transportation imply the availability of disarticulated material. Soft tissue decomposition and subsequent disarticulation take place over variable timescales, largely dependent on ambient temperature, cooler conditions needing more time (Megyesi et al. Reference Megyesi, Nawrocki and Haskell2005), while articulation of the hip and thigh bone may persist long after other connective tissues and joints have decomposed and separated (Haglund Reference Haglund1997). In such contexts dismemberment may be required to hasten or finalise the process.
Necrophagy, shamanism, witchcraft, or other forms of natural magic could also be implied, and the borders between such activities, ancestor worship, treatment of the dead, and other practices may have been indistinct. Criteria diagnostic of cannibalism, such as percussion marks, impact notches and microflakes, green-bone fracture attributes, and pot-polishing were not observed at Coldrum (cf. Villa et al. Reference Villa, Bouville, Courtin, Helmer, Mahieu, Shipman, Belluomini and Branca1986; Villa & Mahieu Reference Villa and Mahieu1991; White Reference White1992; Turner & Turner Reference Turner and Turner1999; Boulestin et al. Reference Boulestin, Zeeb-Lanz, Jeunesse, Haack, Arbogast and Denaire2009).
The Age of the Human Remains: Radiocarbon Dating
Radiocarbon measurements were made at the Oxford Radiocarbon Accelerator Unit (ORAU). An initial set of results was withdrawn following identification of a technical problem with sample processing (Bronk Ramsey et al. Reference Bronk Ramsey, Higham, Bowles and Hedges2004a; Bayliss et al. Reference Bayliss, Bronk Ramsey, Plicht, van der and Whittle2007a). A second round produced 27 radiocarbon measurements, on re-ultrafiltered excess collagen from original samples (Bronk Ramsey et al. Reference Bronk Ramsey, Higham, Bowles and Hedges2004a), and on new samples from elements used for the MNI, the four skulls associated with the upper and lower platforms, and incised elements (Table 1). The new samples were processed using the revised gelatinisation and ultrafiltration technique (Bronk Ramsey et al. Reference Bronk Ramsey, Higham and Leach2004b; Brock et al. Reference Brock, Bronk Ramsey and Higham2007; Reference Brock, Higham, Ditchfield and Bronk Ramsey2010), graphitised (Dee & Bronk Ramsey Reference Dee and Bronk Ramsey2000), and measured by accelerator mass spectrometry (AMS) (Bronk Ramsey et al. Reference Bronk Ramsey, Higham and Leach2004b).
Table 1 Radiocarbon and Stable Carbon and Nitrogen Results From The Coldrum Human Remains

1Brock et al., Reference Brock, Higham, Ditchfield and Bronk Ramsey2010.
The posterior density estimates listed in the final column were calculated in our preferred model (model 2) shown in Figure 8. The ranges are cited at 95% unless otherwise stated. The ‘AF’ pretreatment code refers to ORAU collagen preparation developed in response to the ultrafilter contamination issue and which has now become standard (Brock et al. Reference Brock, Bronk Ramsey and Higham2007, Reference Brock, Higham, Ditchfield and Bronk Ramsey2010); the code ‘Re AF, NRC’ refers to non-routine chemistry associated with re-ultrafiltered collagen aliquots that had been affected by the ultrafilter contamination issue (Bronk Ramsey et al. Reference Bronk Ramsey, Higham, Bowles and Hedges2004a)
Stable isotope considerations for radiocarbon dating
The results from the stable isotope analysis do not indicate a clear marine or freshwater reservoir effect (Schoeninger et al. Reference Schoeninger, Deniro and Tauber1983; see below). However, there is an enrichment, which warrants brief discussion here (and further below). There is an obvious correlation between radiocarbon date and both δ13C and δ15N values. The δ15N values are unusually high for Britain, but the absence of faunal data from the site makes it impossible to identify the herbivore to human enrichment. The δ15N values raise the possibility of a freshwater reservoir effect, though enrichment could be attributed to alternative causes (see below). Freshwater offsets are highly system-specific (Keaveney & Reimer Reference Keaveney and Reimer2012), depending on: groundwater; inorganic and organic water body geochemistry; relative contributions of submergent and emergent photosynthetic producers; and relative contributions of aquatic and terrestrially produced protein to human diet.
The slopes of δ15N and δ13C against time (Figs 11–12, below) show a correlation in the opposite direction for either an increased fresh or marine fish consumption effect (most markedly in the δ15N patterning; Fig. 11). If either a directional trend over time in a marine or a freshwater reservoir were to be invoked, a trend in higher fish consumption (i.e. from a 14C depleted source) would lead to a higher collagen δ15N value over time. This trend over time does not preclude aquatic sources in the diet, though it does mean that the overall spread in 14C dates cannot entirely be explained in this way.

Fig. 11 Comparison of key posterior density estimates produced from the different interpretations of the most appropriate treatment of the available prior information (Figs 7, 8, and 10). We suggest that the posterior density estimate for the start of Neolithic activity from model 2 represents the most satisfactory treatment of the data. For each posterior density estimate the range at 68% probability is shown immediately under the distribution, while the lower range is at 95% probability
From the δ15N values it seems unlikely that there is a significant offset, but an effect (for example of <100 radiocarbon years, which would have a variable effect on the calibrated calendar years across the population as a whole) cannot be ruled out. Importantly those samples more likely to be affected are those with higher δ15N values, and the highest δ15N values are greatest in the latest radiocarbon results. The implications are that any freshwater fish offset effective on the earliest data is likely to be relatively small (see below). This said, there is potential that the resultant ‘real’ spread of dates would be greater (i.e. the duration of activity at the site), and that the estimate for the end of activity at the site could be later. We have presented the data as if there are no diet-derived offsets. Given the importance of the chronology of the site in Neolithic studies, this should be the subject of further research.
Calibration of the radiocarbon dates
The results reported are conventional radiocarbon ages (Stuiver & Polach Reference Stuiver and Polach1977). Date ranges in Table 1 have been calculated by the maximum intercept method (Stuiver & Reimer Reference Stuiver and Reimer1986). Distributions in figures have been calculated using the probability method of Stuiver and Reimer (Reference Stuiver and Reimer1993). Measurements have been calibrated using IntCal09 (Reimer et al. Reference Reimer, Baillie, Bard, Bayliss, Beck, Blackwell, Bronk Ramsey, Buck, Burr, Edwards, Friedrich, Grootes, Guilderson, Hajdas, Heaton, Hogg, Hughen, Kaiser, Kromer, McCormac, Manning, Reimer, Richards, Southon, Talamo, Turney, Plicht, van der and Weyhenmeyer2009) and OxCal v4.1 (Bronk Ramsey Reference Bronk Ramsey1995; Reference Bronk Ramsey1998; Reference Bronk Ramsey2001; Reference Bronk Ramsey2009).
Bayesian modelling
Bayesian chronological modelling combines calibrated radiocarbon dates with archaeological prior information (Buck et al. Reference Buck, Kenworthy, Litton and Smith1991; Reference Buck, Litton and Smith1992; Reference Buck, Cavanagh and Litton1996; Bronk Ramsey Reference Bronk Ramsey1995; Reference Bronk Ramsey1998; Reference Bronk Ramsey2001; Reference Bronk Ramsey2009). This process accounts for statistical scatter inherent in an assemblage of dates, and can produce more precise posterior density estimates from extant radiocarbon likelihoods. Bayesian modelling has been applied using OxCal v4.1, which uses a form of Markov Chain Monte Carlo (MCMC) sampling and implements the Metropolis-Hastings algorithm. Bronk Ramsey (Reference Bronk Ramsey2009) details the algorithm and program construction; the algorithms used in these models can be derived from the structure shown in the figures and the Command Query Language 2 (CQL2) keywords (ibid.). Posterior density estimates are quoted in italics. Ranges are quoted following recommendations by Stuiver and Polach (Reference Stuiver and Polach1977) and rounded outwards by 10 years.
Sample association
None of the results actually dates the construction of the monument. It is possible that there was some interval between the deaths of the individuals and the monument construction (Wysocki et al. Reference Wysocki, Bayliss and Whittle2007, 77), sufficient at least for the defleshing and corpse manipulation outlined above. However, given that the dated elements show no evidence for exposure, we suggest that the remains were deposited relatively soon after death, not as part of significantly later secondary burial.
Model construction
There is relatively limited ‘informative’ prior information with which to constrain the radiocarbon data (Bayliss et al. Reference Bayliss, Bronk Ramsey, Plicht, van der and Whittle2007a); four skulls can be identified as originating from Bennett's upper and lower levels. We present three scenarios that reflect different readings of the available evidence. Model 1 uses the known relationships between the four skulls, and analyses the other data using the interpretation that they are a random sample from a uniformly distributed phase of activity (Buck et al. Reference Buck, Litton and Smith1992). We will argue that this model probably importantly under-constrains the associated statistical scatter (ibid.). Model 3 postulates four phases of activity, derived from the statistical consistency of the radiocarbon dates, and archaeological indications that activity at the site was episodic. Model 3 probably over-interprets the available evidence (cf. Steier & Rom Reference Steier and Rom2000).
Our preferred interpretation is model 2, which is probably not significantly misleading (cf. Box Reference Box1979; Bayliss et al. Reference Bayliss, Bronk Ramsey, Plicht, van der and Whittle2007a). This model uses the available stratigraphic information and the statistical coherence of early measurements. Model 2 is supported by the trend in stable isotope evidence (see below), but the attribution of radiocarbon results to phases is necessarily interpretive because of the uncertainty regarding the recovery contexts of most samples. Model 2 has been introduced in Bayliss et al. (Reference Bayliss, Allen, Healy, Whittle, Germany, Griffiths, Hamilton, Higham, Meadows, Shand, Stevens and Wysocki2011a); this paper fully details the chronological analysis of the site and relates the data to the isotope measurements (see below). It is important to emphasise that assigning dates to phases based on the dates themselves has the potential to reify or over-interpret data; we do not do this here – we base our preferred interpretation on the available prior information (the stratigraphy, records of the site excavation, and the stable isotope data) and we demonstrate (through sensitivity analysis) that our preferred model is probably not significantly misleading.
Model 1
Measurements OxA-16039 and OxA-16040 were produced on two crania from the lower ‘platform’, with OxA-16038 and OxA-16041 produced on two crania from the upper ‘platform’.
The lower level skull results are statistically consistent (OxA-16040; -16039; T’ = 0.2; T'5%=3.8; ν = 1; Ward & Wilson Reference Ward and Wilson1978); these individuals could have died at the same point in time. The upper level crania results are not statistically consistent (T’ = 10.5; T'5% = 3.8; ν = 1; ibid.). The lower level results are earlier than those from the upper level (Table 1), and could support Bennett's interpretation that the lower ‘platform’ was an earlier in situ Neolithic deposit that underlay the younger upper ‘platform’ (though see above).
Model 1 has good agreement (Aoverall = 78%), and estimates that activity began in 4060–3870 cal bc (95% probable) or 3990–3910 cal bc (68% probable; start Bennett model 1; Fig. 7), with the end of activity in 3310–2970 cal bc (95% probable) or 3290–3140 cal bc (68% probable; end Bennett model 1; Fig. 7). In our view the analyses outlined in models 2 and 3, with the evidence that other skeletal remains were recovered from the lower ‘platform’ (Bennett Reference Bennett1913), suggest that activity in the tomb may not have been continuous and so model 1 is not the most appropriate.
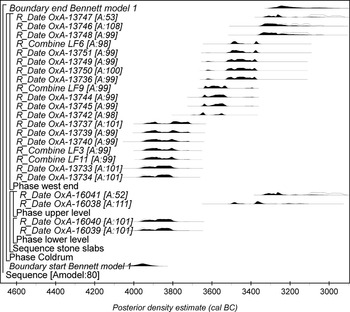
Fig. 7 Model 1. The brackets and OxCal v4.1 CQL2 keywords define the model structure (Bronk Ramsey Reference Bronk Ramsey2009). We argue that the model probably under-constrains the radiocarbon dates from Coldrum (see main text and Fig. 8)
Model 2
Model 2 divides the data into two phases. The model employs Bennett's (1913) observed stratigraphic relationships, and attributes other measurements to these phases based on their radiocarbon ages.
Model 2 has good agreement (Aoverall = 75%). The data included in phase 1 (Fig. 8) have been selected because they are statistically consistent (OxA-16039; -16040; -13733; -13734; -13718; -13735; 13737; -13739; -13740; -13721; -13743; T’ = 11.3; T'5% = 18.3; ν = 10; Ward & Wilson Reference Ward and Wilson1978). These measurements could represent a single archaeological ‘event’, with for example all the individuals dying on the same day in the second half of the 40th or 39th century cal bc (the weighted mean is 5052 ± 11 bp). Perhaps a more convincing scenario is that the remains represent a population who died over a short duration of time. We suggest that this ‘phase’ could represent a discrete and early period of deposition, more or less contemporary with the construction of the monument. An alternative view – given that we cannot estimate the date of monument construction – is that these results represent remains that were significantly old at their time of deposition; we think that this is implausible.

From model 2, Neolithic activity at Coldrum began in 3980–3800 cal bc (95% probable) or 3960–3880 cal bc (68% probable; start Coldrum 1 model 2; Fig. 8). This phase ended in 3930–3750 cal bc (95% probable) or 3910–3775 cal bc (68% probable; end Coldrum 1 model 2; Fig. 8), and lasted for 0–140 years (95% probable) or 0–80 years (68% probable; DurationPhase1; Fig. 9).

After an interval of 60–350 years (95% probable) or 140–290 years (68% probable; Coldrum 1/2; Fig. 9), further individuals died and their remains were placed in the chamber. The postulated subsequent phase began in 3730–3540 cal bc (95% probable) or 3670–3560 cal bc (68% probable; start Coldrum 2 model 2; Fig. 8), and ended in 3310–2980 cal bc (95% probable) or 3300–3170 cal bc (68% probable; end Coldrum 2 model 2; Fig. 8). The renewed use of the chamber lasted for 240–590 years (95% probable) or 270–410 years (68% probable; DurationPhase2; Fig. 9). Given the long duration of ‘phase 2’ as presented here, it seems possible that this activity might mask more taphonomically complex processes, and might lump together several discrete ‘phases’. We investigate this possibility further in model 3.
Model 3
Model 3 presents the dates in four phases; the first is the same as in model 2, while the others explore the later use of the monument. This model reflects the observations of Bennett (Reference Bennett1913) that discrete bone deposits may indicate episodic activity.
In addition to the statistically consistent radiocarbon dates from phase 1, results from a second suggested phase are statistically consistent (OxA-13742; -13745; -13744; -13741; -13720; T = 6.5; T'5% = 9.5; ν = 4; Ward & Wilson Reference Ward and Wilson1978), as are those from a third phase (OxA-13736; -13750; -13749; -13751; -13719; -13738; T = 3.4; T'5% = 11.1; ν = 5; ibid.). The remaining latest data contain measurements that are not statistically consistent (OxA-16038; -13748; -16041; -13746; -13747; T = 15.4; T'5% = 9.5; ν = 4; ibid.). It is possible that ‘missing’ material excavated from the chamber represented activity within the hiatuses that are postulated here. We feel a scenario that includes discrete phases of activity is preferable, but cannot entirely exclude the possibility that continual deposition of the dead occurred at the site.
Model 3 has good overall agreement (Aoverall = 82%). The first phase began in 3980–3800 cal bc (95% probable) or 3960–3870 cal bc (63% probable; start phase 1 model 3; Fig. 10), and ended in 3930–3750 cal bc (95% probable) or 3900–3770 cal bc (68% probable; end phase 1 model 3; Fig. 10). Phase 2 began in 3720–3530 cal bc (95% probable) or 3660–3630 cal bc (14% probable) or 3610–3540 cal bc (54% probable; start phase 2 model 3; Fig. 10), and ended in 3590–3480 cal bc (92% probable) or 3570–3510 cal bc (68% probable; end phase 2 model 3; Fig. 10). Phase 3 began in 3540–3430 cal bc (94% probable) or 3520–3460 cal bc (68% probable; start phase 3 model 3; Fig. 10), and ended in 3500–3340 cal bc (95% probable) or 3480–3400 cal bc (68% probable; end phase 3 model 3; Fig. 10). Phase 4 began in 3430–3140 cal bc (95% probable) or 3390–3250 cal bc (68% probable; start phase 4 model 3; Fig. 10), and ended in 3330–2920 cal bc (95% probable) or 3320–3180 cal bc (44% probable) or 3090–3000 cal bc (24% probable; end phase 4 model 3; Fig. 10).

Fig. 10 Model 3, an alternative model of the radiocarbon dates from Coldrum. The format is the same as in Figure 7. The model presents results as if they reflected more episodic activity at the site. While this interpretation could be supported by both the radiocarbon dates and archaeological information from the site, we do not think that the archive is sufficiently robust to warrant this additional treatment
Comparison of the chronological models for Coldrum
All Bayesian models are inherently limited representations of reality (Buck et al. Reference Buck, Cavanagh and Litton1996). Model 1 is the most conservative and the radiocarbon dates are least constrained by it. Both model 2 and 3 are more satisfactory than model 1 in archaeological terms (Bennett recovered an assemblage from the lower level), and mathematical terms (because the data are probably insufficiently constrained in model 1). We prefer model 2 because, while episodic activity at the site seems entirely feasible, the level of detail available from the site archive is not sufficient for more complex modelling.
Why does this discussion of different interpretations matter? The model 1 posterior density start estimate is least precise, and the range extends into the early 41st century cal bc. This impression is important in an early Neolithic where we can now attempt to address change on a generational level (Whittle et al. Reference Whittle, Healy and Bayliss2011b). The effect is obvious when model 1 posteriors are compared with estimates from models 2 and 3 (Table 2; Fig. 11). The differences between outputs emphasise the importance of examining date ranges and probability distribution for an estimate. In any case, the key posterior density estimates from models 2 and 3 are very similar (Table 2); if different interpretations of the most appropriate treatment of prior information produce similar outputs, we may be fairly confident that any particular model is not significantly biasing our results and that our preferred solution is robust (Steier and Rom Reference Steier and Rom2000).
Table 2 The Start And End Posterior Density Estimates For The Coldrum Monument From The Different Models Presented In The Text (FIGS 7, 8, & 10)

The upper half of the table presents estimates for the start of the earliest activity at the monument. The lower half of the table provides estimates for the end of activity at the monument. Ranges are cited at 95% or 68% probability unless otherwise stated
Stable Isotope Analysis
Stable isotope method
Collagen was prepared following Privat et al. (Reference Privat, O'Connell and Richards2002). Aliquots of 3–4 mg were analysed in triplicate (where possible) or duplicate for each dated skeletal element, and averages taken for analysis. Measurements reported here were made on collagen with good preservation, passing acceptable C/N ratio and % collagen criteria (Bronk Ramsey et al. Reference Bronk Ramsey, Higham, Bowles and Hedges2004a), and reflect in vivo rather than diagenetic signals.
Purified collagen samples were processed in an automated carbon and nitrogen analyser coupled to a continuous-flow isotope ratio-monitoring mass spectrometer (Europa Geo 20/20 mass spectrometer). δ13C values were measured relative to secondary standards included in the same run, which had been calibrated to VPDB; δ15N values measured were relative to AIR. The estimated analytical (random) error is 0.3‰ for δ13C and 0.1‰ for δ15N.
No individuals sampled here were young enough to retain any ‘weaning signal’ and juvenile samples (OxA-13747; -13746; -13741; -13742) are consistent with this. No significant difference in δ15N values are observed where sex can be identified, although, given the wide variance, small differences of c. 0.5‰ would be difficult to demonstrate. Unfortunately, there are no contemporary faunal samples from the site, making a reliable evaluation of the trophic level enrichment (δ15N) impossible.
Stable isotope results
The δ13C values (average δ13C = –20.7 ± 0.3‰) easily fit into typical terrestrial C3 human ranges from Neolithic British sites. The variance is similar to intra-site values found across Neolithic Europe (Hedges et al. Reference Hedges, Bentley, Bickle, Cullen, Dale, Fibiger, Hamilton, Hofmann, Nowell and Whittle2013).
The δ15N data are significant in value and pattern. The dataset (average δ15N = 10.4 ± 0.8‰) is high when compared with Neolithic values; excluding Coldrum, Le Déhus (Guernsey), and known young children, the British Neolithic average is δ15N = 9.6 ± 0.8‰ (Rick Schulting, pers. comm. 2012; Schulting & Richards submitted). Le Déhus provides a notable exception; here Schulting et al. (Reference Schulting, Sebire and Robb2010b) produced average δ15N values of 14.1‰ (see below). The Quanterness average δ15N higher than Coldrum at 11.1 ± 0.6‰, and was not interpreted as evidence of the consumption of marine foods (Schulting et al. Reference Schulting, Sheridan, Crozier and Murphy2010a); perhaps as at Coldrum, such trends reflect distinct regional traditions after the appearances of the regionally earliest Neolithic traditions and material culture. In addition, the Coldrum δ15N variance is also comparatively large.
Change through time in isotope values
We have used the median of the 95% posterior density estimate from the preferred chronological model (model 2) as a means to analyse change through time. The main feature of the data, which may obscure other relationships, is the statistically very clear correlation of isotopic value against time; there is a significant change in δ15N values and a smaller change in δ13C values over time. The correlation (R2 = 0.59) between δ15N and the midpoint of the posterior density estimates represents an overall increase of 3‰ in δ15N. This is a significant shift in δ15N enrichment – almost equivalent to what might be expected for a whole trophic level shift (Fig. 12). The changes in the δ13C values are less marked. The correlation (R2 = 0.34) between δ13C and the mid-point of the posterior density estimates is equivalent to an overall increase of 1‰. There appear to be more outliers in this plot (Fig. 13). The correlations between the stable isotope changes have opposite slopes, though there is clearly proportional correlation between the δ15N and δ13C values. Given these trends, it is difficult to envisage the ‘driving mechanism’ responsible, and the changes cannot definitely be ascribed to a common process. A similar trend in British Iron Age pig populations has been noted by one of us, though the reason for these changes is likely to be very different (Hamilton et al. Reference Hamilton, Hedges and Robinson2009). The earlier use of the monument shows a temporal clustering distinct from the later use of the monument (Figs 12–14). The later data still retain some temporal structure in δ15N (which is the main discriminating isotopic axis). These interpretations are somewhat speculative; certainly the data support a model of change in diet over time and this evidence may be relevant to understanding the cause.

Fig. 12 Changes in δ15N values over time. The horizontal axis plots δ15N (with estimated analytical error); the vertical axis plots the posterior density estimate median and standard deviation range from the preferred model (model 2, Fig. 8)

Fig. 13 Changes in δ13C values over time. The horizontal axis plots δ15C (with estimated analytical error); the vertical axis plots the posterior density estimate median and standard deviation range from the preferred model (model 2, Fig. 8)

Fig. 14 A plot of δ13C against δ15N values (with estimated analytical error). We differentiate between samples which we suggest may represent an early phase of activity at the site (Phase 1) and samples that represent later activity at the site. Our interpretive phasing – based on radiocarbon statistical consistency and the association of two skulls with the lower platform (Bennett Reference Bennett1913) – appears to be supported by the trend in stable isotope data towards increasing enrichment in δ15N values in the later phase of activity at the site
Discussion
As so often with data limited to two isotopic values, several hypotheses can be constructed in explanation. We suggest several possibilities, which may not be mutually exclusive. First, the shift could be due to a change in the isotopic composition of the same basic diet, arising from change in the environment where the food is produced. Were the local food source δ15N values to be enriched relative to the rest of the country there would be a proportional enrichment in the human population. This could arise from increased intensive use of animal manure (affecting both plants and animals; Bogaard et al. Reference Bogaard, Heaton, Poulton and Merbach2007; Hedges & Reynard Reference Hedges and Reynard2007; Fraser et al. Reference Fraser, Bogaard, Heaton, Charles, Jones, Christensen, Halstead, Merbach, Poulton, Sparkes and Styring2011), or the exploitation of grazing land unusually enriched in δ15N.
The proximity of Coldrum to the Medway estuary allows us to consider the possibility of δ15N enrichment in saline conditions (Britton et al. Reference Britton, Müldner and Bell2008; Schulting et al. Reference Schulting, Sebire and Robb2010b) or perhaps also in estuarine anoxic (i.e. denitrifying) conditions (cf. Olsen et al. Reference Olsen, Dausse, Garbutt, Ford, Thomas and Jones2011; Ohte Reference Ohte2012). Change through time might result from gradual change in sedimentation patterns, or in the management of available grazing lands, or other changes in estuarine or river hydrology (Darling Reference Darling2004). From the available data, in general environmental situations involving an increase in δ15N tend to imply an increase in δ13C (e.g. Britton et al. Reference Britton, Müldner and Bell2008). In the case of Coldrum, the increase in δ15N values is accompanied by a small decrease in δ13C values. The stable isotope patterning from Coldrum requires further investigation of possible values entering the human food chain in estuarine environments, and specifically in the Neolithic Medway (cf. Olsen et al. Reference Olsen, Dausse, Garbutt, Ford, Thomas and Jones2011; Ohte Reference Ohte2012).
A second possibility is a change in diet over time. Without local fauna, this is impossible to document clearly, and in any case, the issue is not simple (Hedges & Reynard Reference Hedges and Reynard2007). A shift from a modest exploitation of cow to a large emphasis on pig, for example, might explain a 2‰ shift in δ15N, but such a scenario would have to involve very large quantities of pig as a percentage of the diet, and in any case the δ15N value (which is already high in early individuals) would require additional explanation. Other possibilities that could contribute to the δ15N enrichment could include for example the consumption of pigs raised on milk.
As noted, fish consumption could also elevate δ15N values. However, for Coldrum the decrease in δ13C as δ15N increases is decisive evidence that marine resources were not consumed. It remains possible that freshwater or migratory fish (including eels, Anguilla anguilla) are responsible for the elevated δ15N in later skeletons, and the later population may therefore have a reservoir offset (which we think is not significant in terms of the start of activity at the monument). Too little is known of freshwater reservoir effects for involved discussion of possible effects on radiocarbon measurements from the later individuals (in the literature, only examples of significant reservoir effects have been reported; e.g. Cook et al. Reference Cook, Bonsall, Hedges, McSweeney, Boroneant¸ and Pettitt2001; Reference Cook, Bonsall, Hedges, McSweeney, Boroneant¸, Bartosiewicz and Pettitt2002; cf. Keaveney and Reimer Reference Keaveney and Reimer2012). The δ13C values are consistent with either a freshwater fish dietary content, or a basically (though perhaps complex) terrestrial source. Importantly, the results argue against the δ15N increase as a purely trophic level effect (where δ13C tends to increase along with δ15N, rather than decrease as seen here).
Current interpretations of stable isotope evidence for the early Neolithic (Richards Reference Richards2003; Schulting & Richards Reference Schulting and Richards2002) suggest that there is no other evidence for fish consumption in mainland Britain. Outside mainland Britain evidence for elevated δ15N values from the three burials at Le Déhus has been observed by Schulting et al. (Reference Schulting, Sebire and Robb2010b) and a convincing explanation is similarly elusive. As Schulting et al. (Reference Schulting, Sebire and Robb2010b) discuss, a number of subsistence strategies could result in these data, including significant reliance on A. anguilla, or consumption of manured cereal crops, or exploitation of coastal marshes as animal pasture. At both Le Déhus and Coldrum it must be emphasised that the potential sources of the isotopic enrichment could include a combined environmental and dietary selection effect.
Finally, it is possible that the changes did not result from a ‘directional’ change in diet – an increasing emphasis on an aspect of a subsistence repertoire over time, but from diverse dietary repertoires, which may have changed over times. In this scenario the change in negative correlation of the δ13C and δ15N values would not be related and the trends are coincidental. Even were the trend coincidental, the elevation in δ15N values of the later individuals remains highly significant, unusual and currently without satisfactory explanation.
Summary and Discussion
We have established that the remains of a minimum of 17 individuals – men, women, and children – were deposited in the western part of the chamber. One adult male suffered a blow to the head; an adult female skull exhibited trauma and cut-marks (Schulting & Wysocki Reference Schulting and Wysocki2005). At least one adult, probably male, had cut-marked bones, which may have resulted from the separation of the upper thigh from the hip, perhaps to hasten the disarticulation process.
Isotopic analysis revealed δ13C values typical for many Neolithic sites in southern Britain, but significantly enriched values of δ15N, which were further enhanced through time. In the absence of local faunal data, these patterns are difficult to interpret but could reflect a terrestrial diet high in animal protein supplemented by some reliance, which may have increased through time, on freshwater river (or conceivably estuarine) resources. We cannot yet satisfactorily explain the pattern of stable isotopes, but these data emphasise the potential importance of complex dietary inputs, as well as the need for multi-isotope studies (e.g. sulphur and strontium: Bickle & Whittle Reference Bickle and Whittle2013; Nehlich et al. Reference Nehlich, Borić, Stefanović and Richards2010). Of great benefit to the current study would be further research into the isotopic signals of resources from riverine and estuarine environments (cf. Keaveney & Reimer Reference Keaveney and Reimer2012); the potential for complex carbon and nitrogen cycling in such regions requires reference points from, for example, terrestrial animals subsisting in salt marsh, and aquatic and semi-aquatic plant and animal resources at various locations across estuary environments. Such data are essential to contextualise our understandings of cultivation and animal husbandry strategies, such as manuring (Bogaard et al. Reference Bogaard, Heaton, Poulton and Merbach2007; Reference Bogaard, Krause and Strien2011).
Posterior density estimates from our preferred model suggest that the monument was first used in 3980–3800 cal bc (95% probable) or 3960–3880 cal bc (68% probable; start Coldrum 1 model 2; Fig. 8). The later ‘phase’ we have employed for analysis purposes may in fact represent activity that was episodic and occurred over a considerable period of time. The interval between the first phase of activity which we have suggested and subsequent activity was probably greater than the lifespan of any individual, and may have been significantly longer (60–350 years; 95% probable; or 140–290 years; 68% probable; Coldrum 1/2; Fig. 9). Subsequent activity probably began in 3730–3540 cal bc (95% probable) or 3670–3560 cal bc (68% probable; start Coldrum 2 model 2; Fig. 8).
Despite the density of Neolithic mortuary monuments in England and Wales relatively few have sufficient appropriate data to allow robust, explicit, and quantifiable estimates for their use or construction. Many such monuments do not seem to have been constructed before the 38th century cal bc (Bayliss & Whittle Reference Bayliss and Whittle2007; Whittle et al. Reference Whittle, Healy and Bayliss2011b). A possible comparison for Coldrum may be identified at Burn Ground in the Cotswolds (Smith & Brickley Reference Smith and Brickley2006; Dixon et al. Reference Dixon, Bayliss, Healy, Whittle and Darvill2011), which may have been constructed in 4140–3760 cal bc (95% probable) or 3985–3875 cal bc (46% probable) or 3860–3790 cal bc (22% probable; start Burn Ground; Smith & Brickley Reference Smith and Brickley2006, fig. 9.25; Dixon et al. Reference Dixon, Bayliss, Healy, Whittle and Darvill2011, 468). However, this monument also has a number of caveats in its chronological interpretation.
The morphology of the Medway monuments may be regarded as unusual in comparison with other early Neolithic mortuary sites (but see Ashbee Reference Ashbee2005, 108). This has been suggested to be associated with continental influence or origins; the ‘northern’ (Ashbee Reference Ashbee1998, 36) or ‘Nordic’ (Piggott in Jessup Reference Jessup1939, 267) polished flint axe from the Julliberrie's Grave monument might underline such associations. While the Julliberrie's Grave axe has been identified as a foreign example, the petrological provenance of the item remains uncertain and is the subject of further research (Katharine Walker, pers. comm. 2012; see also Darvill Reference Darvill2010, 126; Barrett et al. Reference Barrett, Bradley and Green1991, 54; Ashbee Reference Ashbee2005, 98).
The distinctiveness of the Medway monuments could reflect local developments or experiments with styles and customs, which only later became more widespread in Britain after the 38th century cal bc (Whittle et al. Reference Whittle, Healy and Bayliss2007; Reference Whittle, Barclay, Bayliss, McFadyen, Schulting and Wysocki2011b; Griffiths Reference Griffiths2011). Without further chronological evidence for the local Medway monuments, or better dating of possibly related monuments from the continent (cf. Whittle et al. Reference Whittle, Healy and Bayliss2011b), it is difficult to assess the role of Coldrum within early Neolithic monument traditions.
We can provide a more general context for the early Neolithic in the Thames Estuary and southern England. Some of us (Whittle et al. Reference Whittle, Healy and Bayliss2011b; Griffiths Reference Griffiths2011) have presented data which strongly suggest that the Greater Thames Estuary was probably the region which witnessed the earliest Neolithic material culture and practices in England, Wales, Ireland, and parts of Scotland (note continuing uncertainty over the chronology of the Irish causewayed enclosure at Magheraboy, Co. Sligo: Cooney et al. Reference Cooney, Bayliss, Healy, Whittle, Danaher, Cagney, Mallory, Smyth, Kador and O'Sullivan2011; cf. Sheridan Reference Sheridan2010; Reference Sheridan2012).
Other robustly dated examples of early Neolithic practices in the Thames Estuary include the Yabsley inhumation (in which bowl pottery was deposited) in 4230–3980 cal bc (95% confidence; or 4060–3990 cal bc (68% confidence; KIA-20157; 5252 ± 28 bp; Coles et al. Reference Coles, Ford and Taylor2008); and the first activity at the post-and-slot structure at White Horse Stone (Hayden & Stafford Reference Hayden and Stafford2006; Garwood Reference Garwood2011) in 4115–3825 cal bc (95% probable) or 4065–3940 cal bc (68% probable; build WHS; Bayliss et al. Reference Bayliss, Allen, Healy, Whittle, Germany, Griffiths, Hamilton, Higham, Meadows, Shand, Stevens and Wysocki2011a, 379; fig. 7.26). In south-east England, other important early Neolithic activity included flint axe extraction in the Sussex flint mines in 4145–3805 cal bc (95% probable) or 4020–3855 cal bc (68% probable; start Sussex flint mines; Bayliss et al. Reference Bayliss, Healy, Whittle and Cooney2011b, 789, fig. 14.129).
The oldest remains deposited at Coldrum represent people who most probably died in the late 40th–early 39th centuries cal bc (3960–3880 cal bc; 68% probable; start Coldrum 1 model 2; Fig. 8). While part of the regional early Neolithic, it is highly probable that the Coldrum monument was not the earliest expression of Neolithic activity in the south-east and Thames Estuary; it is 89% probable that the White Horse Stone structure was in use before activity at Coldrum. It is 100% probable that the Yabsley burial occurred before Coldrum. It is more probable (61% probable) that the earliest activity at the Sussex flint mines occurred before the start of use of the Coldrum monument, though the start of activity at Coldrum occurred before the end of activity at the flint mines (Fig. 15), meaning that some of the people buried at Coldrum could have been contemporary with activity at the Sussex flint mines.

Fig. 15 Comparison of the posterior density estimates from Coldrum, Yabsley Street, White Horse Stone, and the Sussex flint mines. The models for White Horse Stone, Yabsley Street, (KIA-21057), and the Sussex flint mines have been recalculated using OxCal v4.1, but follow the model structure shown in Bayliss et al. (Reference Bayliss, Allen, Healy, Whittle, Germany, Griffiths, Hamilton, Higham, Meadows, Shand, Stevens and Wysocki2011a, 379, fig. 7.26), Bayliss et al. (Reference Bayliss, Healy, Whittle and Cooney2011b, 731, fig. 14.49), and Bayliss et al. (Reference Bayliss, Healy, Whittle and Cooney2011b, 793, fig. 14.129)
A number of early Neolithic causewayed enclosures are known from the region, at St Osyth, Essex (Germany Reference Germany2007), Kingsborough 1 and 2, Isle of Sheppey (Allen & Leivers Reference Allen and Leivers2008), and Chalk Hill, Ramsgate (Dyson et al. Reference Dyson, Shand and Stevens2000). However, chronological modelling indicates that these sites were also not part of the earliest regional Neolithic (Healy et al. Reference Garwood2011). The initial construction of the causewayed enclosure at Burham on the east side of the Medway valley itself has recently been dated to the early 37th century cal bc (Paul Garwood, pers. comm. 2012; Garwood Reference Garwood2012, 3).
There is limited evidence with which to understand relationships between populations with access to the earliest Neolithic and the latest Mesolithic material culture and lifeways in the Greater Thames Estuary. Mesolithic lithic scatters and find spots are located on greensand deposits at the foot of the North Downs, and elsewhere (Ashbee Reference Ashbee2005, 79; Garwood Reference Garwood2011, fig. 3.9), but the continuing dearth if not absence of very late sites, despite the scale of recent investigations, remains striking (Garwood Reference Garwood2011, 52). Notable is the sizeable Mesolithic scatter on the greensand at Addington (Ashbee Reference Ashbee2005, 80). Here the Chestnuts tomb directly overlay part of the flint scatter (Alexander Reference Alexander1959; 1962); Mesolithic activity at the site may have been associated with a possible post-hole and hearth (Fisher Reference Fisher1939, 147; Jessup 1950, 55). Ashbee (Reference Ashbee2005, 80) suggests that the long barrows at Addington ‘… were deliberately sited upon this Greensand area, because of its deep-rooted associations, and not on the chalk like their fellows’; this should, however, be contrasted with the concentrations of early Neolithic monuments on Greensand outside Wessex, for example in the distribution of monuments in Lincolnshire (Griffiths Reference Griffiths2011, 87). In addition, the limited evidence for latest Mesolithic activity in the region means that we should be wary about associating superimposition or shared location as evidence for continuity between people engaged with latest Mesolithic lifeways and those with access to the earliest Neolithic traditions (Griffiths Reference Griffiths2011).
One possible ‘transition’ site in Kent is the lithic assemblage from Erith. Here the very large late Mesolithic assemblage and diagnostic early Neolithic assemblage (which includes pottery) might suggest that activity continued across ‘the transition’ without discernible changes in lithic raw material procurement, technology, or depositional practice, though this site is not without problems of interpretation (Leivers unpublished seminar presentation; pers. comm. 2012). Chronometric data from Kent – at Charlwood, High Rocks, and Finglesham – which have been argued to suggest evidence for ‘transitional’ Mesolithic–Neolithic activity are also problematic (as discussed by Healy at a recent South-East Research Framework Resource Assessment Seminar).
The importance of river valleys in the early Neolithic and later has been emphasised in other regions, for example in the Nene valley (Healy et al. Reference Healy, Harding and Bayliss2007), the Trent (e.g. Loveday Reference Loveday2000; Brightman Reference Brightman2009; Beamish Reference Beamish2009), and Wessex (Leary & Field Reference Leary and Field2012). The siting of the Medway monuments (Fig. 1) might provide further evidence of that significance (cf. Loveday Reference Loveday2006). The Medway monument locations raise the potential of the river network as a major routeway – perhaps including as a means by which Neolithic material culture was brought to Britain (cf. Garrow & Sturt Reference Garrow and Sturt2011). Ongoing strontium and oxygen isotope analysis to investigate the origins and mobility of the Coldrum population will contribute to this debate (Samantha Neil and Chris Scarre, pers. comm.); aDNA analysis would also be highly desirable.
Ink continues to be poured on the Big Question of the Mesolithic–Neolithic transition, with protagonists for both colonisation (e.g. Sheridan Reference Sheridan2000; Reference Sheridan2003; Reference Sheridan2004; Reference Sheridan2007; 2010; Sheridan & Pailler Reference Sheridan and Pailler2011; Schulting Reference Schulting2000; Schulting et al. Reference Schulting, Sebire and Robb2010b) and indigenous change (e.g. Thomas Reference Thomas1999; Reference Thomas2003; Reference Thomas2007; Reference Thomas2008; Reference Thomas2013) until recently still to the fore; both approaches have used informal inspection of the radiocarbon evidence. Fusion or integrationist models have also now been proposed (Whittle Reference Whittle2007; Whittle et al. Reference Whittle, Bayliss and Healy2011a; cf. Zvelebil & Lukes Reference Zvelebil and Lukes2008), and some of us (Whittle et al. Reference Whittle, Bayliss and Healy2011a) have also recently discussed elsewhere, in a Bayesian framework providing explicit, quantified, and probabilistic date estimates, the context of and processes by which early Neolithic material culture and practices first appeared in Britain. From those perspectives, the first Neolithic things and practices probably appeared in the area of the Greater Thames Estuary, in the 41st century cal bc, shortly followed by Sussex; the model proposed was of small-scale movement of population from the adjacent continent, an offshoot of extensive changes in the world of the Michelsberg and perhaps northern Chasséen cultures, with subsequent and accelerating movement to the west and north of Britain, combined with acculturation of the indigenous population (Whittle et al. Reference Whittle, Bayliss and Healy2011a). The general comparisons made in the literature with continental monuments suggest no specific European antecedents for the form of monument at Coldrum, though by its probable start date megalithic construction had begun in north-west France (Cassen et al. Reference Cassen, Lanos, Dufresne, Oberlin, Delqué-Kolic and Le Goffic2009), and more modest monuments are known in the Aisne valley (Demoule Reference Demoule2007). The idea of building monuments of this kind therefore seems certainly to have pre-dated Coldrum, but whether such construction in Kent was effected by early generations of immigrants, or their descendants, or by a slightly later and more mixed population, remains an open question for continuing research.
Acknowledgments
Osteological analysis by Michael Wysocki was undertaken as part of a larger research project, directed by Alasdair Whittle and made possible by an Institutional Award from the Leverhulme Trust. A first round of radiocarbon measurements was funded by NERC; the results of these measurements were recognised to have been subject to a processing issue at the laboratory (Bronk Ramsey et al. Reference Bronk Ramsey, Higham, Bowles and Hedges2004a; Brock et al. Reference Brock, Bronk Ramsey and Higham2007), were withdrawn and are not reported here. A second round of radiocarbon dates and stable isotope analysis were produced by ORAU to investigate this issue; further research was undertaken as an AHRB-funded MSc project by Seren Griffiths. Initial modelling generated as part of this MSc thesis was presented in Whittle et al. (Reference Whittle, Healy and Bayliss2011b), as part of the dating project on causewayed enclosures, joint-funded by English Heritage and AHRC.
We thank Louise Humphrey, Robert Kruszinsky, and Jerry Hooker of the Vertebrates and Anthropology Section, Palaeontology Department, Natural History Museum, London, and Maggie Bellatti and Martha Lehr of the Duckworth Laboratory Collection for access to their human remains collections and for permission to take samples. Giles Guthrie, Keeper of Human History at Maidstone Museum and Bentlif Art Gallery, provided access to and information on the Coldrum archive. We are grateful to Tamsin O'Connell for comments and support. Peter Andrews, then of the Palaeontology Department Natural History Museum, London, confirmed the initial cut-mark identification, and offered comments and observations. Kirsty Harding and Derek Hamilton helped prepare figures. Megan Brickley and Paul Garwood read and commented on earlier versions of this paper, and we also are grateful to three anonymous referees for their constructive criticism.


