Background
Invasive blood pressure (IBP) in the prehospital setting could be both useful and feasible;Reference Wildner, Pauker and Archan 1 , Reference Sende, Jabre and Leroux 2 IBP could facilitate induction of vulnerable out-of-hospital patients during administration of anesthetic drugs. For patients with traumatic brain injury, prompt detection and treatment of hypotension is important.Reference Carney, Totten and O’Reilly 3 Additionally, for cardiopulmonary resuscitation, there are recommendations to use diastolic pressures to guide resuscitation and vasopressor dosage.Reference Naim, Sutton and Friess 4 , Reference Meaney, Bobrow and Mancini 5
Conventionally, arterial lines for adult patients are continuously flushed by using a pressurized bag with normal saline (NS). In a study of 137 prehospital patients, the median time to successful cannulation was two minutes, and the median time to prepare the IBP monitoring device was three minutes.Reference Wildner, Pauker and Archan 1 The conventional preparation presents the prehospital clinician not only with a time-consuming effort to assemble and pressurize the flush system, but also with collecting these items in an already limited space. Furthermore, neither discussions with a manufacturer of common transducer kits nor a literature search in the PubMed database (National Center for Biotechnology Information, National Institutes of Health; Bethesda, Maryland USA) have given clarifications on if this has been tested before.
A suggestion for an easy-to-handle, convenient prehospital arterial line flush system has been proposed.Reference Linde 6 This device would replace the usual pressurized drip bag with a syringe, thus replacing the continuous flow with intermittent manual injections of NS to prevent clotting. To stop arterial blood from flowing into the pressure sensor, a short three-way stopcock connected between the transducer and the syringe is needed, which should always be closed except when manually flushing the system. In theory, the pressure measurements should be the same with and without the continuous flow of pressurized NS through the transducer kit.
The aim of this study was to compare blood pressures measured by a standard IBP (sIBP) transducer kit with a minimized flush system IBP (mIBP) where the pressurized drip bag was replaced by a syringe with a 3-way stopcock.
Methods
Design of the Model
The design was an experimental model in which pressure could be varied over time, mimicking intra-arterial pressure fluctuations, while allowing for simultaneous measurement with both devices. The study was performed in the Medical Technical Department of Södersjukhuset (Stockholm South General Hospital), Stockholm, Sweden. It involved no patients and was purely an experimental model. Ethical approval was considered not necessary by institutional and hospital rules.
The blood pressure generating model was designed as follows: a small chamber with four vertically aligned connectors was constructed (Figure 1). To modulate the pressure inside the chamber to mimic a pressure curve of a peripheral artery, a ProSim 8 vital signs simulator (Fluke Biomedical; Washington USA) was used. The chamber was partly filled with water. The fluid level of the chamber was set between the first and second connector, with the ProSim 8 connected first from top, interfacing with the air-filled part of the chamber. The second connector was connected to a manual pressure gauge (Bosch & Sohn GmbH; Jungingen, Germany), which its purpose was to pressurize the chamber to reach the desired mean arterial pressure (MAP).
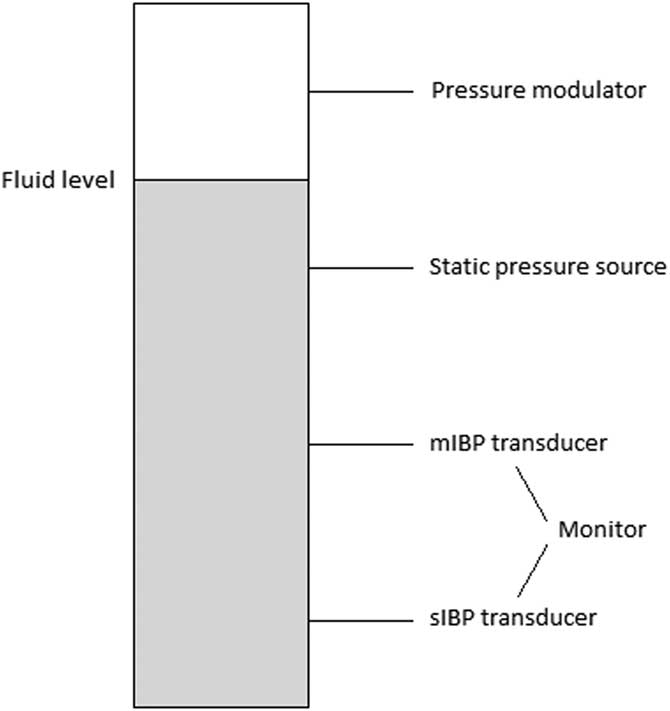
Figure 1 An Overview of the Experimental Pressure System. Abbreviations: IBP, invasive blood pressure; mIBP, minimized flush system IBP; sIBP, standard IBP.
The third connector was attached to the mIBP transducer set: a DTX Plus PMSET 1DT-NN NON-PHT (ref 689133; Argon Medical Devices; Texas USA) pressure transducer, typically used for pediatric intensive care. Here, replacing the standard flush device, a short 3-way stopcock (One Med Group Oy; Finland) and a 10-ml syringe filled with saline 9mg/mL (NS; Braun, Melsungen; Germany) were connected immediately after the transducer. The fourth and lowest connector was connected to the sIBP transducer set, a standard adult Gabarith PMSET 1DT-XX 1Safedraw-P (ref 688410; Argon Medical Devices; Texas USA) pressure transducer with a standard 500ml NS drip bag, pressurized to 300mmHg via a manual pressure cuff, giving a continuous flush of approximately 3ml/h. The length of tubing separating the pressure sensor and the pressure generating model differed between the two: 225cm for the PMSET and 180cm for the DTXPlus transducer kits. Both transducers were connected to a calibrated dual-channel Datex Ohmeda anesthesia monitor (model D-LCC12A-01; GE Healthcare; Illinois USA). Each vertical side of the chamber was tightly sealed with a rubber wedge.
Different pressure transducer kits were used for sIBP and mIBP. The standard adult Gabarith transducer comes pre-made with a line for bag connection (without luer-lock connection) and could therefore not be used for mIBP. Since the pediatric DTXplus transducer produces a much higher flush flow (30mL/h) when used with a pressurized bag, it is unsuitable for sIBP measurements. The actual pressure sensors are identical in the two kits.
Data Collection
Before each measurement series, the water level of the pressure chamber was checked. The sIBP flush bag was adjusted to 300mmHg and both transducer sets were flushed, checked for air bubbles, and zeroed. The chamber was pressurized to the desired MAP using the pressure gauge. The ProSim 8 pressure modulator was started with settings known from preliminary testing to achieve realistic pulse pressures. Pulse rate was set to 60 beats per minute. Small adjustments were made with the pressure gauge when pressures either decreased or increased (as measured with sIBP) outside ±10% of the desired MAP for the series.
Four series of measurements were taken: MAP 40, MAP 70, MAP 110, and MAP 140mm Hg. For each measurement series, the systolic blood pressure (SBP), diastolic blood pressure (DBP), and MAP were recorded by sIBP and mIBP at each minute zero through ten, minute 12, 14, 16, 18, and 20 minutes after start. In total, 192 (4 x 3 x 16) paired observations were recorded.
Statistical Analysis
The cutoff for clinical significance in measurement error between the two devices was decided to be ± five percent. Agreement between the readings from mIBP and sIBP were assessed by Bland-Altman analysis,Reference Bland and Altman 7 where the mean of each pair of measurements is plotted against the difference. Differences between measurements were used to calculate upper and lower limits of agreement (mean bias, standard deviation [SD] = 1.96). For calculations and plot generation, MedCalc Version 17.8.6 (MedCalc Software; Mariakerke, Belgium) was used. To highlight where data deviated from the pre-defined limit of clinical significance, the percentage of observations where mIBP reported values deviating less than ± five percent from sIBP were calculated.
Results
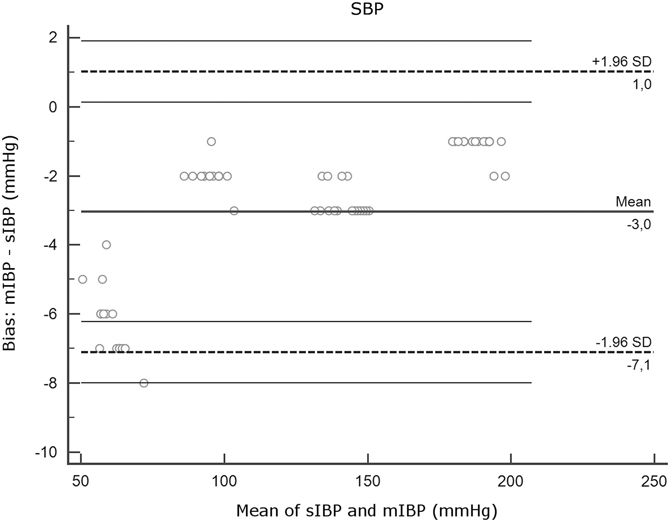
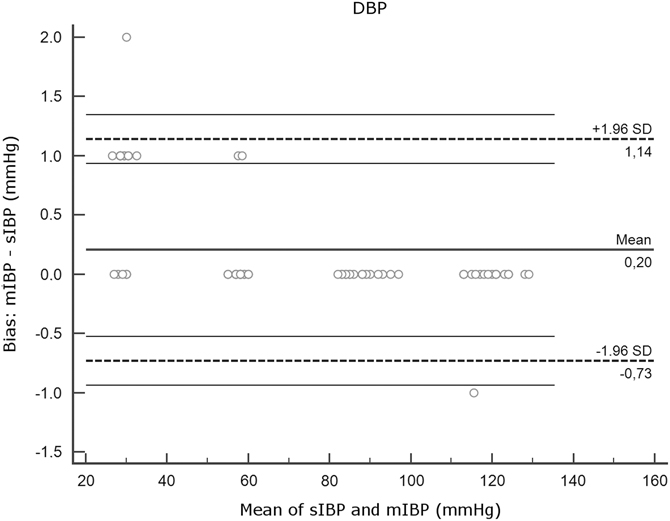
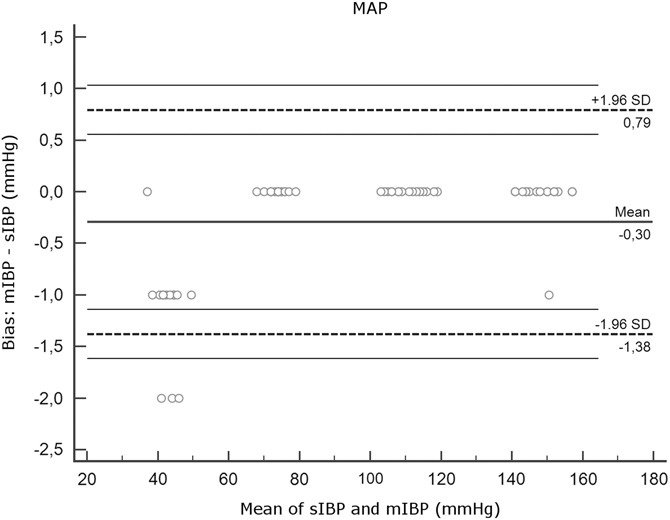
All recorded measurements were included in analysis. Firstly, for each parameter (SBP, DBP, and MAP), the four measurements series (MAP 40, 70, 110, and 140) were analyzed together. Figures 2A-2C show the Bland-Altman plots. Mean differences, SDs, limits of agreement, and the amount of mIBP measurements that differed less than five percent from sIBP are shown in Table 1.

Figure 2A Agreement Between mIBP and sIBP for SBP, Bland-Altman Analysis. Note: Y axis, differences between measurements (mIBP - sIBP). X axis, mean of mIBP and sIBP. Thick horizontal lines represent mean bias. Dotted lines indicate limits of agreement. Thin horizontal lines represent 95% confidence intervals of the limits of agreement. Note that the plots for SBP, DBP, and MAP have different y axis scales. Abbreviations: DBP, diastolic blood pressure; IBP, invasive blood pressure; MAP, mean arterial pressure; mIBP, minimized flush system IBP; SBP, systolic blood pressure; sIBP, standard IBP.

Figure 2B Agreement Between mIBP and sIBP for DBP, Bland-Altman Analysis. Note: Y axis, differences between measurements (mIBP - sIBP). X axis, mean of mIBP and sIBP. Thick horizontal lines represent mean bias. Dotted lines indicate limits of agreement. Thin horizontal lines represent 95% confidence intervals of the limits of agreement. Note that the plots for SBP, DBP, and MAP have different y axis scales. Abbreviations: DBP, diastolic blood pressure; IBP, invasive blood pressure; MAP, mean arterial pressure; mIBP, minimized flush system IBP; SBP, systolic blood pressure; sIBP, standard IBP.

Figure 2C Agreement Between mIBP and sIBP for MAP, Bland-Altman Analysis. Note: Y axis, differences between measurements (mIBP - sIBP). X axis, mean of mIBP and sIBP. Thick horizontal lines represent mean bias. Dotted lines indicate limits of agreement. Thin horizontal lines represent 95% confidence intervals of the limits of agreement. Note that the plots for SBP, DBP, and MAP have different y axis scales. Abbreviations: DBP, diastolic blood pressure; IBP, invasive blood pressure; MAP, mean arterial pressure; mIBP, minimized flush system IBP; SBP, systolic blood pressure; sIBP, standard IBP.
Table 1 Agreement Between mIBP and sIBP

Note: Mean Bias, mean of the differences (mIBP - sIBP) between the two devices. Mean bias is expressed as mean (SD). Limits of Agreement, mean bias (SD = 1.96). Observations Within ±5%, the number and percentage of mIBP observations that differed less than 5% from sIBP.
Abbreviations: DBP, diastolic blood pressure; IBP, invasive blood pressure; MAP, mean arterial pressure; mIBP, minimized flush system IBP; SBP, systolic blood pressure; sIBP, standard IBP.
Mean bias and SD were low for MAP and DBP (DBP: 0.20 [SD = 0.48]; MAP: 0.30 [SD = 0.55]) but higher for SBP (-3.05 [SD = 2.07]). Interpretation of the Bland-Altman plot for SBP (Figure 2A) shows that mIBP makes a higher error of under-estimation in the low pressures of the MAP 40 series.
Therefore, a closer analysis of SBP observations was performed. Table 2 shows SBP observations separated into measurement series.
Table 2 Agreement of mIBP and sIBP for SBP Measurements

Note: Mean Bias, mean of the differences (mIBP - sIBP) between the two devices. Mean bias is expressed as mean (SD). Limits of Agreement, mean bias (SD = 1.96). Observations Within ±5%, the number and percentage of mIBP observations that differed less than 5% from sIBP.
Abbreviations: IBP, invasive blood pressure; MAP, mean arterial pressure; mIBP, minimized flush system IBP; SBP, systolic blood pressure; sIBP, standard IBP.
The low-pressure measurements (SBP MAP 40) had a larger mean bias (-6.31 [SD = 1.01]) with all mIBP observations differing greater than five percent from sIBP, under-estimating pressure with 6.31mmHg on average. The high-pressure measurements (SBP MAP 70, MAP 110, and MAP 140) still had slightly negative mean biases, but none of the mIBP observations differed greater than five percent from sIBP.
Discussion
The main finding of this experimental study using a minimized IBP device shows that for MAP and DBP, the device gives measurements well within the desired ± five percent range of a standard pressure transducer kit. Concerning measurement of SBP, there was a tendency to under-estimate pressures, which increased in the low-pressure ranges.
In the SBP MAP 40 series, mean bias was -6.3mmHg or -9.9%. One possible reason could be a systematic bias where mIBP under-estimates SBP, which increases while blood pressure decreases. Another possible reason could be an undiscovered source of over-damping in the mIBP system during the experiment.
In the prehospital and battlefield area, time is a crucial factor for the outcome of the patient.Reference Harmsen, Giannakopoulos, Moerbeek, Jansma, Bonjer and Bloemers 8 Thus, the authors believe that even minor simplifications and improvements in design and use of equipment in this area could save valuable time. In a recent study of on-scene time for missions of a helicopter Emergency Medical Service in Norway, median on-scene time for all dispatches was 10 minutes. Counting only dispatches to patients with respiratory or cardiac arrest, median on-scene time was 20 minutes.Reference Østerås, Brattebø and Heltne 9 Invasive blood pressure management could be particularly useful for these types of patients. If time for preparation of IBP equipment could be reduced by two minutes, this means a 10%-20% reduction of on-scene time.
Furthermore, space in prehospital units is limited and every effort to save space is desirable. Therefore, reduction of the number of equipment devices, such as tubing and drip bags together with assembly lines, would be important. This may also decrease the risk of accidental decannulation.
The wedges used to seal the pressure chamber could not withstand pressures higher than >200mmHg. Therefore, in the experimental model, pressures in this range were not triggered. Another problem was a tendency of pressures to rise within the system during a measurement series, which required manual corrections. This was probably due to the addition of fluid into the small, low-compliance pressure chamber through the continuous flush of the sIBP transducer kit. However, it can be argued that this did not affect the outcome of measurements since this affected both devices equally.
Limitations and Future Implications
Limitations
Importantly, and this is a limitation of the study, the effects of a non-continuous flush system on arterial cannula patency were not addressed. In prolonged use, it is reasonable to believe that the mIBP cannula would suffer an increased risk of occlusion. However, during short-term use, such as during prehospital resuscitation and transport, the intermittent flush that mIBP allows would most likely be sufficient to keep the device from clotting.
This was a simple set up using already available equipment in this medical technical department. It has not been tested in the clinical area.
Future Implications
The mIBP could possibly measure MAP accurately across a range of physiological high and low pressures. This could allow for invasive pressure monitoring in the prehospital setting with reduced time for preparation of devices and fewer lines connected to the patient. This may reduce on-scene time for the prehospital team and reduce the risk of accidental arterial decannulation. In groups of patients where rapid shifts in hemodynamic parameters are common and deleterious for outcome, this could allow for better and more instant monitoring.
Conclusion
The main finding of this experimental study using a minimized IBP device shows that for MAP and DBP, the device gives measurements well within the desired ± five percent range of a standard pressure transducer kit. For SBPs in the lower ranges, mIBP was less accurate with a tendency to under-estimate. The possible effects on cannula patency were not addressed in this study. To investigate this, further studies are warranted, eventually in patients.
Author Contributions
All authors conceived the study. JK performed data collection and analysis. All authors contributed to and approved the final manuscript.
Acknowledgements
The authors acknowledge Jonas Jeschke of the Department of Health Technology, Södersjukhuset, Stockholm, for help with design and setting of the experimental model.