


Introduction
Many popular sports are dangerous for the players; in baseball, this privilege is extended to the spectators. Over one-half of the balls hit by batters fly into the stands, injuring approximately 1,750 people annually in the United States. Reference Fried1 Out of all major sports, baseball has the highest incidence of spectator accidents. Reference Ward2
In Boston’s Fenway Park (Boston, Massachusetts USA), approximately 30 balls per game go into the stands, injuring a spectator every three-to-four games. Reference Cloutier3 At the Braves’ former Turner Field (Atlanta, Georgia USA), 1.6% of stray balls caused injury to a spectator. Reference Glovin4 Data compiled by the Elias Sports Bureau (New York USA) show the number of foul balls (FBs) per game has increased 10% since 2000. Reference Tak, Nguyen, Enoch and Lehren5
Nevertheless, with a few notable exceptions, discussions of FB injuries are absent from the medical literature (Table 1). Reference Oh, Kim, Jo and Sung6,Reference Milsten, Seaman, Liu, Bissell and Maguire7 This paper attempts to address this gap through a FB injury-specific analysis of Major League Baseball (MLB) data while providing estimates of injury frequency and severity.
Table 1. Academic Literature Comparison of Foul Ball Injury Risk

Abbreviations: PPTT, patient presentation (reported as PPTT, where PPTT = patients per 10,000); FB, foul-ball related injuries; MLB, Major League Baseball.
Methods
Data Collection
A retrospective review of medical care reports for patients evaluated by on-site health care providers (HCPs) at three US-based MLB stadiums over a noncontiguous 11-year period (2005-2016) was performed (Table 2). There are 30 MLB stadiums, all with first-aid coverage provided by 24 private companies and six publicly funded agencies.
Table 2. Patients Evaluated by On-Site Health Care Providers
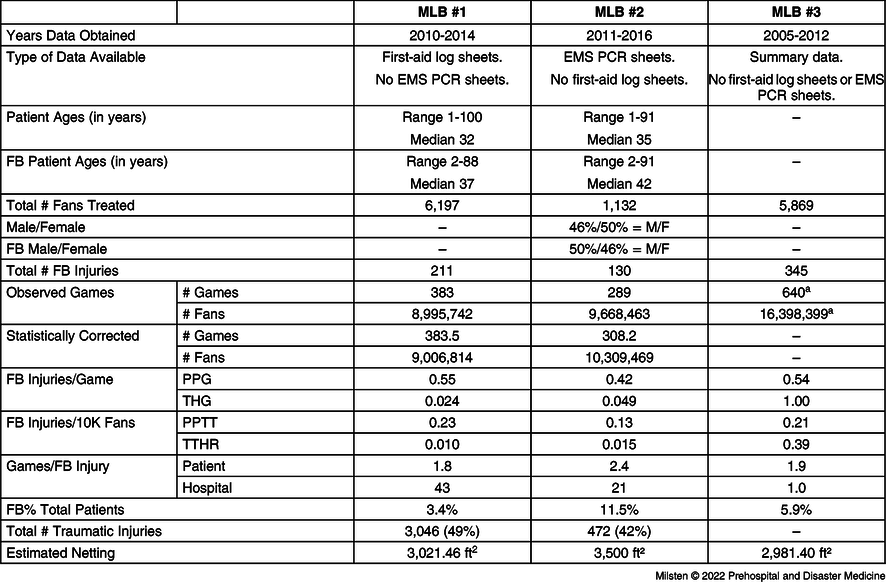
Note: FB-related injuries include foul ball and flying bat injuries. Traumatic injuries include any trauma-related injury that occurred during a game, excluding FB related injuries. “--” = No data available. Observed and corrected game/attendance counts refer only to single games.
Abbreviations: FB, foul ball; MLB, Major League Baseball; PCR, EMS patient care run sheets; PP/G, patient presentation rate/game (reported as PPTT, where PPTT = patients per 10,000); THG/TTHR, transportation to hospital rate/game (reported at patients per 10,000).
a MLB #3 provided only summary data; therefore, the authors could not statistically correct for double-headers as was done with MLB #1 and #2.
Not surprisingly, all 30 MLB teams would not share data. In order to proceed, Freedom of Information Act (FOIA) requests were sent to the six publicly funded first-aid agencies. The first-aid forms and Emergency Medical Services (EMS) patient care run sheets (PCRs) were requested, and from this smaller subset, four responded affirmatively. From the four affirmative FOIA responses, two sent usable data and two sent incomprehensible and incomplete data. Entities subject to FOIA are permitted to require that the requester pay administrative fees. Two of the first-aid operators did request fees (MLB #1 and MLB #2), and as a result, the principal investigator applied for and received a University of Massachusetts (Worcester, Massachusetts USA) Emergency Medicine Research Division Small Grant (US$1,570). The health care agency covering MLB #3 provided an annual summary report.
When available, researchers extracted: game date, age, gender, mechanism of injury, diagnosis, location of injury, abnormality of vital signs, specific treatment received, treatment category, and disposition. Attendance information was obtained from an online baseball reference; games lacking attendance data were dropped (MLB #1 = three games; MLB #2 = one game). 8 Double headers (two games played consecutively) were removed because some feature counts (eg, attendance and injury counts) could not be unambiguously associated with the correct game (MLB #1 = no games; MLB #2 = 15 games across eight dates).
Each MLB team was asked for protective netting data and declined to give any. Therefore, the square footage of netting was estimated via literature references and photogrammetry. 9,10
Diagnostic Categories
The diagnostic categories outlined by Ranse, et al were used with the following changes: “syncope” replaced “faint” and “collapse;” “contusion” and “dizzy/lightheaded” were included, but there was no “other minor wounds;” “mental health” was used instead of the five sub-diagnoses; and “foreign body” was used instead of the eight sub-diagnoses. Reference Ranse, Hutton, Turris and Lund11 The most immediate reason for care was considered the “chief complaint.” The primary diagnosis was taken directly from the first-aid sheets. If no primary diagnosis was listed, the investigators assigned their best estimate based on the chief complaint and first-aid narrative.
Foul ball and flying bat injuries were combined into one number for ease of calculations (“FB”), but flying bats accounted for fewer than five percent of FB injuries. For comparison, all other traumatic injuries (eg, trip/fall, minor burns) occurring during a game, excluding FB patients, were examined. The data received did not specifically list if patrons were injured while chasing a FB or the ensuing scrum for that ball.
Statistical Methods
Foul ball injuries were evaluated by considering the rates of two different events: the number of patient presentations (PPs) to the first-aid center (based on log sheets) and the number of transportations to hospitals ([TH] based on EMS PCR sheets). For each category, two metrics were used to quantify risk rates: the rate of events per game (patient presentations per game, PPG; and transports to hospital per game, THG) and the rate of events per 10,000 attendees of the event (PPTT and TTHR).
Both MLB #1 and MLB #2 provided injury data per game whereas MLB #3 provided summary counts. Some games lacked corresponding medical events. There are two possible reasons for this: absence of injuries or missing data. The authors fit a zero-truncated negative binomial distribution to the games with non-zero patient presentations via maximum likelihood to impute the probability that a game generates no events. To compute PPTT and TTHR correctly, the attendance at zero-injury games needed to be counted. To that end, the mean attendance per game across all unobserved games for each year was computed. The authors weighted these means by the number of observed games in each year.
All data were tracked in a spreadsheet (Microsoft Excel, Version 16.55; Microsoft Corporation; Redmond, Washington USA). Software for web scraping, automated data extraction, data cleaning, and statistical analysis was developed by the authors and is publicly available. Reference Bradley12 The study was approved by the University of Massachusetts Chan Medical School (Worcester, Massachusetts USA) Institutional Review Board.
Results
MLB #1 sent first-aid log sheets (with no ambulance PCR sheets) spanning 2010-2014. Log sheets described 6,197 PPs across 383 of the 408 actual home games. Of the PPs, 211 (3.4%) were FB injuries. Total attendance at these games was 8,995,742. None of these games were double-headers. Patient age ranged from one to 100 years, and median age was 32 years; patients with FB injuries ranged from two to 88 years, and median age was 37 years. Gender data were largely missing.
MLB #2 sent ambulance PCR sheets spanning 2011-2016. Incomplete first-aid log sheets and EMS call logs of patient refusals were also sent but were unusable as there was no way to deduplicate PPs from PCR sheets. The PCR sheets described 1,172 THs across 296 of the 476 actual home games played. Of the presentations, 136 were FB injuries. Total attendance at these games was 9,855,955. Removing double-headers reduced these numbers to 1,132 patient presentations across 289 games, of which 130 (11.5%) were FB injuries. Total attendance at these games was 9,668,463. Patient age ranged from one to 91 years, and median age was 35 years; patients with FB injuries ranged from two to 91 years, and median age was 42 years. MLB #2 HCPs saw 46% males and 50% female patients.
Per the Statistical Methods section, the authors estimated the probability of a zero-injury game (MLB#1 = 0.001395; MLB#2 = 0.062228), the expected number of zero-injury games (MLB#1 = 0.535; MLB#2 = 19.2), and the expected attendance at zero-injury games (MLB#1 = 20,689; MLB#2 = 33,279).
Alternatively, MLB #3 sent eight years of summary data (2005-2012) with 16,390,659 total attendance and 5,869 total number of patients treated (PPTT = 3.6). There were 345 patients treated for FB injuries (5.9% of the total patients; PPTT = 0.21). Transportation rates across all patients was a TTHR of 0.39.
In summary, MLB #1 had 0.55 FB patients per game (0.23 PPTT) and MLB #2 had 0.42 FB patients per game (0.13 PPTT). In practical terms, these data suggest that a FB injures someone seriously enough to seek medical attention approximately every other ball game and sends a fan to a hospital every 20-40 games. Furthermore, FB injuries will account for approximately 5.2% of all injured fans compared to non-FB traumatic cases at 42%-49%.
Discussion
Ballparks are aware of FB injuries and potential medical consequences for fans. Most (80%) fans are treated by on-site HCPs with the minority (6.1%) requiring hospital transport. Reference Fried and Ammon13,Reference Ma, Pirrallo and Rubin14 On average, 0.55 FB injuries per game lead to a first-aid center presentation and 0.42 FB injuries per game required hospital transportation. This translates to 5.2% of fan presentations (MLB#1-#3) were due to FB injuries.
Table 3 and Table 4 describe the distribution of diagnoses, treatments, and dispositions. When compared to patrons suffering other non-FB traumatic injuries, FB injured fans required higher levels of care, more frequent hospital transportations, but also refused medical attention more regularly. Nonetheless, though, despite FB injuries frequently requiring non-narcotic analgesics, most were overwhelmingly minor, and people returned to the event after treatment. In a past study, the majority of people injured by a FB also only required minor or basic care. Reference Milsten, Maguire, Bissell and Seaman15 A greater proportion of FB injured fans suffered contusions or head injuries. Finally, FB injured fans were hit in the face and head most commonly, then abdomen and upper extremity.
Table 3. Comparison of Summary Data: FB versus Trauma

Note: Trauma injuries do not include FB numbers. The 26.9% of MLB #2 FB injured who refused transport was most likely falsely elevated because MLB #2 only provided ambulance run sheets. These types of patient care sheets are used by prehospital providers who are trained to have a patient “sign a refusal” if they do not want to be transported to a hospital. Can’t compare Column 1 and Column 2 in disposition category. Why is FB category so well documented? Medical-legal reasons?
Abbreviations: FB, foul ball; MLB, Major League Baseball.
Table 4. Comparison of Summary Data: FB versus Trauma
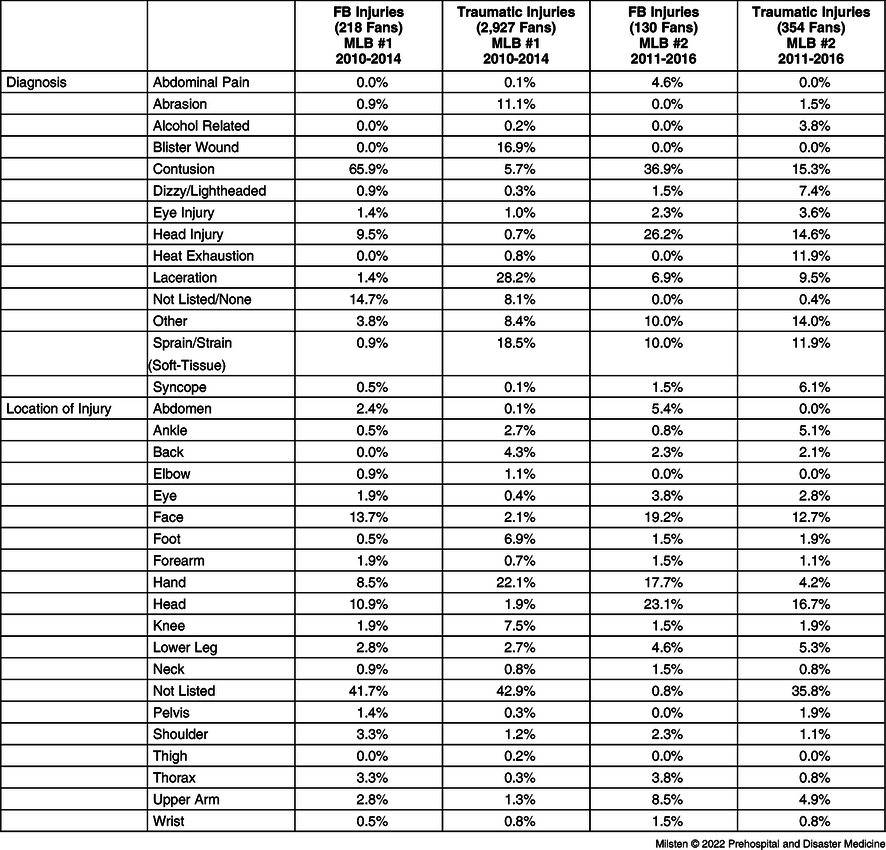
Note: Trauma injuries do not include FB numbers. For the sake of brevity, less common diagnoses (<1%) were combined into “Other.”
Abbreviations: FB, foul ball; MLB, Major League Baseball.
If the stands are packed, are spectators more likely to be hit by a foul ball? Surprisingly, this does not seem to be the case. Performing a Poisson regression on PP counts for both MLB#1 and MLB#2 using log(attendance) as an exogenous variable yields P values for the beta coefficients of 0.209 and 0.252, respectively; this suggests that attendance was not a strong predictor of FB risk. For non-FB related traumatic injuries, on the other hand, attendance was highly predictive, with P = 0.000 in both cases. The authors hypothesize that as attendance increases, the bleachers fill up, but foul balls may be less likely to reach those areas. More broadly, this result suggests that risk should be measured per game (PPG/THG) rather than per spectator (PPTT/TTHR).
It is widely assumed that netting reduces FB injuries. The netting coverage during the study was estimated as MLB #1 = 3,021 ft², MLB #2 = 3,500 ft², and MLB #3 = 2,981.40 ft². 9,10 The amount of stadium netting increased in 2016 in response to a 2014 Bloomberg article. Reference Glovin4 This study’s netting estimates are pre-2016 and too close in size to be able to draw statistical conclusions. However, Korean baseball stadiums have nearly twice the netting (6,125 ft Reference Ward2 estimated) but a similar rate of FB injury (PPTT 0.38; Table 1). Reference Glovin4,Reference Oh, Kim, Jo and Sung6,Reference Anderson16–Reference W.22
There is more to the FB story than just netting as fan distraction may be another factor. This phenomenon has been reported in the lay-press and during successful lawsuits against MLB. Reference Tak, Nguyen, Enoch and Lehren5,Reference Ransom23–Reference Kastenburg27 MLB #1 FB injuries increased over the years studied (Figure 1). To rule out confounding factors, the rate of non-FB traumatic injuries was displayed, which remained constant. The timing of this phenomenon aligns with the sudden increase in popularity of smartphones in the United States. 28 It was not possible to draw conclusions from a single MLB team’s data, but by examining multiple MLB teams in the same time period, future work could examine whether smartphone usage and any concomitant distraction correlated with increased FB injuries.

Figure 1. Foul Ball (FB) and Non-FB Injury Rates Across Time.
Limitations
The biggest limitations were incomplete data and MLB stadium information. Despite multiple attempts, first-aid operational details could not be obtained. Absent operational details, it could not be determined if FB cases could have been ignored, but this situation seems unlikely given the medico-legal nature of these injuries.
MLB #1 provided only first-aid room log sheets and MLB #2 provided EMS PCRs with unusable and incomplete first-aid log sheets. The lack of data was most evident for MLB #2, which may have produced an under-count of the PPs. MLB#2 provided an implausibly small number of first-aid log sheets, and the operative assumption was that EMS PCRs were filled out every time an HCP encountered an injured fan.
Because only two MLB teams provided sufficient data for a full statistical analysis, team-specific effects could not clearly be identified. For example, understanding which factors most influence injury rates (ie, netting, lighting, seating, density, or distractions) would require a comparison across a larger number of stadiums.
Poor documentation, a known issue at mass gatherings, occurred here as well, especially on the MLB #2 PCR. Reference Milsten, Seaman, Liu, Bissell and Maguire7,Reference Sanders, Criss, Steckl, Meislin, Raife and Allen29 With MLB #2 providing only PCRs, that could bias the data towards a worse subset of injuries.
Conclusion
This introductory study produced data suggesting roughly every two or three MLB games, a FB causes an injury that requires medical attention. This rate is high enough to warrant attention but less frequent than other combined traumatic injuries.
Assessing the risk to fans from FBs remains difficult because of the adversarial nature of the data collection. With transparent and uniform data collection, researchers could rapidly and confidently answer basic risk questions and help guide public policy towards safer stadiums.
Conflicts of interest/funding
None declared.
Acknowledgements
Karl R. Knaub, PhD - Applied Mathematics, University of Washington. Co-Founder and Principal Data Scientist, Mirabolic Consulting.


