


Introduction
Road traffic collisions (RTCs) are the leading cause of preventable death among those aged 15-29 years world-wide. The World Health Organization (WHO; Geneva, Switzerland) reports more than 1.2 million deaths on the roads each year, with 90% of these deaths occurring in low-to-middle-income countries (LMICs).1 To improve this situation, the General Assembly of the United Nations (UN; New York USA) proclaimed 2011-2020 as the “Decade of Action for Road Safety,” with the objective of stabilizing and then reducing deaths by 50% world-wide.2 The WHO encouraged countries to base their national and local actions on five pillars: road safety management, safer roads and mobility, safer vehicles, safer road users, and finally, post-crash response.3 In this context, the Government of Colombia established the National Road Safety Plan (PNSV) for the period 2011-2021.4,5
Colombia is the fourth largest country in South America, located in the northwest corner and extending for 1.14 million square kilometers with the Andes Mountains crossing the country northbound.Reference Thomson6 In 2017, Colombia had an estimated population of 49.07 million people, and a gross national income per capita of US$5,830,7 making it an upper middle-income country as defined by the World Bank Group (WBG; Washington, DC USA).8
In 2017, 6,754 people reportedly died (a rate of 13.8 per 100,000 inhabitants) and 40,115 people were injured due to RTCs in Colombia. This makes RTCs the second most common cause of traumatic death in the country after homicides, with an estimated 210,891 life-years lost due to RTCs.9 Statistics from the National Observatory for Road Safety (ONSV; Bogotá, Colombia) demonstrate that 97% of RTCs are directly related to the behavior of road users, and only three percent are attributable to road conditions and mechanical failures.10
In Colombia, several institutions work in the development of road safety laws (RSLs). The Ministry of Transportation (Bogotá, Colombia) is responsible for formulating policies, programs, projects, and economic regulation pertaining to transport, transit, and infrastructure.11 The National Road Safety Agency (ANSV; Bogotá, Colombia) enacts such policies through administrative, educational, and operational actions, raising awareness within the population and integrating them inside the culture.12 Additionally, their goals are aided by the National Institute of Legal Medicine and Forensic Sciences (INMLCF; Bogotá, Colombia), a public establishment of scientific-technical reference that provides forensic services to the community and gathers data related to RTC deaths and injuries.11
In 2002, a Transit Code was enacted.13 This Code established norms for the nation regulating the circulation of pedestrians, passengers, drivers, motorcyclists, cyclists, traffic agents, and vehicles through public or private thoroughfares, as well as the action and procedures of the transit authorities. There have continued to be modifications to this Code in the intervening years.
Colombian PNSV was developed by consensus of a panel of experts led by the Ministry of Transport and invited members from the public, private, and academic sectors. The outcome document was published on the Ministry’s website to seek comments from the general public. The PNSV took into account previous legislation, recommendations from the WHO, and international experience. The result was a ten-year plan based on five pillars, including institutional management, human behavior, victim attention and rehabilitation, infrastructure, and safer vehicles. The primary objective of the plan was to reduce by a 26% RTC fatalities by the year 2021.14
The PNSV established guidelines for the development or modification of RSLs which would affect the behavioral risk factors identified as contributing to RTCs. The WHO specifically identifies speeding, driving while intoxicated, and lack of motorcycle helmets/seat belts or child restraints.3 Focusing on these led to the development of new traffic regulations, and improvement of those existing. Subsequently, current legislation states a maximum speed limit on urban roads of 60km/hour, but is 30km/hour in school zones and residential areas. For national primary and secondary roads, the limit is 100km/hr.13,15 Intoxicated driving laws established four blood alcohol levels (Grade 0-3). Grade 0 applies to a blood ethanol of 20-39mg/100ml, Grade 1 applies up to 99mg/100ml, Grade 2 up to 149mg/100ml, and Grade 3 applies from 150mg/100ml up. Penalties apply beginning at Grade 0.13,16 Motorcycle helmet laws mandate the use of helmets by drivers and passengers, requiring them to be fastened, and defines the technical standards for a helmet to be safe.13,17,18 Seatbelt laws introduced applied to both front and rear seat occupants, prohibiting front seat use by children under 11 years old, and requiring child restraint systems for children up to two years old.13,19 Legislation has been passed prohibiting hand-held mobile phone use while driving, though they do not apply to the use of hands-free accessories.13,20 Laws concerning student drivers and the application of penalty points for transgressors are still in the drafting phase.21-24
Although in Colombia some RSLs went into effect several years ago, their influence on the incidence of RTC fatalities and injuries has not yet been evaluated. Given this, there was a need to inspect whether such RSLs have had an effect, immediate and/or sustained, on road safety.
Methods
This is a retrospective, observational study of quantitative, longitudinal outcomes of RTCs in Colombia, and their temporal relation to RSLs. Data were retrieved from governmental agencies including the INMLCF, the National Administrative Department of Statistics (DANE; Bogotá, Colombia), and the Single National Transit Register (RUNT; Bogotá, Colombia). Information regarding RTC deaths and injuries are publicly available online via the INMLCF.25 Population data of the country for every year came from DANE,26 and vehicle registration numbers were provided in a Microsoft Excel spreadsheet Version 16.21 (Microsoft Corporation; Redmond, Washington USA) via email request from the RUNT. The total period defined for analysis extended from January 1, 2001 through December 31, 2017.
Three periods were considered for analysis. The first from 2001 through 2010, encompassing the Transit Code enacted in 2002. The second from 2011 through 2017, including the time period of the PNSV (2011-2021). The final was from 2001 until 2017, constituting the complete study period, evaluating overall outcomes of all RSLs enacted on RTC deaths and injuries. The RSLs analyzed included speeding, driving while intoxicated, use of motorcycle helmets, mobile phones, seat belts, and child restraints. Beth Israel Deaconess Medical Center (Boston, Massachusetts USA) Internal Review Board approval was not required for this research as the study used publicly available, country-level, de-identified data.
Data were entered into a Microsoft Excel spreadsheet. The following analysis were undertaken: total number of RTC-related casualties, deaths, and injuries for the 17 years; percentage change from the baseline; and annual percentage change. The rates of death and injury per 100,000 inhabitants, and per 10,000 registered vehicles, respectively, were calculated based on data from the DANE and the RUNT. Percentage change from baseline and year-to-year were also calculated for these data sets. Trends in all variables were graphically displayed with relation to dates of changes made in RSLs and analyzed for each period.
Results
Figure 1 summarizes the total 810,503 RTC-related casualties recorded in the 17 years of the study. These casualties encompassed 102,723 deaths (12.7%) and 707,778 injuries (87.3%).

Figure 1. The Total Number of Road Traffic Collision (RTC)-Related Casualties from 2001 until 2017 and their Representative Number and Percentages in Deaths and Injuries.
Transit Code Period (2001-2010)
Figure 2 shows the trends in RTC casualties for the Transit Code period. During these ten years, annual casualty numbers decreased from 53,493 in 2001 and reached their lowest point of 41,397 in 2004. Subsequently, casualty numbers pointed to 51,558 in 2008, declining to 45,022 casualties in 2010, baring a 15.8% decrease in total casualties between 2001 and 2010.

Figure 2. Trends in Road Traffic Collision (RTC) Casualties for the Period of the Transit Code from 2001 until 2010.
Yearly rate of deaths dropped from 6,346 in 2001 to reach 5,418 in 2005. Subsequently, the number of deaths increased again to 5,796 in 2009 and stabilized at 5,704 in 2010. This gives an overall 10.1% decline in the number of deaths during this period.
Figure 2 shows the trend in numbers injured following a similar pattern to the trend in the number of casualties. It started at 47,148 in 2001, decreased to 35,914 in 2004, then rose again to 45,888 in 2008, and ended at 39,318 in 2010. This gives an overall 16.6% decline in the number of injuries during this period.
Figure 3 shows the trends in RTC casualty rates per 100,000 inhabitants for the period of the Transit Code. There was an overall decrease over time, though the year-to-year trends varied. Casualty rates overall dropped from 131/100,000 in 2001 to 99 in 2010, a 24.4% reduction. Death rates dropped from 15.5/100,000 in 2001 to 12.5 in 2010, a 19.4% decrease. Moreover, injury rates reduced from 116 in 2001 to 86 in 2010, a 25.8% decline per 100,000 inhabitants.

Figure 3. Trends in Road Traffic Collision (RTC) Casualty Rates per 100,000 Inhabitants for the Period of the Transit Code from 2001 until 2010.
Figure 4 shows the trends in RTC casualty rates per 10,000 registered vehicles for the period of the Transit Code, demonstrating a decline in the rates until 2006 where it reached a nadir. Casualty rates per 10,000 registered vehicles reduced from 3,965 in 2001 to 668 in 2010, an 83.2% reduction. Death rates declined from 470 in 2001 to 85 in 2010 per 10,000 registered, an 81.9% decrease. Injury rates went from 3,495 in 2001 to 483 in 2010, a reduction of 86.2%.

Figure 4. Trends in Road Traffic Collision (RTC) Casualty Rates per 10,000 Registered Vehicles for the Period of the Transit Code from 2001 until 2010.
PNSV Period (2011-2017)
Figure 5 shows the trends in RTC casualties for the PNSV period. During these seven years, total casualties decreased from 46,598 in 2011, reaching 45,592 in 2012. Subsequently, numbers started to climb again to 52,690 in 2015, plateauing at 52,536 in 2016, and declining to 46,869 in 2017, an overall 0.6% increase in total casualties.
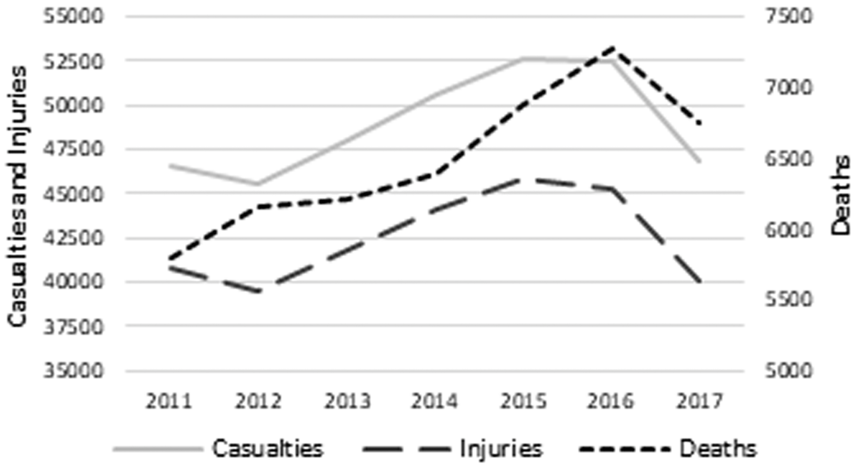
Figure 5. Trends in Road Traffic Collision (RTC) Casualties for the Period of the PNSV from 2011 until 2017.
The number of deaths had a similar trend to total casualties. An increase occurred from 5,792 in 2011 to 7,280 in 2016 reaching their highest point, followed by a decrease to 6,754 in 2017, an overall increase of 16.6% in deaths this period.
The trend in the number of injuries obeys a similar pattern to the trend in the number of casualties. Injury figures began at 40,806 in 2011, reaching their lowest (39,440) in 2012, then increased to 45,806 in 2015, plateaued at 45,256 in 2016, and subsequently decreased to 40,115 in 2017, an overall decrease of 1.7% in total yearly injury figures.
Figure 6 shows the trends in RTC casualties, deaths, and injuries rates per 100,000 inhabitants, with minimal changes in casualties and injuries. Casualty rates went from 101 in 2011 to 95 in 2017, a 5.9% reduction. Death rates went from 12.5 in 2011 to 13.7 in 2017, increasing by 8.8%. Injury rates went from 88.6 in 2011 to 81.3 in 2017, dropping by 8.2%.

Figure 6. Trends in Road Traffic Collision (RTC) Casualty Rates per 100,000 Inhabitants for the Period of the PNSV from 2011 until 2017.
Figure 7 shows the trends in RTC casualty rates per 10,000 registered vehicles, revealing an increase in all three data trend-lines. Casualty rates went from 544 in 2011 to 620 in 2017, a 13.9% increase. Death rates went from 68 in 2011 to 89 in 2017, a 30.9% rise. Finally, injury rates went from 477 in 2011 to 530 in 2017, an 11.1% increase.
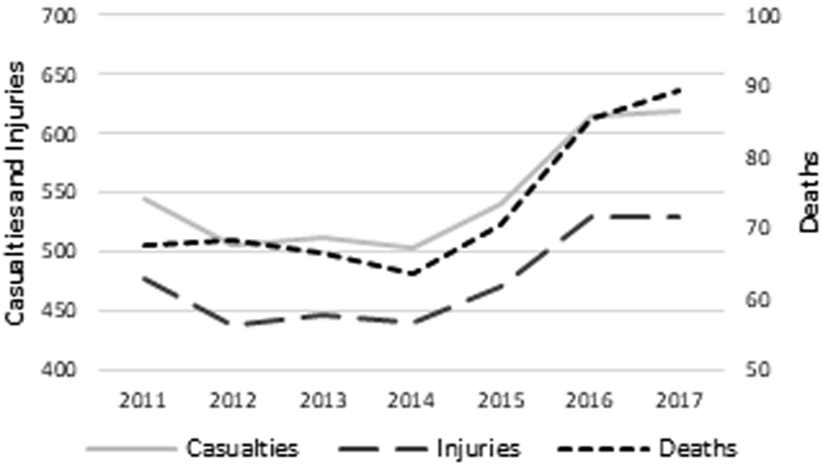
Figure 7. Trends in Road Traffic Collision (RTC) Casualty Rates per 10,000 Registered Vehicles for the Period of the PNSV from 2011 until 2017.
Full Study Period (2001-2017)
During the 17 years studied, the population of Colombia grew approximately 21% and the number of newly registered vehicles per year grew 461%. Changes in the number of casualties, the casualty rates per 100,000 inhabitants, and 10,000 vehicles for this period can be seen in Figure 8, Figure 9, and Figure 10.

Figure 8. Change in the Number of Casualties for the Full Study Period from 2001 until 2017.
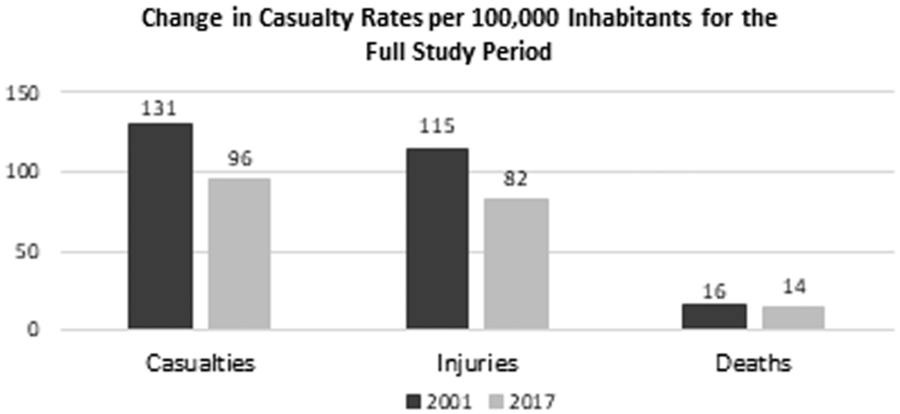
Figure 9. Change in Casualty Rates per 100,000 Inhabitants for the Full Study Period from 2001 until 2017.

Figure 10. Change in Casualty Rates per 10,000 Registered Vehicles for the Full Study Period from 2001 until 2017.
For the baseline year of 2001, the total number of casualties was 53,494. Rates per 100,000 inhabitants and per 10,000 registered vehicles were 131 and 3,965, respectively. At the end of this period in 2017, total casualties were 46,869, with rates for casualties per 100,000 inhabitants and per 10,000 registered vehicles of 95 and 620, respectively, representing a 12.4% reduction in the total number of casualties, a 27.5% reduction in the casualty rate per 100,000 inhabitants, and an 84.4% reduction in the rate per 10,000 registered vehicles.
When it comes to deaths, in 2001, there were 6,346 with rates per 100,000 inhabitants and per 10,000 registered vehicles of 16 and 470, respectively. In 2017, there were 6,754 deaths with rates per 100,000 inhabitants and per 10,000 registered vehicles of 14 and 89, respectively. This showed a 6.4% increase in the number of total deaths, but an 12.5% reduction in the rate per 100,000 inhabitants, and an 81.1% reduction in the rate per 10,000 registered vehicles.
With respect to the number of injuries in 2001, at the beginning of the study period, there were 47,148 injuries with rates per 100,000 inhabitants and per 10,000 registered vehicles of 115 and 3,495, respectively. In 2017, there were 40,115 injuries with rates per 100,000 inhabitants and per 10,000 registered vehicles of 82 and 530, respectively. This displayed a 14.9% reduction in the total number of injuries, a 28.7% reduction in the rate per 100,000 inhabitants, and an 84.8% reduction in the rate per 10,000 registered vehicles.
Impact of Road Safety Laws (RSL)
Table 1 details each year an RSL was enacted or modified in Colombia and the change in the next full year in the numbers of casualties, deaths, injuries, and rates per 100,000 inhabitants and 10,000 registered vehicles. Before enacting the Transit Code, in 2001, the number of deaths were 6,346; subsequently, in 2003, the number of deaths were 5,632, an 11.3% reduction in the number of deaths.
Table 1. Impact of Road Safety Laws in Colombia in the Number of Casualties and Rates per 100,000 Inhabitants and 10,000 Registered Vehicles (↓ Decrease; ↑ Increase)

In 2004, motorcycle helmet regulation use was introduced. After that, the number of casualties and injuries in 2005 increased by 3.7% and 4.9%, respectively, in comparison to 2003, but the number of deaths and the death rate per 100,000 inhabitants reduced by 3.8% and 6.1%, respectively.
In 2008, the speed limit law was modified, and contrary to trends after the regulation of motorcycle helmets, the number of casualties and injuries reduced by 10.7% and 12.4%, respectively, but the number of deaths increased by 2.7%, and the death rate per 100,000 inhabitants increased by 0.3% from 2007 to 2009.
In 2010, blood alcohol levels and penalties for driving while intoxicated were modified. In 2011, casualties and injuries increased by 3.6% and 4.2%, respectively, and deaths had a 0.1% decrease when compared to 2009. Then in 2013, the aforementioned law was modified again, and for the year 2014, only the death rate per 10,000 vehicles showed a decline when compared to 2012.
Discussion
The results reveal an interesting correlation not perceived previously between RSLs enacted in Colombia and RTC fatalities and injuries. At the end of the 17 years examined in this study, there was an increase in the total number of deaths from RTC. However, other outcomes, such as the total number of casualties, injuries, and rates per 100,000 inhabitants and 10,000 registered vehicles, decreased considerably. These findings suggest that such laws have been impacting deaths numbers positively, but this effect has been overshadowed by the substantial growth in population and driving in the country.
According to the data collected, there was a major improvement in total casualties and deaths during the Transit Code Period, with the lowest number of casualties and deaths happening between 2004-2005. By the end of this period, rates per 100,000 inhabitants and 10,000 vehicles decreased also. These outcomes reflect the code that encompasses laws increasing safety on multiple fronts, such as speed limits, intoxicated driving, motorcycle helmet use, seatbelt and child restrain use, and mobile phone use.19
For the PNSV period, the results are not as satisfactory concerning total numbers of casualties and deaths. On the other hand, the death and injury rates per 100,000 inhabitants and 10,000 vehicles changed in a much more complex manner. Rates per 100,000 inhabitants differ from the Transit Code period showing an increase in deaths, and a decrease in injuries and total casualties. Likewise, death, injuries, and total casualty rates per 10,000 vehicles increased.
One of the possible reasons for this trend is the increased motorization in Colombia, specifically the number of motorcycles. Given the information provided by the National Association of Businessmen of Colombia (ANDI; Bogotá, Colombia), the number of motorcycles escalated from 1.27 million in 2002 to 7.25 million in 2016, representing 56.2% of the total registered vehicles. This increase of motorcycles specifically intensifies post-2010. Such increases resulted in the presence of one motorcycle for every seven inhabitants of the country by 2016.27 This also led to 51.5% of RTC deaths and 57.1% of injuries occurring in motorcycle users.25
The phenomena of increased motorization could account for the difference between the results of the Transit Code and the PNSV periods, respectively. A greater number of vehicles and drivers on the streets may increase the overall probability of being involved in an RTC as a driver, as well as greater vulnerability to pedestrians and other road users. Motorcyclists represent one of the most vulnerable road users, not only by being less visible, but additionally they share space with heavier vehicles travelling at high speeds. When motorcyclists are involved in RTCs, they are more prone to severe injury and death because they are more exposed.1
When these data are analyzed in the setting of each RSL put into place in Colombia, new trends appear. The most impactful intervention was the establishment of the Transit Code in 2002,13 reducing the total number of casualties, death, and injuries, and also the rates per person and per registered vehicles. This was a large, comprehensive code touching on multiple facets of road safety.
Regulation of motorcycle helmet use introduced in 200417 led to a decrease in the number of deaths, although the total number of injuries increased. Multiple studies have demonstrated that adequate helmet use reduces the risk of death and head injury among motorcyclists, while there are conflicting data concerning their protective effect on cervical spine injuries.Reference Liu, Ivers, Norton, Boufous, Blows and Lo28-Reference Parka, Shinb and Kima30 One hypothesis for the disparity among deaths and injuries after this intervention is that motorcyclists wearing helmets drive less carefully in a psychological phenomenon called “risk compensation;” but this theory has not been strongly proven. One study determined that increased driving distance per year is the only risk compensation behavior that motorcyclist engage in when wearing helmets.Reference Ouellet31
Furthermore, the 2008 modification of speed limits32 had converse results to the helmet regulation. There was a reduction in the number of casualties and injuries. However, the rates per vehicle increased because while the law was being modified, the number of deaths increased by 2.7% from 2007 (5,642) to 2009 (5,796), and the number of total registered vehicles reduced by 32.8% from 2007 (726,155) to 2009 (488,012). This phenomenon exposes the economic slowdown of the country in 2008, difficulties of buyers accessing credit, effect of higher unemployment rates, restrictions on the circulation of motorcycles, and also the stagnation and deceleration of the motorcycle manufacturing sector in Colombia related to the global economic crisis of 2009.27 Drunk driving laws were modified further in 2010 and 2013,16,20 and each time there was no improvement in the number of deaths and injuries nor in the rates per inhabitants. Possible reasons for these outcomes have already been considered, but not completely addressed by the Government of Colombia. These reasons include unsuccessful implementation and enforcement of the RSLs at the local and national levels, insufficient monitoring and evaluation due to limited economic and institutional capacity, and poor human resource training.14
Any approach that could decrease the number of RTC deaths and injuries in the country must start with the understanding that RTCs are not random events. Each RTC occurs due to singular or multiple system failures, whether operator error, mechanical malfunction, roadway technical engineering issue, or other systemic problem. Therefore, data collection must be improved to perform high-quality research focused on risk factors, collision preventive interventions, evaluation of such interventions, and promotion and implementation of protective factors. Then, a public health perspective should be added to the current legislative and infrastructural emphasis. In the United States, this approach resulted in the creation of the National Highway Traffic Safety Administration (NHTSA; Washington, DC USA) in 1970.
Moreover, inaccuracies related to patient management and system difficulties can be associated with 89% of deaths occurring in RTCs.Reference McDermott, Cooper, Hogan, Cordner and Tremayne33 The improvement of the post-crash response becomes another concern to be addressed. Routine usage of proficiently trained prehospital care providers becomes a pivotal component to lower death rates; they should apply standardized protocols, as prehospital trauma life support (PHTLS), to identify and initiate management of hemodynamic instable patients and those with evident hemorrhage at the crash scene and during transportation.Reference Arreola-Risa, Mock and Lojero-Wheatly34,Reference Talving, Pålstedt and Riddez35 Structural enhancement of an Emergency Medical Services system accountable for the efficient referral of patients to the appropriate institution can further minimize the number of deaths through judicious trauma bypass protocols.Reference Vaid36,37
Once patients arrive at a trauma receiving hospital, a systematic clinical evaluation provided by Emergency Medicine (EM) residency trained physicians, in addition to Trauma Surgery, could improve further patient mortality outcomes.Reference Aluisio, Barry and Martin38,Reference McLaughlin, Blow, Herrick and Richman39 In Colombia, the first EM residency program emerged as recently as 1996, but it was not until 2005 that the Colombian Ministry of Health (Bogotá, Colombia) recognized EM as a specialty. This led to seven residency programs and several EM specialists serving in leadership roles in hospitals as medical directors, and at universities as program directors. Despite this, there is not a law stating that emergency departments (EDs) should preferably be staffed with EM specialists, potentially affecting the quality of care provided to RTC patients.Reference Arbelaez and Patino40,Reference Patiño, Alcalde and Gutierrez41 Other ED staff, including nurses, should be trained in trauma care also.
The aforementioned measures could upgrade trauma patient standards of care and reduce injury mortality rates due to RTC in LMICs. If the gap between LMICs and high-income countries could be bridged, approximately 540,000 lives could be saved annually.Reference Kotagal, Agarwal-Harding, Mock, Quansah, Arreola-Risa and Meara42 The implementation of quality improvement programs also plays a role in the successful treatment of RTC victims.Reference Juillard, Mock, Goosen, Joshipura and Civil43
Other interventions to be considered include the application of a license penalty points system for transgressions,Reference Zambon, Fedeli and Visentin44 the development of safety barriers to protect motorcyclists, the implementation of strategies to separate motorized and non-motorized road users in places with a high collision incidence,Reference Constant and Lagarde45 and promoting use of public transportation.Reference Patrick, Jillian, Félix, François and Jocelyn46
Limitations
At the outset, the number of casualties reported by INMLCF does not represent the total number of RTCs, given that RTCs without casualties are not recorded by this agency. Further studies should include data from the ANSV, which may be a more reliable source of information regarding the total number of RTCs. Nevertheless, the objective of this study is to evaluate the impact of RSLs on fatalities and injuries rather than the number of RTCs.
Second, there is likely some under-reporting of RTC injuries. The number of deaths and injuries were retrieved from the INMLCF, thus data available only represent the cases evaluated by this institution, excluding cases presented in some hospitals nation-wide, but which were not reported to the INMLCF. These other cases could be found through the Ministry of Health, but at the risk of duplicate data entry.
Third, although the RSLs are applied nation-wide, their enforcement in regional jurisdictions and municipalities vary due to geographical, meteorological, economic, social, demographic conditions, and also the level of education of the drivers. This leads to the likelihood that outcomes with respect to fatalities and injuries would be different if subset analysis were performed regionally.
Fourth, improvements in vehicle design, road infrastructure, and prehospital emergency care could have altered not only exposure to RTCs through the years, but also survival and mortality data over almost a two-decade period. Due to difficulty collecting data regarding specific vehicle protective modifications developed during the study period, this confounder was unable to be included in the data analysis of this study. To better understand the impact of each RSL on deaths and injuries, an attribution of the reason for the RTCs should be performed in future data collection.
Conclusion
In Colombia, RTC is still the second most common cause of preventable death. In the past 17 years, the country has worked consistently to achieve a reduction in the number of deaths with some success. However, RSLs enacted in the country do not seem to be sufficient to achieve the stated goal of reducing the number of deaths by 26% by 2021. The growth in population and motorization in the country might have outpaced the beneficial impact of RSLs, making the use of rates per 100,000 inhabitants and 10,000 registered vehicles more reliable indicators to measure the success of such laws. Further investigation to address this hypothesis should be made.
Education of the Colombian population on road safety, the enforcement of the established laws, and the design of new regulations and strategies should be put in place to reduce the morbidity and mortality of vulnerable road users, which remains a challenge in the country.
Acknowledgements
First of all, the authors would like to thank the Fellowship in Disaster Medicine of the Beth Israel Deaconess Medical Center for their academic support and observations in the development of this research. They also thank Dr. Maria Victoria Escobar for her key insights in writing this article.
Preliminary data of this study have been presented as an oral abstract presentation at the WADEM Congress on Disaster and Emergency Medicine; Brisbane, Queensland, Australia; May 07, 2019.
Conflicts of interest
The authors declare that there are no financial conflicts of interest to disclose.


