


Introduction
In the current nationwide Fire/Emergency Medical Services (EMS) model, including urban, suburban, and rural agencies, most EMS responses originate from a stationary location (ie, firehouse or other municipal building location).Reference Daberkow 1 When an EMS incident is dispatched, ambulances/fire apparatus typically respond from these static locations. This study evaluated an integrated urban Fire/EMS system and analyzed response times with and without a quick response vehicle (QRV).
This study was conducted in an urban Fire/EMS Department (Colonial Heights, Virginia USA) with an annual call volume of 4,647 in 2012, and a total land area of 20 km2 (7.8 m2) with more than 70% (3,261) of the total incident responses for EMS. The department integrates Fire and EMS operations into one organization. The department has two stations staffed by three platoons that work 24 hours each shift. During each shift, three fire units and three ambulances are cross-staffed by the same personnel. In the current integrated system, an enhanced 911 (E911) dispatch is used to prioritize response and the amount and type of apparatus that responds to emergency incidents.
Emergency Medical Services incident locations are logged by six distinctive geocodes which subdivide the city into northeast, north central, northwest, southwest, south central, and southeast regions. Call volume in these six distinctive geocodes in 2012 were: 10.79% (352), 28.8% (939), 9.70% (316), 11.92% (389), 26.06% (850), and 12.73% (415), respectfully. Of the 3,261 EMS incidents, Advanced Life Support (ALS) care was administered on 2,492 (76.42%) incidents. The average citywide patient contact response time was 5.44 minutes (95% CI, 2.23 minutes - 2.33 minutes).
The purpose of this study was to evaluate whether response times would be reduced by utilizing a QRV in an integrated Fire/EMS system.
Materials and Methods
This was a prospective observational study with response times obtained by the centralized dispatch center clock that is used for all Fire and EMS responses in this locality. A 2-sided pooled t test was used to evaluate the independent variables. Raw data collected included time data only and did not contain any patient information or personal health identifiers. An ALS QRV was staffed Monday through Friday from 8:00 am until 5:00 pm for a 2-month period (December 3, 2012 through February 3, 2013). It was staffed with one ALS provider (Paramedic/Firefighter). Positioning was based on 2012 geocode data using the statistical probability of receiving an EMS incident. When a Priority One EMS incident occurred, the QRV would respond.
Based on retrospective call volume data, the north end and south end of the city have an approximate equal probability of receiving a call (49.29% vs 50.71%, respectfully). When the north end of the city received an EMS incident and required transport, the QRV would then reposition to provide coverage to that station’s area, and vice versa for south end incidents. When an event occurred in both the north and south end of the city and was without ambulance coverage, the QRV would respond citywide until mutual aid arrived. If a fire or major incident occurred, the QRV would provide ALS care, as needed, with priority given to citywide EMS incidents.
Results
The QRV responded to 73 Priority One incidents (n=73) with a system-wide average response time of 4:00 minutes. The minimum response time was 1.41 minutes and a maximum of 9.33 minutes. The standard deviation was 1.35 minutes, with a standard error of 0.11 minutes, and a 95% confidence interval of 3.38 minutes to 4.22 minutes. A 2-sided pooled t test was statistically significant (<0.0001). The without QRV group had 1,512 incidents (n=1,512) with a system-wide average response time of 5.44 minutes. The minimum response time was 0.00 minutes (this occurred when a patient would respond to a fire station and the provider would activate a response) and a maximum of 27.45 minutes (this occurred when a 911 call was dispatched to the city when the incident occurred outside the city limits). The standard deviation of this group was 2.28 minutes, with a standard error of 0.03 minutes, and a 95% confidence interval of 5.36 minutes to 5.51 minutes (Figure 1). Current SAS software (SAS Institute, Inc.; Cary, North Carolina USA) was used to analyze the data. A 2-sided pooled t test was statistically significant (<0.0001; Table 1). The difference between the system-wide average QRV group response time of 4.00 minutes and the without QRV group average response time of 5.44 minutes was a reduction of 1.44 minutes with a 95% confidence interval of 2.21 minutes to 2.34 minutes, which translated into a 26.47% reduction in response time (Table 1).
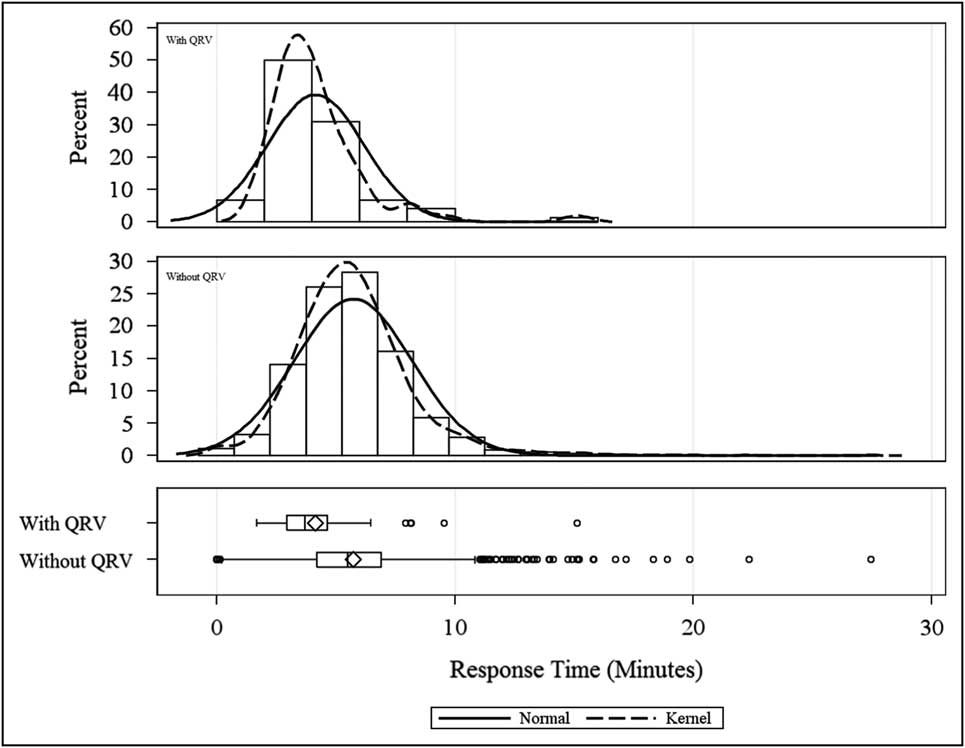
Figure 1 With QRV vs Without QRV. Abbreviation: QRV, quick response vehicle.
Table 1 Statistical Analysis

Abbreviation: QRV, quick response vehicle.
Discussion
As EMS systems continue to experience increases in call volumes, the current response model of an integrated Fire/EMS system is not designed to improve patient response times due to the fixed location of EMS and Fire resources. When infrastructure and population density changes within these communities, it may not be feasible economically to relocate such resources. Using additional resources, such as a QRV, can provide communities with medical care in an efficient manner and can be placed in areas where call volume and response times have increased. Departments typically use changes in geocode call volume data to determine where new stations will be located. The goal of these decisions is to place resources in areas that have longer response times and increases in call volume; EMS agencies are held traditionally to a response time criteria of 8.00 minutes or less for at least 90% of responses. This recommendation came from a study on nontraumatic cardiac arrests which concluded that better outcomes occurred when ALS (defibrillation) was administered within 8.00 minutes.Reference Eisenberg, Bergner and Hallstrom 2 The use of a geographic information system (GIS) to predict and determine deployment has been utilized in other EMS systems worldwide.Reference Valenzuela, Goldberg, Keeley and Criss 3 , Reference Peters and Hall 4 One such study conducted in Israel by Magen David Adom (MDA, Red Star of David) ambulances in an urban and rural district concluded by using a GIS simulation model, 94% of responses met the 8.00 minute criteria for the urban and rural area, compared to 34% (rural) and 62% (urban) not using GIS.Reference Peleg and Pliskin 5 The implementation of a QRV can increase the efficiency of the entire system by reducing average patient response times. A QRV is a tool that systems can use to improve patient contact response times in a cost-effective manner, and it has the flexibility of being able to reposition easily to other areas based on geocode predicted call volume or real-time call demand. The only similar study that has evaluated the utility of a QRV, to the authors’ knowledge, was a study performed in Taipei, Taiwan in 1998, which evaluated response times of a Basic Life Support motorcycle to an ALS ambulance. The response times of the motorcycle and ambulance were 4.9 minutes with a standard deviation of 3.0 minutes and 6.3 minutes with a standard deviation of 3.4 minutes (P<.05), respectively.Reference Lin, Chang and Shyu 6 A PubMed (National Center for Biotechnology Information; Bethesda, Maryland USA) search did not find any studies evaluating the use of a QRV compared to not having a QRV in a Fire/EMS system for response times. Other studies have evaluated patient response times on survival outcomes. One such study concluded that survival rates improved when response times were less than 5.00 minutes compared to response times greater than 5.00 minutes.Reference Blackwell and Kaufman 7 However, in Pons’ study, which evaluated impact of trauma patients with 8.00 minute response times (the traditional standard for nontraumatic cardiac arrests), they concluded there was no significant difference in survivability when evaluating response time less than 8.00 minutes compared to response times greater than 8.00 minutes.Reference Pons and Markovchick 8 When Pons evaluated response times on patient survival based on level of illness severity, a survival benefit was identified for response times less than 4.00 minutes but not when using an 8.00 minute response time cutoff.Reference Pons, Haukoos and Bludworth 9
Limitations
This study took place in a small urban Fire/EMS system with an average annual call volume of 4,647 in 2012. Other limitations of this study were that it took place over a 2-month period during the time of 8:00 am to 5:00 pm when traffic volume was the highest. Ideally, this study should be performed with 24-hour QRV coverage to further validate the finding and to evaluate variation in response times. With a citywide average response time reduction of 26.47%, it would be difficult to make the same conclusion in a rural EMS system.
Conclusion
The goal of this study was to evaluate whether patient contact response times would decrease by introduction of an ALS QRV into an integrated Fire/EMS system. In this system, in the time period studied, implementation of a QRV resulted in an average of 1.44 minutes, or 26.47%, reduction in system-wide response time for Priority One EMS incidents. Emergency resources were able to care for patients sooner by utilizing a QRV, which also provided an additional EMS provider to incidents.


