I. INTRODUCTION
Nanosheets with a broad variety of chemistries and structural motifs are becoming increasingly available as exfoliation and assembly techniques continue to mature. These novel two-dimensional (2D) materials span many broad property classes and compositions, including carbides and nitrides, chalcogenides, and oxides with flexible crystal chemistries. The combination of this flexibility and the often unique 2D behavior they exhibit has led to their use in catalysis, functional films and heterostructures, and electrochemical storage applications (Ma and Sasaki, Reference Ma and Sasaki2010; Osada and Sasaki, Reference Osada and Sasaki2012; Chhowalla et al., Reference Chhowalla, Shin, Eda, Li, Loh and Zhang2013; Gunjakar et al., Reference Gunjakar, Kim, Lee, Jo and Hwang2014).
As in many materials, understanding the defects present in nanosheet assemblies is necessary in order to tailor their properties. However, characterizing the defect population in nanosheet assemblies provides a unique challenge because of their scale and complexity. The statistical nature of both atomic and long-range defects is not captured by local structure probes; meanwhile, the tools of conventional crystallography often fail to accurately model observed data (Billinge and Levin, Reference Billinge and Levin2007). Recent work using X-ray total scattering has demonstrated that combined modeling of the powder diffraction profile and the derived pair distribution function (PDF) can provide sensitive and complementary information on both the short- and intermediate-range structure of complex disordered nanosheet systems (Manceau et al., Reference Manceau, Marcus, Grangeon, Lanson, Lanson, Gaillot, Skanthakumar and Soderholm2013). Further, because of the ensemble averaging inherent in any powder diffraction experiment, the information contained is intrinsically statistical in nature.
In this work, we demonstrate A-site substitution with Ag in the well-known Aurivillius-layered oxide Bi2CaNaNb3O12 (BCNN3). (Sugimoto et al., Reference Sugimoto, Shirata, Sugahara and Kuroda1999, Reference Sugimoto, Shirata, Kuroda and Sugahara2002) The Aurivillius structure is described as an intergrowth of perovskite blocks [A m−1B m O3m+1]−2 with m-octahedra thickness that are interleaved with fluorite structured [Bi2O2]+2 sheets (Figure 1). As described by Mallouk (Schaak and Mallouk, Reference Schaak and Mallouk2002) and others (Sugimoto et al., Reference Sugimoto, Shirata, Sugahara and Kuroda1999, Reference Sugimoto, Shirata, Kuroda and Sugahara2002), the Aurivillius structure is a candidate for ion exchange reactions that exchange the [Bi2O2]+2 interlayer for an appropriate ion – most commonly water and hydroxyl groups of some form. The resulting disordered booklet structure is amenable to exfoliation using bulky organic bases as swelling agents and by simple chemomechanical or mechanical mechanisms – we therefore consider the protonated ion-exchanged perovskite booklet a precursor to exfoliated perovskite nanosheets (Liu et al., Reference Liu, Nichols, Howe and Misture2013).
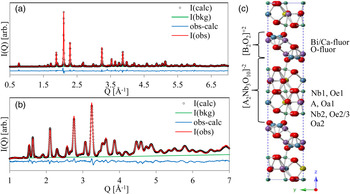
Figure 1. (Color online) Rietveld refinement of (a) APS X-ray data and (b) NOMAD bank 2 demonstrate good fit using the B2cb unit cell represented in (c).
II. EXPERIMENTAL METHODS
A. Synthesis of H y ·(Bi0.2Ca0.55Sr0.25)(Ag0.25Na0.75)Nb3O10·xH2O
Bi2(CaNa)0.75(SrAg)0.25Nb3O12 (Ag25-BCNN3) was prepared using conventional ceramic methods for materials containing volatile constituents, with guidance from an earlier synthesis of the two-layer Aurivillius Bi2.5Ag0.5Nb2O9.(Wong-Ng et al., Reference Wong-Ng, Huang, Cook, Levin, Kaduk, Mighell and Suh2004) Stoichiometric quantities of Bi2O3 (Acros; 99.9%), CaCO3 (Acros; 99+%), Na2CO3 (J.T. Baker; reagent), SrCO3 (Aesar, 99.99%), Ag2O (Mathey; 99+%), and Nb2O5 (Aesar, 99.9%) were intimately mixed under isopropanol using a vibratory mill (McCrone Micronizing Mill, MFG, USA). The resulting mixtures were dried and calcined at 750 °C in air for 6 h. The calcined powders were ground and sieved to <45 µm, pelletized, and buried in covered alumina crucibles with powder beds of like composition. The powders were then heat treated at 950 °C for 96 h in flowing oxygen.
The three-layer Aurivillius material was ion-exchanged in 6 M HCl at room temperature to form, nominally, H y ·(Bi0.2Ca0.55Sr0.25)(Ag0.25Na0.75)Nb3O10·xH2O. Two methods were used because of the differing volume of material needed for synchrotron X-ray and neutron-scattering experiments. Small quantities of ion-exchanged material were readily prepared for X-ray diffraction in 48–72 h using a large excess of acid (2 mg ml−1), with occasional stirring. Materials for neutron scattering were prepared in suspensions with higher concentration of solids (60 mg ml−1), in which we observed a markedly slower rate of ion exchange. With the assumption that ion exchange kinetics are driven at least partly by chemical gradient, acid was replaced daily. In this case, ion exchange was observed to be complete within approximately 1 week.
Completion of the ion exchange process was confirmed by observing the evolution of X-ray diffraction profiles. Upon completion, the supernatant was decanted and the powder washed twice by resuspension in deionized water, centrifuging and discarding the supernatant. The equivalence of the powders resulting from the two methods was confirmed qualitatively with laboratory X-ray diffraction. All powders for scattering analysis were dried and stored under ambient conditions.
B. Data collection and reduction at APS 11-ID-B and at SNS-1B NOMAD
X-ray diffraction and PDF data were collected at the Advanced Photon Source on beam line 11-ID-B (Argonne National Laboratory), using standard 1 mm Kapton capillaries in Debye–Scherrer geometry. Both data sets were collected using a 58.66 keV Si〈311〉 monochromated primary beam and a silicon flat plate area detector. Diffraction profiles were measured with a detector distance of 95 cm for a total Q-range of 0.4–8.5 Å−1, while PDF data were collected at 18 cm for a total Q-range of 0.4–24 Å−1. Time-of-flight (TOF) neutron scattering data were collected on the Nanoscale Ordered MAterials Diffractometer at the Spallation Neutron Source (NOMAD, SNS, Oak Ridge National Laboratory) using 3 mm glass capillaries and a 3He detector array. A more complete instrument description is published elsewhere. (Neuefeind et al., Reference Neuefeind, Feygenson, Carruth, Hoffmann and Chipley2012) All data were collected at room temperature.
Two-dimensional X-ray diffraction data were integrated to 1D using FIT2D after appropriately calibrating detector deviations from orthogonality and masking invalid pixels (Hammersley et al., Reference Hammersley, Svensson and Thompson1994, Reference Hammersley, Svensson, Hanfland, Fitch and Hausermann1996). CeO2 was used as the calibration standard for correcting detector alignment and to refine the instrumental line broadening. Data for diffraction profile analyses were corrected simply by subtraction of experimental background. PDF data were reduced using PDFgetX2, which includes the appropriate corrections for inelastic scattering and energy-dependent detector response, in addition to experimental background and absorption corrections, amongst others (Qiu et al., Reference Qiu, Thompson and Billinge2004).
Neutron scattering data for diffraction analysis were normalized and corrected bank-by-bank for experimental background, merged, and reduced to PDFs in NOMAD's data auto reduction program. Beyond the typical corrections for inelastic scattering contributions, an empirical correction to the hydrogen background present because of the interlayer water was applied (Page et al., Reference Page, White, Estell, Neder, Llobet and Proffen2011). The Q-range for the Fourier transform was restricted to 0.4–24 Å−1.
C. Analysis methods
Combined Rietveld refinement of X-ray and neutron diffraction data for the parent Aurivillius phase Ag25-BCNN3 was performed using GSAS (Larson and Von Dreele, Reference Larson and Von Dreele2004). For the X-ray data, the Caglioti parameters GU, GV, and GP describing instrumental broadening were refined using CeO2 measured under identical conditions (Caglioti et al., Reference Caglioti, Paoletti and Ricci1958). Instrument parameters for the GSAS TOF type 3 profile, based on Von Dreele et al. (Reference Von Dreele, Jorgensen and Windsor1982), were fit to NIST Si standard data (SRM640d).
X-ray and neutron PDFs were fit simultaneously over the range 1–25 Å in PDFgui (Farrow et al., Reference Farrow, Juhas, Liu, Bryndin, Božin, Bloch, Proffen and Billinge2007) using a supercell method. As a matter of convention we choose to present the neutron PDF fits throughout this paper. The perovskite slab refined from the parent Ag25-BCNN3 was used as a starting structure from which supercells with dimension 1 × 1 × N containing N = 8 sheets were created to model the influence of stacking disorder on intermediate range (1–25 Å) PDF. Sheets in these supercell structures are correlated with their neighbors by a vector:
 $${\bi R} = [R_{x_{ij}}, R_{y_{ij}}, R_{z_{ij}} ].$$
The translational components are presented in fractional coordinates referenced to the unit-cell description of the layer contents. The perpendicular component R z is reported in Å, as this value corresponds roughly with d 001. Because we have a singly defined layer content, i = j and the notation will be dropped. Further, the sheets are treated as indistinguishable – consequently we can apply translational symmetry to each atomic position in the ith sheet:
 $${\bi r}_i = {\bi r}^0 + i({\bi R} \cdot {\bi r}^0 ),\;{\rm where}\,i \in \,\,{\rm positive}\,{\rm integers,}$$
in order to reduce the number of free parameters. Likewise, identical sites within the sheet (e.g., positions of site-mixed cations) are refined equivalently. Thus, the number of position parameters in an N = 8 supercell refined with
 ${\rm P}\bar 1$
sheet symmetry is reduced from three position parameters for 310 atoms to a more manageable 29.
${\rm P}\bar 1$
sheet symmetry is reduced from three position parameters for 310 atoms to a more manageable 29.
The influence of sheet–sheet translations was explored by manually sampling the non-redundant combinations of R x and R y . Defining the matrix NT m,n containing the allowed combinations of R x and R y in a1 × 1 × N stacking model:
 $$^{\bi N} {\bi T}_{{\bi m},{\bi n}} = \left[ {\matrix{ {\left( {\displaystyle{m \over N},\displaystyle{n \over N}} \right)} & \ldots \cr \vdots & \ddots \cr}} \right]\;{\rm with}\,m,n\;{\rm integers} \le N.$$
Square symmetry (a = b) implies equivalence of the transpose:
 $$^8 {\bi T}_{{\bi m},{\bi n}}^{\quad {\rm T}} = ^8 {\bi T}_{{\bi m},{\bi n}}. $$
Further, the translational symmetry of the unit cell implies:
 $$R_x = 1 - R_x \;{\rm and}\;R_y = 1 - R_y, $$
thus restricting the unique combinations of translational vectors to elements T m,n in the first quadrant. For a 1 × 1 × 8 supercell with a single component R z , this reduces the number of test structures from 82 to 10.
I(Q) modeling of the perovskite nanosheet booklet was performed using the recursive method implemented in DIFFaX (Treacy et al., Reference Treacy, Newsam and Deem1991). The refined perovskite slab was used as a starting structure, with occupancies and isotropic thermal parameters fixed in all models at the Rietveld refined values. The stacking direction was taken as parallel to the c lattice vector of the parent structure. Several models for R x and R y were considered, but in each model identical components R z were used across all layer types. R was considered to comprise components with normally distributed fluctuations which are not correlated from transition to transition [disorder of the second type (Drits and Tchoubar, Reference Drits and Tchoubar1990)].
Crystallite size broadening in DIFFaX is both physical and empirical. Along the stacking direction the user can set the physical number of atomic layers in the crystal. Within this work, simulations were done holding the total number of layers in the crystal fixed at 60 unless otherwise noted.
Broadening owing to the crystal size in the layer plane is empirical within DIFFaX, and was not included here. Rather, a convolution with a pseudo-Voigt profile was included, with a full-width at half-maximum given by a Caglioti-type polynomial (Caglioti et al., Reference Caglioti, Paoletti and Ricci1958) with parameters [U, V, W η] = [0.000, −0.04, 0.0029, 0.5]. This is an attempt to reproduce both crystal size and instrumental broadening. While such an approximation is not ideal, it is necessary in order to compare the simulation to observed data.
DIFFaX does not include any automated refinement engine, and thus simulation parameters were optimized by hand through visual comparison in order to qualitatively reproduce primary features such as the presence and relative location of broad bands and sharp peaks. This has become common within the literature (Ramesh et al., Reference Ramesh, Jayashree and Kamath2003; Thomas e al., Reference Thomas, Rajamathi and Kamath2004; Radha et al., Reference Radha, Shivakumara and Kamath2005; Gualtieri et al., Reference Gualtieri, Ferrari, Leoni, Grathoff, Hugo, Shatnawi, Paglia and Billinge2008; Johnsen and Norby, Reference Johnsen and Norby2009; Naik et al., Reference Naik, Chalasani and Vasudevan2011) The purpose of these simulations is only to gain insight into how stacking disorder manifests in the scattered intensity.
III. RESULTS AND DISCUSSION
Development of PDF models for the ion-exchanged Ag25-BCNN3 (Ag25-BCNN3-IE) proceeded first from Rietveld analysis of the parent Aurivillius material. The integrated 2D data collected at APS 11-ID-B (0.4 < Q [Å−1] < 7) and banks 2–5 of neutron scattering data collected at NOMAD (Q [Å−1] < 9) were simultaneously refined.
The initial test structure was adapted from BCNN3 in space group B2cb (Shi, Reference Shi2015) with appropriate modification of the site occupancies (Figure 1). A shifted Chebyschev background, sample displacement error, Lorentzian size and strain broadening, and general scale factor were refined for each data set. Finally, complete positions, cation occupancies, thermal parameters, and the lattice parameters were refined, with reasonable agreement between the nominal and refined chemistry (Table I). The combined weighted residual for all five data sets was wR p = 0.0752. The fit to the X-ray data and NOMAD bank 3 are presented in Figure 1.
Table I. Refined structure of the Aurivillius material Ag25-BCNN3.

a Fixed value.
b Data collected on NOMAD.
A. X-ray and neutron PDF analysis
The influence of R z on the PDF was investigated using a 1 × 1 × 2 supercell with the perovskite structure derived from the Rietveld refinement of the Aurivillius structure in Figure 1(c). In practice, the fluorite block was removed from the Aurivillius unit cell, the c vector contracted, and the fractional coordinates of the unit cell scaled to maintain the structure of the perovskite layer. The variation of the weighted residual R w with d 001, the dimension of the perovskite layer and interlayer gallery, is presented in Figure 2(a) in the range of (0, ½, R z ) with 13.394 < R z < 14.144 Å. No structure parameters were refined in these fits- the correlated motion parameter δ1 was fixed at 1.5 Å and a general scale parameter was fixed at 0.6.

Figure 2. (Color online) (a) R w as a function of d 001 for several test structures near d min. (b) Neutron PDF for the calculated points in (a). (c) Inspection of the interlayer region for a better (left) and worse (right) fitting model. (d) R w resulting from combinations of the translational components R x and R y .
Contrasting the observed neutron PDF for Ag25-BCNN3-IE [Figure 2(b)] we can visually observe the influence of R z on the PDF. A second-order polynomial was fit to the data points in Figure 2(a), permitting estimation of the minimum R w and interpolation of the average d 001 = 13.825 Å for this stacking configuration. The value of d 001 estimated from peak position of the 001 diffracted peak is around 14.081 Å, demonstrating reasonable agreement considering that (R x , Ry ) and structure relaxation have not been taken into account.
Using the d 001 value obtained in Figure 2(a), ten 1 × 1 × 8 supercell stacking models were constructed to investigate the influence of the unique x–y translations. Assuming the orthorhombic distortion has minimal impact on the intermediate range, the sheet was treated as square-symmetric as discussed in Eqs. (3)–(5). Over the range G(1–25 Å) the a & b unit-cell parameters, the correlated motion parameter δ1, and a scale factor were first refined, followed by atomic positions according to the convention in Eq. (2). Finally, isotropic thermal displacement parameters for each site were refined.
The major conclusions of these refinements are summarized in Figures 2(c) and 2(d). A projection of the weighted residual R w (R x , Ry ) is plotted in Figure 2(d). This PDF analysis suggests the preferred intersheet translations fall in a broad basin, away from combinations of R x,y = 0 or 1/2. Inspecting the terminal oxygens of two neighboring sheets [Figure 2(c)] offers the intuitive suggestion that minimizing close-approach of neighboring terminal oxygens drives this condition. The breadth of the basin in the fit surface R w (R x , Ry ) implies a broad distribution of translational stacking vectors around (1/4, 1/4).
Discrete combinations of stacking models with R x = R y , 0 < R x,y < 0.5, were applied to approximate the distribution evidenced in Figure 2. The scale parameter of each model was fixed according to the standard normal distribution centered on R x,y = 0.25 = μ:
 $$w_i \left( {R_{x,y}} \right) = \displaystyle{N \over {\sqrt {2{\rm \pi \sigma} ^2}}} \exp \left( { - \displaystyle{1 \over 2}\left( {\displaystyle{{R_{x,y} - \mu} \over \sigma}} \right)^2} \right),$$
where σ varies as indicated in Figure 3(b). PDF scale, broadening and structure parameters were again refined, but constrained to equivalence across all weighted models. This resulted in a clear minimum in weighted residual R w(σ) shown in Figure 3(c). The distributed stacking model leads to a substantial improvement over a single-stacking model as demonstrated in Figure 3(a) (i & iii) and (ii & iv) respectively.

Figure 3. (Color online) (a) (ii) Best-fits for the neutron PDF for a single stacking model (1/4, 1/4, 13.825 Å) and (i) a distributed stacking model following the weight distribution σ = 0.125 in (b), and the associated difference curves (i–iii, ii–iv). The mean fractional coordinate for each distribution is μ = 0.25. The resulting weighted residual for various distributions in (b) are plotted in (c).
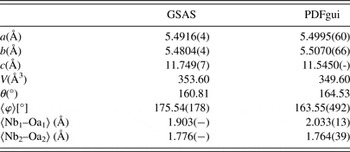
Inspection of the perovskite structure refined from GSAS and PDFgui indicate that there is relatively minor relaxation in the perovskite after ion exchange. This is demonstrated qualitatively by overlaying the refined perovskite slab from both the Aurivillius and ion-exchanged variants (Figure 4). There is a very slight 0.2 Å contraction along the c-axis, while the a–b axes remain distorted tetragonal with insignificant change (Table II). The niobium positions remain effectively unchanged; likewise the A-site remains split with the Bi site mixed cations, but doesn't change appreciably. The slight lengthening of the apical Nb–O bond of the inner NbO6, combined with the overall contraction of the perovskite along the c-axis and invariance of the cation sublattice, indicate the relaxation arises from distortion of the oxygen sublattice.

Figure 4. (Color online) (left) An overlay of Rietveld and PDF refined perovskite block indicate the cation sublattice is invariant, while the oxygen sublattice relaxes, leading (a) to NbO6 distortion (φ) and (b) to greater octahedral tilt (θ).
Table II. Select parameters highlighting the slight relaxation of the perovskite structure following the ion exchange reaction.
B. Ion exchanged I(Q) diffraction profiles
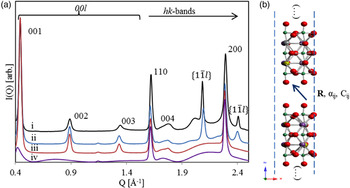
The presence of both diffuse bands and sharper peaks within the I(Q) data [Figure 5(a)] suggest significant anisotropic disruption to the periodicity of the IE phases when compared with the parent material (Drits and Tchoubar, Reference Drits and Tchoubar1990). The presence of broadened 00l (basal) series of reflections suggest that the volume weighted apparent crystallite size, or mean column length (MCL) (Langford and Wilson, Reference Langford and Wilson1978), along this direction is greater than a single atomic sheet (Minami and Ino, Reference Minami and Ino1979), but smaller than the parent structure. This hypothesis can be confirmed using DIFFaX [Figure 5(a)]; a simulation with crystal thicknesses set to one atomic sheet clearly shows complete broadening of the basal series (i), while a simulation with crystal thicknesses set to 60 atomic sheets (ii & iii) show a broadening in the 00l peaks comparable with the measured data (iv).

Figure 5. (Color online) (a) (i) Experimental data for Ag25-BCNN3-IE collected on APS 11-ID-B (λ = 0.2114 Å), and DIFFaX simulations of (ii) discrete combinations of R x = R y < 1/2, (iii) fully turbostratic and (iv) a single sheet. (b) A schematic representation of the stacking model.
The observed 00l peaks show an additional broadening component that increases with increasing scattering vector. For a plate-like morphology, the MCL shows no scattering vector dependence along the 00l direction (Langford and Louër, Reference Langford and Louër1982; Scardi and Leoni, Reference Scardi and Leoni2001), suggesting that the anisotropic broadening is not because of crystal morphology. A possible explanation is that the spacing between successive layers along the c-direction (R z ) is not well defined, or fluctuates about some mean value. This phenomena has been described (Guinier, Reference Guinier1964) and modeled previously (Drits and Tchoubar, Reference Drits and Tchoubar1990), and agrees with the expected weak or inconsistent bonding between nanosheets. Within DIFFaX, such disorder can be introduced via the so-called Fats–Waller factors, C ij , which provide anisotropic stacking vector uncertainties. The stacking vector uncertainty along the c-direction (C 33) was fixed at 10 Å2 for all simulations presented here. This value was found to reasonably reproduce the observed anisotropic broadening trend.
Sharper I(Q) features also exist at positions that coincide with hk0 peaks from the parent structure. The hk0 peaks remain sharp as they correspond to places in reciprocal space where the Ewald sphere is tangential to the Bragg rods (Ufer et al., Reference Ufer, Roth, Kleeberg, Stanjek, Dohrmann and Bergmann2004) commonly observed in structures showing extensive stacking disorder. Again assuming a platy morphology, the MCL along the in-sheet direction is largest, meaning that these peaks are least affected by any anisotropic crystal size broadening.
While it might seem intuitive that layer stacking in the a–b plane is completely turbostratic, the presence of additional sharp non-hk0/00l peaks suggests otherwise. I(Q) data from various turbostratic systems have been modeled by several authors (Ufer et al., Reference Ufer, Kleeberg and Bergmann2006; Yang and Frindt, Reference Yang and Frindt2011; Dopita et al., Reference Dopita, Rudolph and Salomon2013; Schimpf et al., Reference Schimpf, Motylenko and Rafaja2013) but are generally characterized by sharp 00l peaks and broad hk bands. These hk bands show an initial sharp hk0 peak and a shape described by the squared magnitude of the layer structure factor considering a continuous l miller index (Ufer et al., Reference Ufer, Roth, Kleeberg, Stanjek, Dohrmann and Bergmann2004). A turbostratic effect can be achieved in DIFFaX by increasing the Fats–Waller factors associated with the transverse stacking vector components (C 11 and C 22) to extremely high values [i.e. 1000 Å2, Figure 5(a) (iii)]. Such a simulation does not agree with observed I(Q) data; two additional peaks in the scattering vector range are observed at about 2.08 and 2.41 Å−1, and imply that periodicity along the associated real space directions is not affected by the stacking disorder. Mathematically, the presence of sharper non-hk0/00l peaks implies that all the dot products of the scattering vector and origin independent layer transition vectors are integers (Treacy et al.,, Reference Treacy, Newsam and Deem1991):
 $$\eqalign{{\it m} & = {\bi Q} \cdot {\bi R}_{{\bi ii}}, \quad {\it n} = {\bi Q} \cdot \left( {{\bi R}_{ij} + {\bi R}_{\,ji}} \right), \cr & \quad {\rm etc}{\rm.} \;n,m = 0,1,2, \ldots}$$
The fit surface of the PDF models [Figure 2(d)] suggest that preferred stacking vectors follow the general rule R x = R y . If this constraint is imposed, Eq. (7) dictates that the observed additional sharp peaks arise from the {11} family at scattering vector points corresponding to integer values of l. To test this hypothesis, we observed the influence on I(Q) of a number of different transitions with R x = R y (Figure 6). Each stacking vector reproduces the two additional sharp peaks that are absent from the turbostratic simulation, but also create additional broad peaks in scattering vector range 1.9–2.3 Å−1, with positions dependent on the magnitude of R x,y . This strongly implies the sample is comprised of a distribution of stacking vectors subject to the constraint R x = R y .

Figure 6. (Color online) The influence of hk-bands arising from individual stacking vectors demonstrates that the experimental data are clearly the influence of a distribution.
A final model was considered with eight distinct stacking vectors, characterized by R x = R y in the range from 0.00 to 0.4375 in steps of 1/16 of the a-axis length. The magnitude of the transition probabilities was chosen to favor the R x = R y = 0.25 stacking vector, with probabilities of [0/25, 2/25, 2/25, 4/25, 9/25, 4/25, 2/25, 2/25]. Each of these translations was assigned an equal uncertainty on R x and R y of C 11 = C 22 = 20 Å2, with C 12 = 19.999 Å2. Using this model, the a and b lattice parameters were optimized by hand, along with the R z component of the stacking vector, so as to best reproduce the approximate location of sharp features. The best values (5.5068 and 5.5107 Å for a and b, respectively, and 14.131 Å for R z ) agree reasonably well with PDF-refined values, agreeing on the trend in structural relaxation.
The final model, containing optimized lattice parameters, eight different stacking translations, and transition vector fluctuations, shows reasonable agreement with the observed data [Figure 5(a) (ii)]. The successful reproduction of the primary features confirms that layer–layer correlations are partially ordered rather than completely random, and that the crystal thickness is significantly greater than a single nanosheet. The small degree of unit-cell contraction also suggests that the fluorite-like [Bi2O2]+2 intergrowths imposes a tensile strain on the perovskite-like slabs. The estimated values e a = 0.28(−) and e b = 0.55(−)% correspond well to those surmised from the PDF model e a = 0.14(11) and e b = 0.49(12)%, where the subscript indicates the parallel unit vector.
The model could likely be substantially improved if the symmetry constrained atomic coordinates of the layer contents were optimized through least-squares minimization; as periodicity is removed the diffuse intensity distribution is more heavily influenced by the actual contents of the deterministic layer. Further, automated optimization of the crystal size and other broadening terms such as the Fats–Waller terms, could lead to an improvement in the data-model agreement and provide a degree of quantitative insight.
C. Comparison of real space and reciprocal space stacking distributions
It is plausible to assume that the mean square displacement (MSD) of any particular sheet obeys a normal distribution about its average position. Further, assuming that the position fluctuations are uncorrelated from sheet to sheet, a coherently scattering domain can be constructed from multiple sheets whose relative positions fall within a 3D Gaussian envelope. Such positional disorder is represented in DIFFaX with Debye–Waller-like parameters, C ij , while in the PDF models presented this disorder is represented by a set of discrete models.
A method of equating the physical displacements with C ij is presented in online Appendix 1. In the uncorrelated isotropic case, the simple result obtained is that the MSD and standard deviation σ are related by:
 $$\langle u^2 \rangle = \sigma^2 [\circ{\rm A}^2 ].$$
The standard deviation is normalized by the magnitude of the appropriate lattice vector to obtain the result in fractional units. Consequently, the probability distribution applied to the PDF model can be compared directly to that inferred from DIFFaX with the form of Eq. (6). These distributions are presented in Figure 7.

Figure 7. (Color online) A comparison of (a) the stacking distribution applied in the DIFFaX simulation [Figure 5(a) (ii)], (b) the PDF model for the stacking distribution [Figure 3( a) (i)], and the distribution suggested by the fit surface R w (R x , Ry ) [Figure 2(d)]. The corresponding standard deviation σ in fractional & (Å) units respectively are (a) 0.092 (0.50 Å) and (b) 0.125 (0.69 Å). The weighted residual for PDF fits using each respective distribution are (a) 0.297, (b) 0.300, and (c) 0.304.
For comparison, a normalized distribution estimated from the fit surface R w(R x , Ry ) [Figure 2(d)] by the simple form:
 $$w_i = N(R_{\rm w}^{\max} - R_{\rm w}^i ),\quad \sum\limits_i {w_i = 1} $$
is presented as well. The standard deviation along the R x = R y vector of the DIFFaX simulation (σ = 0.50 Å) is well within a factor of 2 from the value suggested in the PDF fit (σ = 0.69 Å). There is a discrepancy, however, between both normal distributions and the asymmetric, flattened or possibly bimodal distribution suggested by the distribution of Eq. (9). In this work, a normal distribution was adopted for simplicity and to provide a direct comparison with recursive reciprocal space modeling. Within the recursive approach, the normal distribution underlying these fluctuations is assumed so as to simplify the mathematics. No such constraint need be imposed on PDF models; in theory any discrete distribution could be considered with the shape of the distribution being a fitted parameter.
IV. CONCLUSIONS
We have demonstrated a systematic approach to the structural investigation of novel Ag-containing perovskite nanosheet booklets. Our results demonstrate that the pair distribution function is sufficiently sensitive to intermediate range structure to identify not only viable stacking vectors, but also viable distributions of stacking vectors. The results of the real space analysis are consistent with the results obtained from recursive method simulations of the scattered intensity.
Reciprocal space or I(Q) models are highly sensitive to anisotropic periodicity observed in cases of assembled nanosheets. Simulations can be useful to understand the structural reasons leading to continuous intensity distributions, but care must be taken to separate effects. Competing anisotropic broadening contributions from crystal size, stacking vector fluctuations, and non-deterministic (Markov) stacking can lead to many different but equally appealing models. The first goal of any application of I(Q) models should be the reproduction of primary features using the simplest model possible.
The stacking disorder present is well described by a distribution of position fluctuations centered on translations of (1/4, 1/4) with a standard deviation of σ = 0.125 in fractional units, or 0.69 Å. The criterion that R
x
= R
y
is necessary in order to reproduce the sharp
 $\{ 1\bar 11\} $
peaks observed in the diffracted intensity. Both turbostratic disorder and complete exfoliation (isolated nanosheets) have been ruled out. The local structure of perovskite sheet is observed to relax little following the ion exchange reaction. The cation sublattice appears to be nearly invariant, while the oxygen sublattice shows a subtle deformation. While this is presumably influenced by the surface environment, the present data are insufficient to make this assertion.
$\{ 1\bar 11\} $
peaks observed in the diffracted intensity. Both turbostratic disorder and complete exfoliation (isolated nanosheets) have been ruled out. The local structure of perovskite sheet is observed to relax little following the ion exchange reaction. The cation sublattice appears to be nearly invariant, while the oxygen sublattice shows a subtle deformation. While this is presumably influenced by the surface environment, the present data are insufficient to make this assertion.
As the lower limit of G(r) influenced by intermediate range structure is determined by the closest approach of neighboring sheets, we anticipate stacking disorder influences the PDF down to 3–4 Å, or approximately to the third-nearest neighbor level. Clearly, distinguishing stacking disorder of nanosheet assemblies has implications toward the confidence we can place in PDF local structure analyses. In the future, we will apply real space stacking models to the analysis of nanosheet assemblies with controlled defect populations, thereby establishing the influence of intermediate range order on our ability to precisely determine defect content in complex disordered materials.
SUPPLEMENTARY MATERIAL
The supplementary material for this article can be found at http://dx.doi.org/10.1017/S0885715616000129.
ACKNOWLEDGEMENTS
This material is based upon work supported by the National Science Foundation under Grant No. DMR-1409102. PM was partially funded by the U.S. Department of Energy (DOE) Office of Science Graduate Student Research Program, administered by the Oak Ridge Institute for Science and Education for the DOE under contract number DE-AC05-06OR23100. This research used resources of the Advanced Photon Source, a U.S. Department of Energy (DOE) Office of Science User Facility operated for the DOE Office of Science by Argonne National Laboratory under Contract No. DE-AC02-06CH11357. The portion of this research conducted at Spallation Neutron Source was sponsored by the Scientific User Facilities Division, Office of Basic Energy Sciences, U.S. Department of Energy.