


I. INTRODUCTION
Landing on other planetary surfaces is challenging, and returning samples back to Earth from another planet has yet to be achieved. Hence, to determine the material composition of the surfaces of our solar system neighbours largely depends on the analysis of reflected sunlight form their surfaces. In the search for water-containing minerals, or the characterisation of icy moon surfaces, the near-infrared (near-IR) region has been particularly invaluable. For example the Near-Infrared Mapping Spectrometer (NIMS) (Carlson et al., Reference Carlson, Weissman, Smythe and Mahoney1992), which flew on the Galileo spacecraft's tour of the Jupiter and its moons and the Visual and Infrared Mapping Spectrometer (Brown et al., Reference Brown, Baines, Bellucci, Bibring, Buratti, Capaccioni, Cerroni, Clark, Coradini, Cruikshank, Drossart, Formisano, Jaumann, Langevin, Matson, McCord, Mennella, Miller, Nelson, Nicholson, Sicardy and Sotin2004) aboard the Cassini spacecraft investigating Saturn have revealed much about these planet's icy moons. Near-IR has also been used for mapping water-containing minerals upon terrestrial planets, for instance the OMEGA instrument (Bibring et al., Reference Bibring, Soufflot, Berthé, Langevin, Gondet, Drossart, Bouyé, Combes, Puget and Semery2004) which flew aboard the European Space Agency (ESA)’s Mars Odyssey spacecraft was the first to map phyllosilicate (clay) minerals across Mars (Poulet et al., Reference Poulet, Bibring, Mustard, Gendrin, Mangold, Langevin, Arvidson, Gondet, Gomez and Berthé2005).
However, space-based missions are few and this, coupled with technological advancements, has meant that Earth-based observations of planetary surfaces are increasingly of use in determining planetary surface compositions. The wavelengths available for analysis are usually limited to transparent spectroscopic “windows” in our own atmosphere where atmospheric molecular absorption is low (Bailey et al., Reference Bailey, Simpson and Crisp2007). Observations are predominately carried out in the near-IR windows; in particular the bands centred on ~1200 nm (J-band), ~1600 nm (H-band) and ~2200 nm (K-band). For instance at the Gemini observatory's Near-Infrared integral Field Spectrograph (NIFS) (McGregor et al., Reference McGregor, Hart, Conroy, Pfitzner, Bloxham, Jones, Downing, Dawson, Young, Jarnyk, Iye and Moorwood2003) uses adaptive optics and can produce surface maps with good spatial resolution (better than 0.1 arc second) in the traditional J-, H- and K-band and has the ability to look beyond the traditional observing bands when coupled with software for removing telluric atmospheric effects (Cotton et al., Reference Cotton, Bailey and Kedziora-Chudczer2014). Such observations enable large-scale changes to be observed across these surfaces, and hence give a unique insight into the evolution of our planetary neighbours over a relatively short time-scale. Instruments such as the SINFONI spectrometer, located at the Very Large Telescope (VLT) (Eisenhauer et al., Reference Eisenhauer, Abuter, Bickert, Biancat-Marchet, Bonnet, Brynnel, Conzelmann, Delabre, Donaldson, Farinato, Iye and Moorwood2003) have even been used to map compositional variation across Europa with sub-100 km resolution (Ligier et al., Reference Ligier, Poulet, Carter, Brunetto and Gourgeot2016).
This approach is not without limitations; the near-IR region for most materials is comprised molecular overtones and combination bands that are broad, and usually results in complex, ambiguous spectra. It is challenging then to assign specific features observed in the near-IR to a particular chemistry. Observational spectra are usually compared with laboratory reference spectra or fitted with linear mixing models comprised reference spectra. This is made more challenging for application of this technique to icy moon surfaces as knowledge of the mineralogical behaviours of materials comprising these ices is lacking. Indeed, new hydrates that could exist on these bodies are still being discovered (Maynard-Casely et al., Reference Maynard-Casely, Wallwork and Avdeev2013; Fortes et al., Reference Fortes, Knight and Wood2017).
In contrast to near-IR, powder diffraction data are immensely difficult to obtain directly from planetary surfaces, having only been achieved on Mars, so far (Blake et al., Reference Blake, Vaniman, Achilles, Anderson, Bish, Bristow, Chen, Chipera, Crisp and Des Marais2012). However, it has been enormously informative, giving un-ambiguous results on mineral content, as well as indications of grain-size, preferred orientation and amorphous phases at the few Martian sites it has been applied too (Bish et al., Reference Bish, Blake, Vaniman, Chipera, Morris, Ming, Treiman, Sarrazin, Morrison and Downs2013).
To this end, this contribution describes efforts to couple near-IR laboratory spectra with variable-temperature powder diffraction, with the aim to applying this collated information to the interpretation of observed spectra. The added benefit is that this work has used neutron and synchrotron sources, where the ability to rapidly characterise these materials in detail not offered by laboratory sources and over a wide range of temperatures allows additional physical properties (such as thermal expansivity) to be determined simultaneously. This paper describes the experimental setup used at the Australian Centre for Neutron Scattering's WOMBAT instrument and the Powder Diffraction beamline at the Australian Synchrotron. Also described are two preliminary samples that have been characterised by near-IR and powder diffraction at these facilities, along with future implications of similar work.
II. EXPERIMENTAL
A. Near-IR setup
All data were collected using a portable Ocean Optics NIR Quest, which allows spectra to be collected between 900 and 2500 nm at a spatial resolution of 7 nm. This was adapted to allow simultaneous collections with variable-temperature powder diffraction data, predominately through the use of a reflection probe, which delivers light to the sample and carries the reflected light back to the spectrometer for analysis. For the neutron diffraction experiment a DH2000 Ocean Optics (measured power 615 µW light into 600 µm) light source was used, and for the synchrotron study an Ocean Optics HL-2000 (measured power 8 mW into 600 µm) light sources was used.
The reflection spectrum was measured as a function of temperature for each sample, with the electrical dark current subtracted (a shielding was placed over the spectrometer and the signal was recorded with no light input). For all the measurements five scans were averaged. The reflectance data for the intensity as a function of wavelength was referenced to the reflectance from a white reference standard (WS-1-SL Spectralon reflectance standard 99% 400–1500 nm and >96% 250–2000 nm, Ocean Optics).
B. Neutron diffraction setup
A study was carried out with the near-IR in tandem with the high-intensity neutron diffractometer (WOMBAT) at the Australian Centre for Neutron Scattering (Studer et al., Reference Studer, Hagen and Noakes2006), setup with a wavelength of 2.41 Å. In order for variable temperature data to be collected, the reflection probe had to be mounted within a sample stick for use in an orange cryostat (Brochier, Reference Brochier1977). This allows the samples to be characterised between 4 and 300 K, while the atmosphere surrounding the sample was also controlled. Near-IR vacuum feedthroughs were required to couple the reflection under vacuum with the light source and detector. The probe itself was passed down the centre of the sample stick along with the temperature sensor and heater cables. The end of the sample stick adapted to allow for the sample (contained within an open vanadium can) to be mounted within ~5 mm of the end of the reflection probe, as shown in Figure 1. In Figure 1, it is also demonstrated that the open vanadium can is mounted with a copper ring containing a heater and thermocouple that allow for control of the sample temperature to within ±1 K.

Figure 1. (Colour online) Adaptations to the sample mounting for the near-IR reflection probe. The sample is placed inside an open vanadium can that is mounted into a copper ring containing a heater and silicon diode temperature sensor (to allow for fine control of temperature within the cryostat). The reflection probe was mounted above the open sample can, with the sample can filled, so that it reached within 5 mm of the reflection probe.
C. Synchrotron diffraction setup
To further the application of the near-IR/powder diffraction setup, a study was conducted on the Powder Diffraction beamline at Australian Synchrotron (Wallwork et al., Reference Wallwork, Kennedy, Wang, Choi and Rah2007), setup with a wavelength of 0.9535 Å. The sample temperature was varied between 90 and 300 K using an Oxford Cryosystems cryostream (Cosier and Glazer, Reference Cosier and Glazer1986). The most common sample holders on this beamline for variable temperature data collection are quartz or borosilicate glass. However, in this case, absorption by the glass capillary would prevent adequate signal for the near-IR spectrometer. The sample was instead condensed (after being applied by a small brush) onto silica wool wrapped about the outside of a 1 mm diameter glass capillary, as shown in Figure 2. The sample was rotated through 120° at a speed of 90° s−1 to keep the sample temperature constant and provide powder averaging. Further condensation of water from the atmosphere onto the sample was prevented by the nitrogen gas “jacket” generated by the cryostream.
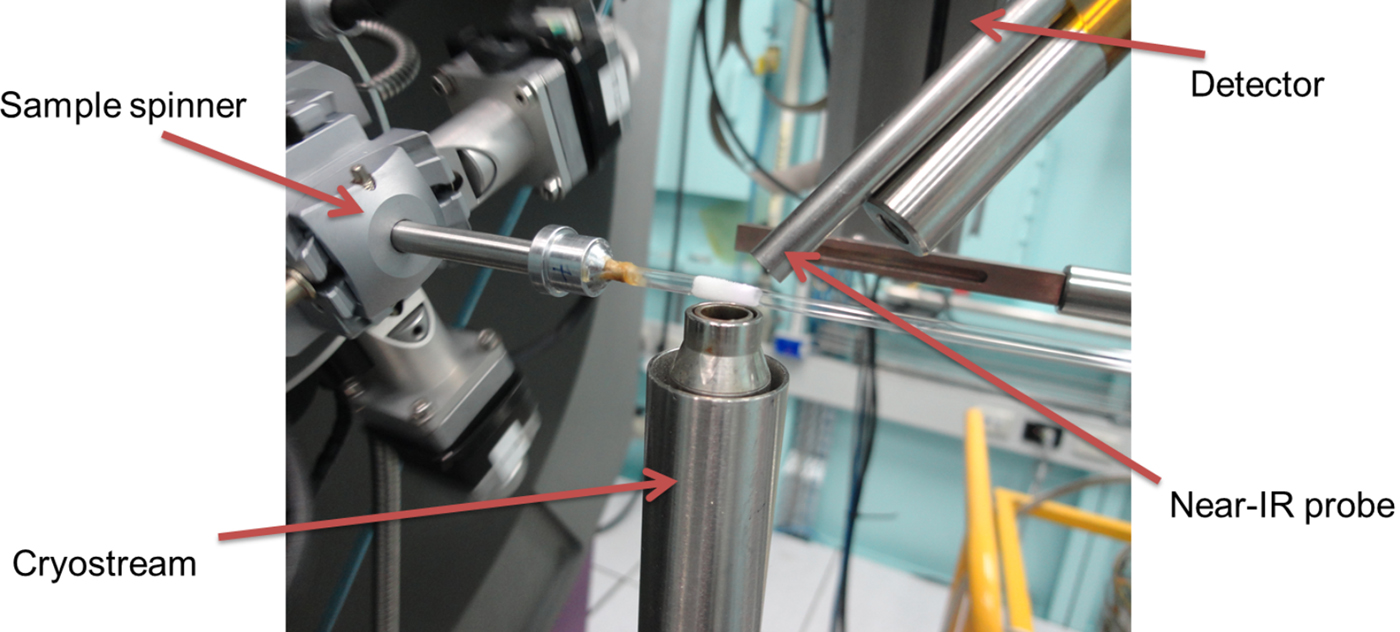
Figure 2. (Colour online) Image detailing the setup of the near-IR spectrometer upon the Powder Diffraction beamline at Australian synchrotron. The sample was condensed onto a thin layer of silica wool wrapped about a 1 mm diameter capillary.
D. Choice of samples
Two mineral systems were chosen for characterisation, using neutron powder diffraction and synchrotron powder diffraction respectively in conjunction with near-IR data collections.
As discussed in the introduction, layered silicate minerals (phyllosilicates) have, in recent years, been realised to be important extra-terrestrial surface materials and are now observed to be present on Mars (Poulet et al., Reference Poulet, Bibring, Mustard, Gendrin, Mangold, Langevin, Arvidson, Gondet, Gomez and Berthé2005) and Ceres (De Sanctis et al., Reference De Sanctis, Ammannito, Raponi, Marchi, McCord, McSween, Capaccioni, Capria, Carrozzo and Ciarniello2015). Though there has been work in investigating laboratory spectra of some minerals (Roush and Singer, Reference Roush and Singer1987), to date there has been no characterisation of the near-IR spectra of layered silicates at low temperatures. In view of future application of applying the technical advances described in this work (combining powder diffraction and near-IR spectra) to observations of planetary surfaces, it was important to establish that phyllosilicates could be studied in this way. Hence, as a preliminary sample, kaolinite [Al2Si2O5(OH)4] a relatively simple phyllosilicate mineral, was chosen to test this methodology. The aim was to characterise this mineral between 100 and 180 K, a temperature range that would make the work applicable to the surfaces of main belt asteroids (Schorghofer, Reference Schorghofer2008). The longer wavelength and that the neutron scattering amplitude is independent of 2θ makes neutron diffraction a particularly useful characterisation tool for phyllosilicate minerals.
The NIMS carried aboard the Galileo spacecraft demonstrated that there is also a significant non-ice component the Jovian moon Europa's surface. Among the best candidates for these non-ice materials are a number of sulphate hydrates – magnesium sulphate, sodium sulphate, which are postulated on the basis that these sulphates are found in similar origin meteorites (Kargel, Reference Kargel1991). Additionally, a further candidate is that the non-ice component are sulphuric acid hydrates, proposed on the basis that they form from radioloysis processes of exogenic sulphur from Europa's sister moon Io (Carlson et al., Reference Carlson, Johnson and Anderson1999). Though there have been a number of studies characterising the spectra of these icy materials within the laboratory, there is a fundamental disconnect with the spectra of these materials and how they would realistically form on the surfaces of the icy Galilean moons. A water-rich magnesium sulphate solution, was chosen for study with the near-IR and synchrotron X-ray diffraction setup. Here the high-resolution afforded by the synchrotron source and MYTHEN detector would allow for the phase determination, the magnesium sulphate system a number of hydration states known and all form low-symmetry structures.
III. RESULTS AND DISCUSSION
A. Neutron example, Kaolinite
Kaolinite (Sigma Aldrich, natural) was placed inside an open vanadium can. The sample was cooled to 20 K, with both near-IR and neutron powder diffraction collected in 5 K intervals, the resulting spectra and patterns between 100 and 180 K, are presented in Figure 3.

Figure 3. (Colour online) Presentation of the near-IR spectra (left) and neutron powder diffraction patterns (right) of the mineral kaolinite collected simultaneously between 100 and 180 K. In the plot of near-IR data, the colour variation indicates the reflectivity of the sample, and in the diffraction plot the colours signify the intensity change. The neutron diffraction data were collected at a wavelength of 2.41 Å.
Pawley (Reference Pawley1981) refinements of the diffraction data implemented in TOPAS (Coelho, Reference Coelho2008) showed that the sample exhibited modest contraction on cooling, with the volume of the kaolinite unit cell (Bish, Reference Bish1993) varying from 327.84(2) Å3 at 180 K, to 327.23(1) Å3 at 100 K with most of the contraction occurred in the c-axis of the kaolinite. As expected, no phase transitions occurred in this temperature range.
In contrast, the near-IR data show in Figure 3 exhibited some variation over this temperature range. At room temperature, the near-IR spectral features of kaolinite have been comprehensively documented by (Petit et al., Reference Petit, Madejová, Decarreau and Martin1999). Within the wavelength range examined here, the absorption feature at 2164 nm, which is increasingly distinct as the sample is cooled, is assigned to a combination OH stretching and deformation vibrations of Al2OH. Additionally, what is observed as a single feature at 1400 nm is actually a blending of a number of 2νOH overtones of OH stretching fundamental modes of the Al2OH group. The lower wavelength end of the band is the result of inner OH groups, whilst the external surface of the octahedral sheet of kaolinite the higher wavelength end—both increase in prominence as the sample is cooled, as shown in Figure 3.
Also seen in Figure 4 are further features at 1540 and 1800 nm which, again, become more distinct as the sample is cooled. These two features are not identified in room temperature spectra. Petit et al. do identify a feature at 1498 nm, said to be an overtone of an unassigned mid-IR vibration band, and though this work sees no clear evidence for the Petit feature it may be present, but drowned out by the absorption band at 1540 nm.

Figure 4. (Colour online) Selected near-IR spectra (normalised to 100% at 1200 nm) from the kaolinite collection, with the black marks indicating the wavelength of the principal features discussed in the text.
All of the feature changes with temperature that are identified appear to be correlated, and in particular a subtle increase in their absorption is seen across the wavelengths studies as a function of temperature. These results demonstrate that the near-IR signal of a material can change with temperature with little impact upon the overall crystal structure.
B. Synchrotron example, magnesium sulphate solution
To demonstrate that combining synchrotron powder diffraction data with near-IR will help address such questions, a water-rich solution of magnesium sulphate (10 wt%) was mounted as described in Figure 2 and cooled to 100 K. The sample was then warmed with data collected in 5 K intervals to 185 K. The data collected from this experiment is presented in Figure 5.

Figure 5. (Colour online) Presentation of the near-IR spectra (left) and synchrotron powder diffraction patterns (right) collected simultaneously between 100 and 180 K from a sample formed from a 10 wt% MgSO4.H2O solution. The dotted black line indicates the onset of MS11 crystallisation. In the plot of near-IR data, the colour variation indicates the reflectivity of the sample, and in the diffraction plot the colours signify the intensity change. The synchrotron diffraction data was collected at a wavelength of 0.9535 Å.
Analysis of the synchrotron diffraction, as detailed in Figure 6 shows that at 100 K the sample consists of hexagonal ice (ice Ih) and a glassy phase, however on warming an additional crystalline phase, determined to be meridianiite (MgSO4.11H2O or MS 11) (Peterson et al., Reference Peterson, Nelson, Madu and Shurvell2007) formed at 165 K. Additionally, as shown in Figure 6, there is a further crystalline phase that also forms ~165 K along with the MS11. There is too little data (only four peaks identified) to discern what this phase is, the reflections do not coincide with the structure of epsomite (MgSO4.7H2O or MS 7), which had been expected (based on the water-rich MgSO4 solution. However, it is possible that yet more forms of magnesium sulphate hydrate are yet to be discovered; hence, further work will be progressed into the identification of this phase and its spectral properties.

Figure 6. (Colour online) 100 K diffraction (bottom pattern) and 180 K pattern (top pattern) from Figure 5, with respective fits to the data from a sample formed from a 10 wt% MgSO4.H2O solution. Underneath the patterns tick marks indicating the positions of reflections from Ice Ih (blue) and meridianiite (MgSO4.11H2O or MS 11) (red). In both patterns the contribution from Ice Ih has been modelled with a Pawley fit, and with two phases with slightly different lattice parameters (to account for the sample being formed on the outside of the capillary). The reflections from MS11, being a lot broader, has been modelled with a Rietveld fit to the structure (Peterson et al., Reference Peterson, Nelson, Madu and Shurvell2007). The asterisks indicate an accessory phase, that is not epsomite (MgSO4.7H2O or MS 7) and has not yet been identified.
The near-IR data are dominated by H2O and OH features at 1500 and 2000 nm; however, it is perceived that both of these features are modified by the presence of the glassy phase (assumed to be MgSO4.xH2O). The broadness of the 2000 nm water feature notably decreases with temperature, as exhibited in Figure 7, but this seems to be independent of the crystallisation of MS11, perhaps indicating a change in the glassy phase.
Additionally, the emergence of a distinct feature within this data set is noted, as shown in Figure 7 a new features emerging ~1340 nm, ~135 K, which becomes more prominent on warming. There are currently no available reference spectra for MS11 as it is a relatively newly discovered mineral, and it is possible that the 1340 nm feature is due to this material. However, there is a discrepancy between when the 1340 nm is first discerned in the near-IR spectra (135 K) and when the diffraction signal is first observed from MS11. This discrepancy between these temperatures is interesting and is probably indicative that the near-IR spectra is more sensitive to surface effects—whereas the diffraction is more of a probe of the “bulk” of the sample. In fact, on crystallisation of the MS11, the near-IR signal shows little dramatic change.

Figure 7. (Colour online) Selected near-IR spectra from the 10% wt MgSO4.H2O solution collection, with the black marks indicating the wavelength of the principal features discussed in the text. The two sharp discontinuities in the data at 1480 and 1510 nm are attributed to errors arising from the detector.
IV. CONCLUSION
This work has demonstrated that near-IR spectroscopy and powder diffraction data can be collected in tandem with relatively little modification of widely-available equipment. This contribution has focused on synchrotron and neutron diffraction instruments, as these are necessary to explore the types of samples that this theme of research has targeted. Though this work has concentrated on the samples and possible implications for the understanding of planetary surfaces, this technique could be applied to other disciplines. The setup described here could equally well be used for visible light spectroscopy, and could add a dimension to the study of spin-crossover materials (Real et al., Reference Real, Gaspar and Munoz2005).
The paper describes two preliminary samples that have been studied with the technique, kaolinite and a magnesium sulphate solution. Kaolinite was chosen as a check as to if layered silicate minerals can be studied in this way, especially given the increase detection of this family of minerals within the asteroid belt. It was found that, though no large-scale changes were seen in the diffraction signal, the near-IR signal showed changes with temperature. This result demonstrates that changes in the near-IR spectra do not necessarily point to large-scale structural change. Overall, this suggests that the near-IR spectroscopy of layered silicates at low temperatures needs to be further understood in order to apply this experimental data to low-temperature and airless bodies in our solar system.
The second sample studied, a frozen 10 wt% magnesium sulphate solution, showed variability in both the near-IR spectra and diffraction pattern. The variability in the diffraction pattern was straight-forward to interpret, it occurred when thermal annealing caused a glassy phase to crystallise to form MS11 as well as an unidentified crystalline phase. However, the changes in the near-IR spectra (such as the new feature at 1340 nm) did not correlate with the phase change seen in the diffraction, and suggest that the optical properties of these water-rich sulphate hydrate mixtures are the result of a multitude of effects—temperature being perhaps the most important. Nonetheless, this work demonstrates the effectiveness of being able to tie well understood diffraction data to the broad features observed in experimental near-IR spectra.
ACKNOWLEDGEMENTS
The authors acknowledge the Australian Centre for Neutron Scattering (ACNS) for the provision of funds to purchase the Near-IR equipment. Part of this research was carried out on the Powder Diffraction beamline at the Australian Synchrotron and WOMBAT (high-intensity powder diffraction) instrument at the ACNS.


