


I. INTRODUCTION
The Cambridge Structural Database (CSD) is a database of organic and organometallic crystal structures that have been published in the academic literature, patents or received through direct private communications from crystallographers. The majority of entries in the CSD contain an accurate description of the chemical connectivity and the full three-dimensional (3D) coordinates of the associated structure along with bibliographic information extracted from the original publication. The Cambridge Structural Database System (CSDS) allows users to search and retrieve crystallographic entries and perform the data analysis on the wealth of information contained within the database. It is used widely across the scientific community in, for example, drug design and development, crystal engineering, protein–ligand structure solution and refinement.
The Cambridge Crystallographic Data Centre (CCDC) is a not-for-profit organization dedicated to the curation and redistribution of crystallographic information from small molecule crystal structures. The CCDC's primary responsibility is the creation of the CSD. CCDC is funded by annual contributions from its user community.
CCDC acts as a custodian of crystallographic information to the wider chemical community. Individual structures are available for download free-of-charge from the CCDC's web site, and, in 2013, over 100 000 structures were accessed via this portal. The complete database is available along with access software to financial contributors. Key parts of the CSDS are summarized in Figure 1. The software applications, ConQuest and Mercury (Bruno et al., Reference Bruno, Cole, Edgington, Kessler, Macrae, McCabe, Pearson and Taylor2002) provide the means to search, retrieve and analyze the structures. The knowledge-bases, Mogul (Bruno et al., Reference Bruno, Cole, Kessler, Luo, Motherwell, Purkis, Smith, Taylor, Cooper, Harris and Orpen2004) and IsoStar (Bruno et al., Reference Bruno, Cole, Lommerse, Rowland, Taylor and Verdonk1997) form the next tier of the CSDS. These are databases of derived information: Mogul captures data from CSD entries regarding intra-molecular geometric preferences; IsoStar presents distributions of interaction preferences for a wide variety of chemical groups. Finally, there are software applications that utilize CSDS data in their operation. Of particular relevance to powder diffraction is DASH, a system for solving crystal structures from powder diffraction data.

Figure 1. (Color online) A summary of the key parts of the CSDS that are used in structural studies. The annotations summarize the flow of information through the system from a user's perspective. Databases are shown in as cylinders in blue while applications are shown as larger rectangles in orange.
Applications in the CSDS are interlinked; for example, Mercury and ConQuest allow a user to perform database searches, while Mercury can cross-link to Mogul and IsoStar for structural analyses and DASH can make direct use of Mogul for assessing conformational preferences in structure solution.
Parts of the CSDS can also be usefully integrated into third party applications. For example, Mogul is ideally suited to the generation of restraints that can be utilized in crystal structure refinement. Indeed, research groups in the field of protein structure refinement now use Mogul routinely for generating ligand dictionaries in macro-molecular structure refinement (Smart et al., Reference Smart, Womack, Sharff, Flensburg, Keller, Paciorek, Vonrhein and Bricogne2001). Small molecule crystallographers can use Mogul via a link in the CRYSTALS refinement package (Betteridge et al., Reference Betteridge, Carruthers, Cooper, Prout and Watkin2003). Most recently, Rigaku have developed a link to Mogul that allows users to restrain bond lengths and angles in structural models during Rietveld refinement to the means of those suggested by Mogul (Rigaku, 2013).
In this paper, the structure solution of a racemic form of ornidazole from powder diffraction data is reported. This structure and several other CSD structures are used to illustrate how the CSDS can benefit structural solution and refinement from powders and to show how the CSDS can aid in the analysis of the structural information obtained.
A. Growth of Data in the CSD
Editors at the CCDC incorporate all organic and organometallic crystal structures published in the chemical literature into the CSD. In addition to published structures, they encourage researchers to deposit with the CCDC previously unpublished structural data, or new crystal structures that are not intended for wider publication. This strategy makes the CSD a more valuable resource to the community.
In Figure 2, the growth of crystallographic output is shown. The growth appears to approximate to the exponential phase of a sigmoidal growth curve [see Figure 2(a)]. The ever increasing volume of data presents a significant challenge for data curation organizations, driving the need for process automation.

Figure 2. (Color online) (a) Growth in the number of organic crystal structures in the CSD. (b) Growth in the average complexity of organic systems in the CSD. The mean of the number of atoms is in blue and number of DoF is in red (see supplementary information for details of how these values are calculated) for structures published since 1985. (c) Growth in the number of organic crystal structures in the CSD solved from powder data. (d) Growth in the average complexity of organic crystal structures in the CSD from powder data. The data shown are derived from structures published up to the end of 2012.
A recent article on the use of structure determination by powder diffraction (SDPD) methods for solving small-molecule crystal structures of pharmaceutical interest summarized the growth of molecular crystal structures in the CSD (Shankland et al., Reference Shankland, Spillman, Kabova, Edgeley and Shankland2013). A similar analysis that considers all structures (Shankland et al. considered only structures with Z′ = 1) is presented here and shown in Figure 2(b). While the variance in the data points is typically quite large, viewed over time we can see a broad trend that suggests that the complexity of molecular organic crystal structures deposited into the CSD has, unsurprisingly, increased up until the year 2000.
Figures 2(c) and (d) show equivalent plots, but this time only considering those structures in the CSD derived from powder diffraction data. The total numbers of structures are tiny by comparison with the full database; just 0.5% of the total in 2012, however, these structures show the same underlying trends as the full database: a significant growth in volume of data received, and an increase in overall structural complexity. It is interesting to note that the structural complexity of SDPD studies is now, on average, comparable to that of the single-crystal organic structures added to the CSD. This reinforces the notion that crystal structure determination of pharmaceutically relevant compounds using powder diffraction data alone is not only routine (David et al., Reference David, Shankland and Shankland1998), but returns structures that are of high quality (Karki et al., Reference Karki, Fabian, Friscic and Jones2007; Lapidus et al., Reference Lapidus, Stephens, Arora, Shattock and Zaworotko2010).
B. Powder diffraction studies in the CSD
A key application area for the CSD is determining trends for specific chemical features (such as bond lengths) in the specific chemical systems. Typically these studies will rely on the atomic coordinates established from single-crystal studies of well-ordered structures that yield relatively accurate coordinate positions, as a consequence of the high data-to-parameter ratio in the least-squares structure refinement. Powder diffraction refinements suffer from a much lower data-to-parameter ratio and generally rely upon either the use of rigid-bodies or soft restraints on structural parameters in order to maintain chemical sense during the refinement stage. Nevertheless, they are of great import in situations where no single crystal can be obtained and where, for example, variable pressure/temperature/humidity experiments are required. Lapidus et al., (Reference Lapidus, Stephens, Arora, Shattock and Zaworotko2010) have compared the structural quality of compounds that were determined by powder diffraction studies and single-crystal studies. They conclude that if carefully performed, powder diffraction studies of co-crystals are of comparable accuracy with single-crystal studies, but naturally the precision of the results is lower. As such, the CSDS currently retains a discriminatory flag on powder studies. If structural data are abundant for a given feature of interest, the user can choose to omit powder studies from the results, but even with 700 000 structures to choose from, users can find that the number of crystal structures relevant to their search are limited; in such cases a key criterion for using data is to understand its relative precision, and interpret results accordingly.
II. USING THE CSDS TO AID POWDER DIFFRACTION STUDIES
A. Structure solution using DASH and Mogul
DASH (Florence et al., Reference Florence, Shankland, Shankland, David, Pidcock, Xu, Johnston, Kennedy, Cox, Evans, Steele, Cosgrove and Frampton2005; David et al., Reference David, Shankland, van de Streek, Pidcock, Motherwell and Cole2006b) utilizes simulated annealing (David et al., Reference David, Shankland and Shankland1998; Shankland et al., Reference Shankland, McBride, David, Shankland and Steele2002b) to minimize the differences between observed powder diffraction data and data calculated from a structural model in direct space. One of the key features of DASH is the speed with which candidate structures are evaluated; rather than using the time-consuming method of calculating a full diffraction pattern for every candidate structure (of which there are typically millions in a crystal structure determination) it uses reflection intensity data and the correlations between reflection intensities obtained for overlapping reflections in the powder X-ray diffraction (PXRD) pattern. Combined with a simulated annealing algorithm whose parameters are set automatically by the program, this leads to a fast and effective protocol for the crystal structure solution, as evidenced by many structures solved using it. A few recent examples include trospium chloride with 14 degrees of freedom (DoF: see supplementary information for a full definition) (Skorepova et al., Reference Skorepova, Cejka, Husak, Eigner, Rohlicek, Sturc and Kratochvil2013), mebendazole with 11 DoF (Ferreira et al., Reference Ferreira, Antoni, Pires Rosa and Paiva-Santos2010), nimustine hydrochloride with 16 DoF (Bekoe et al., Reference Bekoe, Urmann, Lakatos, Glaubitz and Schmidt2012), indomethacin–nicotinamide co-crystal with 18 DoF (Majumder et al., Reference Majumder, Buckton, Rawlinson-Malone, Williams, Spillman, Shankland and Shankland2011), and naltrexone hydrochloride with 12 DoF (Guguta et al., Reference Guguta, van Eck and de Gelder2009). Some more complex examples of crystal structures include AR-C69457CC with 26 DoF (Johnston et al., Reference Johnston, Florence, Shankland, Markvardsen, Shankland, Steele and Cosgrove2004), chlorothiazide N,N-dimethylformamide solvate with 42 DoF (Fernandes et al., Reference Fernandes, Florence, Shankland, Shankland and Johnston2006), carbamazepine form II and cyheptamide form II with 28 DoF (Fernandes et al., Reference Fernandes, Shankland, Florence, Shankland and Johnston2007) and docetaxel monohydrate with 23 DoF (Vella-Zarb et al., Reference Vella-Zarb, Dinnebier and Baisch2013), confirming that DASH is capable of solving structures with DoF greater than the average shown in Figure 2(d).
By way of an illustrative example of a structure with significantly more DoF than the average, we include here the solution from powder data of the antifungal agent ornidazole. Synchrotron powder diffraction data were collected at 130 K on the high-resolution powder diffractometer (BM16) of the European Synchrotron Radiation Facility (ESRF) by Shankland and David (λ = 0.652 78 Å, personal communication, 1997) and the pattern indexed to a triclinic unit cell, a = 13.636 01 Å, b = 14.055 59 Å, c = 8.930 88 Å, α = 71.6038°, β = 78.5696°, γ = 64.8111°, V = 1465.72 Å3 with space group P
 $\bar 1$
, suggesting Z′ = 3 and total of 30 DoF (nine positional, nine rotational, and 12 torsional). Repeated attempts to solve the structure using DASH met with failure and even the publication of a single-crystal structure (Shin et al., Reference Shin, Song, Kim and Chung1995) which then enabled the use of correctly folded starting conformations (thus eliminating 12 DoF) failed to yield a result. Recently, the data were revisited as part of a systematic study of the performance of DASH across a wide range of structural complexities. The model used in this latest study was derived from the fully ordered component of the CSD entry NETRUZ01 (Anderson et al., Reference Anderson, Probert, Whiteley, Rowland, Goeta and Steed2009) and the crystal structure solved by DASH using 500 simulated annealing runs each utilizing 5 × 10⁷ SA moves for the 30 DoF, i.e. all three independent molecules fully flexible around their four torsion angles. The best DASH solution obtained has a very favorable χ
2
SA/χ
2
Pawley ratio of 2.74, strongly suggesting that the structure has been solved. A scale-factor-only Rietveld refinement in TOPAS (Coelho, Reference Coelho2003) gave an R
wp value of 11.47 (Figure 3), which compares favorably with the Pawley R
wp value of 6.68. The DASH solution is in excellent agreement with that of NETRUZ01; crystal packing similarity using Mercury returns an RMSD of 0.11 Å for 15/15 molecules and an overlay of one of the independent molecules is shown in Figure 4. Of the 500 runs performed in this work, which took a total run time of 480 CPU hours on a 12 core 2.6 GHz Xeon(R) processor, only four reached the global minimum. Given that the core SA algorithm in DASH has not varied substantially over the years, it is clear in retrospect that the ornidazole crystal structure could have been solved when the data were collected, had sufficient computational power been available. It is not clear why this particular structure requires so many long SA runs in order to reliably locate the global minimum; other complex structures with Z′ > 1 have been solved with much greater success rates using DASH, e.g. carbamazepine form II and cyheptamide form II, both of which have Z′ = 4.
$\bar 1$
, suggesting Z′ = 3 and total of 30 DoF (nine positional, nine rotational, and 12 torsional). Repeated attempts to solve the structure using DASH met with failure and even the publication of a single-crystal structure (Shin et al., Reference Shin, Song, Kim and Chung1995) which then enabled the use of correctly folded starting conformations (thus eliminating 12 DoF) failed to yield a result. Recently, the data were revisited as part of a systematic study of the performance of DASH across a wide range of structural complexities. The model used in this latest study was derived from the fully ordered component of the CSD entry NETRUZ01 (Anderson et al., Reference Anderson, Probert, Whiteley, Rowland, Goeta and Steed2009) and the crystal structure solved by DASH using 500 simulated annealing runs each utilizing 5 × 10⁷ SA moves for the 30 DoF, i.e. all three independent molecules fully flexible around their four torsion angles. The best DASH solution obtained has a very favorable χ
2
SA/χ
2
Pawley ratio of 2.74, strongly suggesting that the structure has been solved. A scale-factor-only Rietveld refinement in TOPAS (Coelho, Reference Coelho2003) gave an R
wp value of 11.47 (Figure 3), which compares favorably with the Pawley R
wp value of 6.68. The DASH solution is in excellent agreement with that of NETRUZ01; crystal packing similarity using Mercury returns an RMSD of 0.11 Å for 15/15 molecules and an overlay of one of the independent molecules is shown in Figure 4. Of the 500 runs performed in this work, which took a total run time of 480 CPU hours on a 12 core 2.6 GHz Xeon(R) processor, only four reached the global minimum. Given that the core SA algorithm in DASH has not varied substantially over the years, it is clear in retrospect that the ornidazole crystal structure could have been solved when the data were collected, had sufficient computational power been available. It is not clear why this particular structure requires so many long SA runs in order to reliably locate the global minimum; other complex structures with Z′ > 1 have been solved with much greater success rates using DASH, e.g. carbamazepine form II and cyheptamide form II, both of which have Z′ = 4.

Figure 3. (Color online) A scale-factor-only Rietveld refinement of the best DASH solution for racemic ornidazole.

Figure 4. (Color online) A representative molecular overlay, generated in Mercury 3.3, of the best DASH solution and NETRUZ01.
The size of the search space that needs to be explored by the SA algorithm scales exponentially with the number of DoF in the structure under study, making it (in general) more difficult and more time-consuming to reliably locate the global minimum in that space (Shankland et al., Reference Shankland, David, McCusker and Baerlocher2002a). Utilizing prior structural knowledge can however, dramatically extend the applicability of such algorithms. In a normal DASH run, the input structural model already utilizes a wealth of structural information, in the form of well-known bond lengths, angles, and fixed torsion angles; it is only those (flexible) torsion angles that are not known in advance that are treated as parameters to be determined as part of the simulated annealing process. Of course, one also has prior information on the values likely to be adopted by some of the torsional parameters in the molecule and this information can be used to restrict search space to these regions of higher probability. This additional information can be extracted from relevant structures in the CSD using Conquest, or more conveniently using the Mogul knowledge-base, which contains conformational preferences of molecules in the CSD in the form of distributions of bond lengths, angles, and torsion angles. Mogul has previously been used (Florence et al., Reference Florence, Shankland, Shankland, David, Pidcock, Xu, Johnston, Kennedy, Cox, Evans, Steele, Cosgrove and Frampton2005) to extend the scope of structure solutions using DASH; the approach taken was to use Mogul to aid an investigation in assessing the likely conformational preferences of a given torsion angle. The investigator then made a judgment, based on the prior structural evidence available, about the angular limits applied to a given flexible torsion angle in the molecule under study, and in so doing, cut down the amount of space that needs to be explored. This method, while effective, has the drawback in its reliance on the expertise of the user and so a more automated method has been developed in which SA moves for torsion angles are biased toward regions that are likely to be observed in such a molecule, as predicted by Mogul. The effectiveness of this Mogul directional biasing (MDB; David et al., Reference David, Shankland, Cole, Maginn, Motherwell and Taylor2006a) has yet to be fully evaluated, but some encouraging results have been obtained on a number of structures and these are summarized in Table I. It is clear that the original Mogul approach improves results across the board and that MDB is effective in the cases of famotidine and capsaicin.
Table I. Success rates for three standard test cases using different Mogul approaches. The success rate reported is determined based on 50 SA runs of 107 moves. All datasets taken from Florence et al. (Reference Florence, Shankland, Shankland, David, Pidcock, Xu, Johnston, Kennedy, Cox, Evans, Steele, Cosgrove and Frampton2005).

The result for verapamil hydrochloride is poor when using MDB. We include it to illustrate that MDB is not a panacea. The result can be explained by consideration of the structure and the applied method. The correct structure in verapamil hydrochloride contains a torsion angle that resides in a smaller peak of the Mogul distribution; it therefore has a less likely conformation than the majority of similar structures in the CSD that possess a C10–C9–N1–C8-type torsion. In the conventional Mogul algorithm, the relative peak height is ignored; all Mogul peaks are treated as regions in which sampling should be equally biased. This is not the case in the MDB algorithm: here the minor peak regions are down-weighted, so MDB can occasionally actively bias a structural solution away from the correct answer. The success rate with MDB achieved with verapamil HCl can be improved to 22% if the C10–C9–N1–C8 torsion angle is allowed to rotate freely. Having such a torsion angle is not always problematic; indeed, in verapamil HCl, the adjacent torsion angle (C11–C10–C9–N1) also resides in a minor peak in Mogul but seems to have limited influence on the success rate achieved (see Figure 5 and Figures S1 and S2 in the supplementary information). It is worth noting that the extent of the contribution made by MDB to torsion angle sampling has not as yet been extensively trained. Further work in this area may improve the achievable success rates using this approach in such cases.

Figure 5. (Color online) The connectivity of verapamil HCl. The atoms involved in the C11–C10–C9–N1 and C10–C9–N1–C8 torsion angles have been labeled.
B. Crystal structure analysis and validation using Mercury
The CSDS contains the structural visualizer, Mercury. Mercury is a useful application for analyzing the results of structural analyses and is freely available for download from CCDC's website, although its more advanced features are available only to contributors. It allows for extensive analysis of molecular geometry and interactions above and beyond basic contact analysis. An additional module (the Solid Form module) allows scientists to quantify similarities and differences between polymorphs, hydrates, and solvates, identify regions of structural similarity, and understand the strengths and weaknesses of structures by searching for extended functional group interaction motifs or general packing features, quickly and easily. Particularly relevant features of Mercury are summarized in Table II.
Table II. Relevant features in Mercury for crystal structure analysis.

The program provides built-in functionality for analyzing hydrogen bonds and short contacts, but also the ability to create custom definitions of contact types; within Mercury, the user can create a definition which allows the display of only short contacts between user-specified atom types. The definition of short can be either based on absolute distance or can be normalized to account for the VdW radii of participating atoms.
An example is shown in Figure 6 for the CSD entry BAGCET (Snegaroff et al., Reference Snegaroff, Tan Tai, Marquise, Halauko, Harford, Roisnel, Matulis, Ivashkevich, Chevallier, Wheatley, Gros and Mongin2011); the structure of 3,5-dichloro-2-iodopyridine. In Figure 6(a), all close contacts less than VdW radii are shown, whereas in Figure 6(b) multiple different contact definitions (one for halogen bonds, one for Cl—Cl contacts, and one for H—Cl contacts) were used to highlight a more interpretable network. The network is fully interactive: the user can click on contacts to expand the network, or use a contact dialog to control the contacts on view.

Figure 6. (Color online) An illustration of the benefit of using multiple contact definitions to aid comprehensibility of packing in CSD entry BAGCET: (a) Standard close contacts using all atom–atom contacts within VdW radii, (b) Multiple contacts showing halogen bonds (sum of VdW radii between a halogen and a nitrogen), Cl—Cl interactions (sum of VdW radii) and Cl—H contacts (VdW + 0.1).
The investigator can easily generate molecular shells based both on interatomic distances, VdW's corrected distances or through the use of energy calculations based on the UNI force field (Gavezzotti, Reference Gavezzotti1994; Gavezzotti and Filippini, Reference Gavezzotti and Filippini1994). Hydrogen bonds can be analyzed using graph set analyses as described by Bernstein (Bernstein et al., Reference Bernstein, Davis, Shimoni and Chang1995; Motherwell et al., Reference Motherwell, Shields and Allen2000; Lemmerer et al., Reference Lemmerer, Adsmond and Bernstein2011). The available structures of ornidazole provide a good opportunity to highlight the application of some of these features.
Five related ornidazole (single-crystal) structures are available in the CSD, the oldest dating from 1995. In this structure (the racemate; NETRUZ), there are three molecules in the asymmetric unit. A chirally pure form of ornidazole (NOBVEF; Skupin et al., Reference Skupin, Cooper, Frohlich, Prigge and Haufe1997) was determined soon afterwords and more recently a redetermination of the racemic structure at a lower temperature (120 K) and a new co-crystal with 4-nitrobenzoic acid (NETRUZ01 and CUBBEH) were published by Anderson et al. (Reference Anderson, Probert, Whiteley, Rowland, Goeta and Steed2009). Deng et al. (Reference Deng, Wang and Lv2007) have also published a hemi-hydrate structure (WINKUA).
In the original racemate structure, Mercury highlights the presence of five strong interactions (−8 kcal mol−1 or stronger) to the lattice energy according to the UNI force field. Two of these (the strongest) interactions are stacking relationships between imidazole rings related by inversion symmetry [see Figure 7(a)]. A further two of these interactions represent a large ring mediated by hydrogen bonds. Graph set analysis clarifies the nature of the hydrogen bonding. It shows the formation of a complex R 4 4 (18) ring [see Figure 7(b)]. The fifth strong interaction is due to two symmetry independent ornidazole molecules mediated by an additional hydrogen bond.

Figure 7. (Color online) Interactions in some of the ornidazole structures in the CSD: (a) Stacking in racemic ornidazole; the intermolecular energy (in kcal mol−1) as calculated by the UNI force field is shown. (b) An R 4 4 (18) ring in racemic ornidazole. (c) Herring bone interactions in chirally resolved ornidazole.
In the chirally pure structure, a different pattern is observed; because of the lack of inversion symmetry, the packing is instead dominated by herring bone packing mediated by an OH—N hydrogen bond [see Figure 7(c)].
One can study the prevalence of particular structural arrangements using the crystal packing feature in Mercury. This feature allows the user to select one or more functional groups and search for the same spatial arrangements of the groups in the CSD. By way of example, the pair of imidazole rings forming the strongest stacking interaction in NETRUZ01 [see Figure 7(a)] were selected in Mercury and searched against the CSD (v 5.35) directly from within Mercury (the query and the result summary file are included in the supplementary material). 21% of structures that could form such a stack do, although interestingly the stack is not present in any of the other forms of ornidazole (CUBBEH, NOBVEF, WINKUA) reported in the CSD.
The hemi-hydrate structure of ornidazole (WINKUA) allows demonstration of the benefit of void detection for structural analysis. Void detection operates by analyzing the accessibility of grid points for a given probe radius, and then generating a contoured surface that envelopes the accessible points.
The WINKUA structure was solved using single-crystal diffraction where, owing to the high data resolution, the water position would have been seen in electron density maps. In some structures, however, solvent can be disordered and so not so easily resolved. In a powder study, the lack of resolution is exacerbated by reflection overlap, making the characterization of solvates challenging. Void analysis can show where channels and holes exist within a structure, so that the investigator can identify possible locations where solvent may reside. In Figure 8, we show a void analysis (with a probe radius of 1.0 Å and a grid spacing of 0.4 Å) of the WINKUA structure with the half water molecule removed. Unsurprisingly, a hole is detected that is exactly coincident with the solvent location; one can see that performing such an analysis on a structure in its early stages of refinement might indicate when the possibility of the inclusion of a solvent molecule in the structural model may be warranted.

Figure 8. (Color online) Void analysis of ornidazole hemi-hydrate where the half water has been removed from the structure.
Void analysis can also be useful for rationalizing structural changes. A recent study (Fujii et al., Reference Fujii, Uekusa, Itoda, Yonemochi and Terada2012) uses void detection to illustrate critical differences between a sequence of hydrates of Lisinopril, leading to an understanding of the dehydration and rehydration mechanism. In Figure 9, four images are shown which illustrate the formation of a large channel on solvent loss in the dihydrate to the monohydrate, and then the structural reorganization with the loss of the second solvent. It is interesting that the larger channel is retained in the anhydrous structure. Fujii et al. explain this by considering the differences between the hydrogen bonding patterns in the dihydrate and the monohydrate.

Figure 9. (Color online) A comparison of voids in Lisinopril hydrate structures, all viewed down the b axis: (a) Small voids in the dihydrate structure. (b) The larger channel in the monohydrate structure, caused by the loss of single water from the dehydrate. (c) The monohydrate structure, but with the remaining water molecule removed manually to show the additional void space created. (d) The anhydrous structure which actually results from the reorganization that occurs upon removal of the remaining water molecule.
C. Intramolecular geometric analysis and validation using Mercury and Mogul
The advanced features in Mercury also provide tools for studying intra-molecular geometry. These features are summarized in Table III.
Table III. Features relevant for analysis of molecular geometry.

Mercury contains cross-links to other parts of the CSDS. For example, Mogul can be launched directly from within Mercury to generate a structure report of detailed geometric parameters lying in regions that one would deem unusual in comparison with distributions of similar features in the CSD.
Mogul reports were generated for the racemate structures deposited in the CSD (NETRUZ and NETRUZ01). In NETRUZ, some features were shown to be unusual. These are summarized in Table IV (see also Figure 10).

Figure 10. (Color online) The connectivity of ornidazole in NETRUZ. The labeled atoms are those involved in the bonds and angles listed in Table IV.
Table IV. Unusual features in structure NETRUZ, and their equivalent in NETRUZ01. The z-score, minimum and maximum values reflect the underlying distributions. In Mogul, as released, any feature with a z-score >2.0 is deemed unusual. The minimum and maximum are the highest and lowest values observed in the underlying distribution.

A noticeable feature from the Mogul report of the first structure is that it highlights a number of bond lengths and angles that are deemed “unusual”. A standard Mogul report tells the user the underlying z-score for an observation. This score gives the number of standard deviations away from the mean that a given parameter lies; thus a z-score of 2.0 corresponds to an observation that lies two standard deviations from the mean and is therefore somewhat unusual. The length of the bond between C4 and C5 in NETRUZ is marked as unusual with a z-score of 2.5. Inspecting the underlying distribution further suggests that this bond is rather shorter than might be expected by comparison with other related structures in the CSD (see Figure 11).
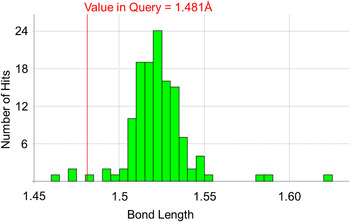
Figure 11. (Color online) Mogul distribution for the C4–C5 bond length in the racemic structure of ornidazole (NETRUZ).
The report highlights a number of other unusual features in the first structure. The unusual bonds suggest that there may be residual issues in the structure, which need further attention. NETRUZ01 shows no such problems. However, in this structure a disordered chloromethyl group was resolved. It should be noted that the bond lengths and angles that Mogul identifies as unusual in the original structure are relatively remote from this problematic group; Mogul is not pointing to the problematic region, but experienced crystallographers understand that refinement of a structure is a holistic process. Missing elements of a model can lead to other regions of a model being compromised in refinement, and thus when unusual geometry is observed, the structural model deserves some scrutiny. Additional examples of the use of the CSD in Rietveld analysis can be found in the paper of Kaduk (Reference Kaduk2007).
Use of Mogul in validating starting models for SDPD
When solving a structure with a global optimization-based program such as DASH, a 3D description of the molecule under study is a prerequisite. Such descriptions, typically in internal coordinate format, can be derived from models created using a wide range of molecular modeling computer programs, models taken directly from reported crystal structures in the CSD (e.g. in the case of polymorphic systems) or models that are based upon closely related structures. Regardless of how the initial model is constructed, it is advisable to check that its basic molecular geometry (i.e. bond lengths, bond angles and non-rotatable torsions) is chemically reasonable and Mogul provides a quick and easy way of identifying structural elements that deviate substantially from CSD-derived expectation values. All identified issues with the model flagged up by Mogul should be addressed before any global optimization is performed, for two reasons: (a) the more accurate the starting model, the more likely it is that one will locate the global minimum in the structure solution space; and (b) one can then refine the solved crystal structure as a series of connected rigid bodies, secure in the knowledge that bond lengths and angles in the crystal structure are already chemically reasonable and do not necessarily need to be refined. This second point greatly simplifies the refinement process and helps prevent situations where improvements in the fit to the diffraction data come at the expense of chemical sense.
D. New developments: full interaction maps (FIMS)
The CSDS includes a component, IsoStar (Bruno et al., Reference Bruno, Cole, Lommerse, Rowland, Taylor and Verdonk1997), which produces interaction maps between functional groups based on the CSDS. Each interaction map reflects how pairs of functional groups tend to orient themselves with respect to each other in the CSD. In addition the “propensity” for a given interaction can be assessed by observing the frequency of the interaction in the CSD.
These individual interaction maps can now be combined into full interaction maps (Wood et al., Reference Wood, Olsson, Cole, Cottrell, Feeder, Galek, Groom and Pidcock2013). A full interaction map is a contoured map that shows the relative propensity for one or more probes around a molecule. This tool allows the user to assess a structure rapidly to check if the interactions formed are comparable to those that we observe in the CSDS.
In Figure 12, a FIMS plot is shown for the uncharged NH probe (a surrogate for a hydrogen bond donor) and the carbonyl oxygen (a surrogate for a hydrogen bond acceptor) around one of the three ornidazole molecules in NETRUZ01. Superimposed on the plot are the locations of hydrogen bonds and Cl—O contacts. The plot shows that the OH—N hydrogen bond lies in a region that would be deemed highly likely by the CSD; the nitrogen atom lies in the middle of a red contoured region representing the carbonyl probe. The carbonyl probe also highlights the likelihood of carbonyl-like oxygen being located relatively close to chlorine atom in the molecule, and this is indeed observed in the structure with a halogen bond between the chlorine and a nitro-oxygen. Finally, the imidazole ring nitrogen is not satisfied via a strong hydrogen bond in this molecule; the CSD would show that such an interaction is often formed (cyan region), and indeed in the other two symmetry independent molecules in the structure do form OH—N hydrogen bonds to their imidazole nitrogen. In the molecule shown a weaker CH—N hydrogen bond does exist.

Figure 12. (Color online) A full interaction map for one of the three independent molecules present in racemic ornidazole (NETRUZ01). Favorable regions for the uncharged NH probe are shown in cyan. Favorable regions for the carbonyl oxygen probe are shown in red. A Cl—O contact in the actual structure and a hydrogen bond are shown, illustrating the predictive power of FIMS.
Analysis of this kind can help to rationalize a structure. The FIMS evidence here is easily generated and it gives a rapid qualitative picture of the likelihood of interactions formed and not formed by a molecule based on CSD evidence. The evidence above would have provided tentative support for the hypothesis that it may be possible to form a hydrate of this compound, as we can see that certain strong acceptors are unsatisfied in the crystal structure.
III. CONCLUSIONS
Powder diffraction as a technique for crystal structure determination is becoming more prevalent in the community as method development and increasing compute power makes its application more routine. We have illustrated how a user can take advantage of the CSDS when solving, refining and critically assessing small molecule crystal structures derived from PXRD data.
The use of prior structural information in SDPD can help compensate for the low information content of the majority of PXRD patterns, by significantly reducing the size of the search space for global optimization algorithms; the CSDS is an ideal basis for biasing search space in this way.
As SDPD methods improve and user confidence in them increases, we see increasingly complex structures being solved from PXRD data alone, but users must pay particular attention to the chemical and crystallographic sense of their refined crystal structures. The CSDS is a valuable resource for the critical assessment of refined structures, both in terms of molecular geometry and intermolecular interactions, especially hydrogen bonds. Alongside other resources, such as EnCifer (Allen et al., Reference Allen, Johnson, Shields, Smith and Towler2004), PLATON (Spek, Reference Spek2009), and checkCIF (IUCr, 2014), crystallographers are well placed to solve, refine, and critically assess structures derived from powder diffraction.
The incorporation of computational chemistry tools (e.g. MOPAC, UNI force field) into the CSDS mirrors the trend toward further verification of crystal structures using periodic, dispersion-corrected, density functional theory calculations (Bruening et al., Reference Bruening, Alig, van de Streek and Schmidt2011), in that often the “fine detail” of the structure cannot be determined from the PXRD data alone.
ACKNOWLEDGEMENT
The ornidazole data were collected on the high-resolution powder diffractometer (BM16) at the ESRF in 1997 by Prof. Bill David (STFC ISIS Facility), Dr. Kenneth Shankland and Dr. Norman Shankland (CrystallografX Ltd.). We gratefully acknowledge support from the beamline staff during data collection. E.K. gratefully acknowledges financial support from both the CCDC and the University of Reading.
Supplementary Materials and Methods
The supplementary material for this article can be found at http://www.journals.cambridge.org/PDJ


