


I. INTRODUCTION
The presence of residual strain plays an important role in materials properties and potential failure mechanisms. The use of Li metal as an anode material for Li batteries could improve anode charge storage capacity by an order of magnitude relative to state-of-the-art graphite anodes (Lu et al., Reference Lu, Chen, Pan, Cui and Amine2018). However, the commercialization of Li metal anodes has been hindered because of safety and performance concerns related to poor morphological control during electrodeposition and stripping in the battery. One common failure mechanism in Li batteries is the tendency for Li metal to grow metallic dendrites (e.g., see Wu et al., Reference Wu, Yuan, Cheng, Bai, Li, Wu and Zhang2018). These dendrites, which often grow outward from the surface of a Li anode, may extend sufficient distances to puncture through the separator of a battery to the cathode side of the cell. This creates an electrical short circuit within the battery that can quickly progress into battery ignition (see Lu et al., Reference Lu, Chen, Pan, Cui and Amine2018). Recent works by Campbell et al. (Reference Campbell, Lee, Cho, Lee, Lee, Phatek and Hong2018), LePage et al. (Reference LePage, Chen, Kazyak, Chen, Sanchez, Poli, Arruda, Thouless and Dasgupta2019), and Herbert et al. (Reference Herbert, Hackney, Thole, Dudney and Phani2018a, Reference Herbert, Hackney, Thole, Dudney and Phani2018b) have suggested that Li metal can be work hardened. Cho et al. (Reference Cho, Xiao, Guo, Liu, Gao and Sheldon2020) demonstrated that stress evolution occurs in electroplated Li metal films as well. Wang et al. (Reference Wang, Zeng, Hong, Xu, Yang, Wang, Duan, Tang and Jiang2018), Kushima et al. (Reference Kushima, So, Su, Bai, Kuriyama, Maebashi, Fujiwara, Bazant and Li2017), and Cho et al. (Reference Cho, Xiao, Guo, Liu, Gao and Sheldon2020) all suggest that residual stress in Li films is likely to affect lithium morphology and may exacerbate dendrite growth. Therefore, understanding the conditions that lead to residual stress in Li metal anodes may be the key to understanding and preventing dendrites. Recently, Harrison et al. (Reference Harrison, Zavadil, Hahn, Meng, Elam, Leenheer, Zhang and Jungjohann2017) have shown that maintaining pressure on Li metal during deposition can improve Li morphology evolution and, thus, may reduce the likelihood of dendrite formation. It is reasonable to hypothesize that the degree of applied interfacial compression might also affect residual stress evolution in electrodeposited Li.
The mechanism by which applied interfacial compression leads to stress evolution in electrodeposited Li may be related to changes in morphology that occur with varied compression; such morphology changes are shown in Harrison et al. (Reference Harrison, Zavadil, Hahn, Meng, Elam, Leenheer, Zhang and Jungjohann2017). The dense network of Li grains that form during electrodeposition under applied pressure may lead to stress in Li particles by neighboring grains compressing each other in the constrained film. Alternatively, the solid electrolyte interphase (SEI) films, which arise during Li electrodeposition due to parasitic reactions between Li and the electrolyte, may be responsible for stress evolution in electrodeposited Li. Cho et al. (Reference Cho, Xiao, Guo, Liu, Gao and Sheldon2020) showed that the stress in Li films is caused by the interaction of the Li metal with SEI layers, and stress in SEI films has been demonstrated by Yoon et al. (Reference Yoon, Jurng, Abraham, Lucht and Guduru2018). Furthermore, data in Harrison et al. (Reference Harrison, Zavadil, Hahn, Meng, Elam, Leenheer, Zhang and Jungjohann2017) suggest that interfacial pressure may affect how the SEI film forms on Li metal. The arguments that SEI films are sensitive to interfacial compression and that stress in SEI films may cause stress in Li particles; further justify the hypothesis that interfacial compression may affect stress evolution in electrodeposited Li. Based on this hypothesis, it would follow that the presence of such stresses should manifest as a residual strain in the Li film.
To obtain supporting evidence for the hypothesis that Li may exhibit residual strain when electrodeposited in the presence of interfacial compression, X-ray diffraction (XRD) residual strain measurements were undertaken to determine if these strains could be detected and quantified by XRD. The magnitude of in-plane strain and its compressive or tensile nature may play an important mechanistic role in Li anode battery performance. As Li is highly reactive in air, we employed a special Be-dome specimen holder (Rodiguez et al., Reference Rodriguez, Boyle, Yang and Harris2008) for the XRD analysis. We also employed in-house protocols and analysis tools to characterize the presence of texture and residual strain. These Matlab-based software tools and protocols, nicknamed “Tilt-A-Whirl” (Rodriguez et al., Reference Rodriguez, Pearl, Van Benthem, Griego and Pillars2013), provide analysis methods for macrostrain determination via the sin2(ψ) technique. Herein, we present macrostrain results and the simultaneous texture analysis of Li films that have been electrodeposited with and without applied interfacial pressure. We detail the challenges of this unique sample preparation regarding alignment, while outlining the diffraction artifacts in the collected datasets and how they are dealt with when analyzing the data.
II. EXPERIMENTAL
A. Li film electrodeposition
Li was electrodeposited in pouch cells due to the ease of pressurizing and disassembling such cells. The pouch cells were assembled using 60-μm-thick Cu metal for the working electrode current collector and 750-μm-thick Li (Sigma-Aldrich, 99.9%) rolled onto 20-μm-thick Cu metal as the counter electrode. The working electrode was 12 mm in diameter and the counter electrode was 19 mm in diameter. Both electrodes were punched such that they had Cu leads attached, which were then spot welded to Ni leads. The Ni leads were prepared with a sealing tape on them such that they could be heat sealed through the edge of the pouch. The electrodes were separated by two Celgard 2325 separators within the pouch cell configuration soaked with 1 ml of ~2.8 M lithium bis(fluorosulfonyl)imide in 1,2-dimethoxyethane (2.8 M LiFSI DME) as an electrolyte. The electrolyte was prepared according to Qian et al. (Reference Qian, Henderson, Xu, Bhattacharya, Engelhard, Borodin and Zhang2015). 45 × 55 mm pockets were pressed into an Al-laminated battery pouch film (Pred Materials) to form the outside of the pouch cell using an Al-laminated film cup forming machine. The cells were fabricated in a dry room and were sealed under vacuum after inserting the electrolyte. The pouch cell setup is detailed in Figure 1.

Figure 1. Pouch cell assembly setup.
After construction, the pouch cells were compressed at 10 and 1000 kPa pressure and tested electrochemically. The cells tested at 1000 kPa (based on the area of the working electrode) were placed within a custom-designed constant pressure pneumatic compression tester. Calibration weights were used to compress the cells at 10 kPa. In both cases, the cells were compressed between mirror bright polished compression platens custom-machined to fit/hold the pouch cells; a potentiostat was connected to each cell to drive the electroplating process galvanostatically on the working electrode at 4 mA cm−2 to a charge capacity of 40 mAh cm−2, which corresponds to a Li film that would theoretically be 195 μm if it was fully dense. Note that the thickness of the actual electrodeposited Li films will be higher than this because they are unlikely to be fully dense, as discussed in Harrison et al. (Reference Harrison, Zavadil, Hahn, Meng, Elam, Leenheer, Zhang and Jungjohann2017). 40 mAh cm−2 is a high capacity for a battery anode, but it was chosen to provide a sufficient material to generate a reasonable XRD signal. Once electroplating was complete, the pouch cells were removed from the compression load cell, disassembled within an Ar-filled glove box, and the Li film was washed with dry 1,2-dimethoxyethane to remove residual salts from the electrolyte. The electrode and film were trimmed to fit within the Be-dome holder assembly.
B. XRD sample preparation
Figure 2 shows one of the Li films being loaded into the dome holder. The film was mounted according to protocols outlined in the previous work (Rodriguez et al., Reference Rodriguez, Boyle, Yang and Harris2008). Briefly, the Al base was prepared for the Li film sample by placing a glass pedestal into the central cavity of the base. The top surface of the Al base served as a reference surface for the sample height. The glass pedestal was shifted down below the reference surface by the expected thickness of the sample. Then, the Li film (with its underlying Cu substrate) was attached to the glass stub with a small amount of the double-sided carbon tape. Next, the Be-dome was seated into the base and sealed with the three set screws to establish the air-tight seal against the o-ring. The fully assembled Be-dome holder was removed from the glove box and loaded into the Bruker D8 diffractometer for XRD analysis. Figure 3 shows the configuration of the XRD setup on the Bruker D8 instrument. The diffractometer was configured with CuKα radiation, a Vantec 2000 area detector, and a texture cradle with an xyz translation stage. An incident beam mirror optic was employed to remove Kβ radiation and a 500-μm pinhole collimator was used to create a small beam at the sample.

Figure 2. Li film being loaded into the Be-dome holder (inside the glove box).

Figure 3. Experimental setup for XRD measurements of Li films within the Be-dome holder via Tilt-A-Whirl methodology (see text for details).
C. Strain measurement challenges
There were many challenges in regard to data collection of residual stain in the Li film samples. The four main challenges encountered are outlined in this section as well as their means of mitigation. The first challenge for the measurement was whether the weakly scattering Li metal film would generate sufficient intensity to detect XRD peaks. To this end, relatively thick (195 μm equivalent thickness based on the charge passed during electrodeposition if the deposited Li is assumed to be fully dense) Li films were used for the strain experiments.
The second major challenge encountered was concern that the Li films would not load flat and uniform in height when placed in the dome holder. This was primarily mitigated by optimizing the Li film sample to be as flat as possible and then only using data for strain determination where the tilt angle from the surface normal (referred to as either χ or ψ) was <55°. Note for the sake of simplicity, this tilt angle will henceforth be referred to as ψ within this manuscript so as to maintain consistency with the sin2(ψ) methodology (Noyan et al., Reference Noyan, Huang and York1995). This 0 < ψ < 55° angle restriction still allows for detection of residual strain, but avoids the use of significantly broadened/defocused diffraction peak profiles that result from X-ray beam elongation on the sample at high ψ tilt angles.
The third challenge was the possible overlap of Li peaks with peaks from either the Cu substrate or Be metal (from the dome). Overlapped Li peaks would create difficulties in detecting the subtle peak shifts associated with residual strain. To assess this concern, the Be-dome holder was prepared and run on the diffractometer using just the Cu substrate material in the dome. Then, the Be-dome was removed, and the analysis was preformed again on the Cu substrate alone. This helped establish where the Cu and Be peaks would show up in the patterns. (Note due to the significant height of the Be-dome above the sample, the Be peaks tended to be observed with a substantial positive shift in 2θ.) The 2θ locations for the Cu and Be peaks were then compared with the expected locations for Li metal reflections and a determination was made as to whether any Li peaks would be sufficiently isolated to be used in residual strain determination. Additionally, a LaB6 standard (NIST 660) was prepared and run in the Be-dome holder to determine if there was any variation in peak location with ψ angle for an effectively zero-strain powder standard. Figure 4 shows a sin2(ψ) plot for the LaB6 (311) peak at ~75.8° 2θ. As one can see, the Δd/d o values change very little with increased ψ tilt. The slope of this curve (equivalent to a strain value) was determined to be −0.019(5)% (i.e., −0.019 ± 0.005%) which is very close to zero (i.e., unstrained condition) and confirms suitable alignment of the diffractometer for residual strain measurements. The 0.019% value was taken as the instrument offset for strain and was used to correct any measured strain values obtained on film samples. The strain error value of ±0.005% was based on the fit and deviation of the straight line to the observed Δd/d o values. The plotted error bars for the Δd/d o values were taken directly from the profile fitting routine but were not employed in the strain error calculation. Therefore, the reported strain error value is small and may underestimate the uncertainty. For comparison purposes, identical fitting and reporting processes were performed for all sin2(ψ) plots reported herein, with the awareness that the reported strains may have larger uncertainty.

Figure 4. Residual strain calibration using the LaB6 standard shows a slope near zero.
The fourth challenge regarding this strain measurement was alignment of the film sample height and beam location on the Li film. Sample height is particularly important in strain measurements as offset from the eucentric height can result in a systematic artifact that mimics the presence of strain via a slope change in the sin2(ψ) plot. Typically, this alignment is performed by using a laser/video system configured on the D8 diffractometer; the sample would be adjusted in xy translation to select the location of the analysis, and then the sample height would be set by bringing the laser spot location and defined cross-hair location on the video image into coincidence. The use of the Be-dome holder prevents this alignment procedure because the dome impedes the view of the laser on the surface of the sample. To overcome this challenge, the base of the Be-dome holder was first mounted on the cradle, pre-aligned using a mock-up sample, and the xyz stage locations recorded. This process allowed for an evaluation of the ideal positioning of the base, as it was loaded into the cradle mounting. Next, the base was removed from the cradle and the Li film test specimen was loaded into the Be-dome holder (as described earlier). The assembled holder was again mounted onto the D8 instrument and driven to the predetermined locations in xyz. The final alignment step employed the measurement of a single Li peak. An Iterative measurement of the Li peak location in 2θ and adjustments in the sample height via the z-axis of the transition stage were employed to correct any minor height variation between the actual sample and that of the mock-up test part. After this final calibration step, the full data collection for the Tilt-A-Whirl process was executed.
III. RESULTS AND DISCUSSION
Figure 5 illustrates a series of XRD patterns as a function of ψ tilt for the 1000 kPa prepared Li film. Although the Tilt-A-Whirl data collection routine obtains data from 60 ϕ (spindle) rotations at any given ψ tilt angle (Rodriguez et al., Reference Rodriguez, Pearl, Van Benthem, Griego and Pillars2013), it is often useful to obtain an initial assessment of the degree of texture within a sample by merging the 60 ϕ-scan patterns from each ψ tilt into a single scan. We refer to this series of θ–2θ scans incremented by ψ as the “ϕ-merged” scans. Such data are presented in Figure 5. The ψ = 0 scan (bottom pattern) represents the normal (out-of-plane) condition for the sample and shows diffraction intensity from planes aligned with the film surface. As the ψ angle increases, one observes peaks diffracted from planes that display increasing tilt away from the surface, with the extreme case (not shown) at ψ = 90 for planes fully perpendicular to the film surface. The maximum ψ tilt angle for our experiment was limited to 78°. Powder Diffraction File (PDF) entries (Gates-Rector and Blanton, Reference Gates-Rector and Blanton2019) for the various observed phases are shown below the XRD scans. The stick patterns are as follows: Be metal (PDF entry 00-022-0111), Cu metal (PDF entry 00-004-0836), and Li metal (PDF entry 00-015-0401). The (hkl) labels for the various reflections are listed at the top of Figure 5. Note from the ψ = 0 scan that the strongest peak in this pattern is from the Cu (200) reflection. This indicates substantial out-of-plane preferential orientation from the Cu substrate. Likewise, note that with increased ψ tilt angle, we observe variation in relative intensities for the Cu peaks, again suggesting significant texture for the substrate. The presence of the Cu peaks confirms that the beam has fully penetrated through the Li film to the underlying substrate.

Figure 5. ϕ-merged scans for the 1000 kPa Li film on Cu (see text for details).
We also observe evidence of the Li film presence from the various Li peaks in the data. The Li (110), the 100% peak for the body-centered cubic Li metal, is easily detected at ~36° 2θ. The intensity of this peak does vary with ψ tilt, but not to the same degree as is observed for the Cu peaks. Other Li peaks are observed in the patterns, but the intensity of these peaks is very low. Specifically, the Li (211) peak at ~65° 2θ is highlighted in Figure 5. Though it is difficult to see from the scale of the figure, there are detectable Li (211) peaks present in the data.
Figure 6 shows a zoomed-in view of the Li (211) ϕ-merged peaks from ψ = 0–54°. This zoomed view shows that the Li peaks have well-defined profiles and reveal a gradual shift to higher 2θ angle with increasing ψ tilt. These Li peaks were fit using a Pearson-VII profile function and the resulting d-spacing values were employed in the sin2(ψ) measurement to determine residual strain in the Li film.

Figure 6. Zoomed range for ϕ-merged Li (211) peaks from ψ = 0–54°. These peak profiles were fit and the resulting d-spacing values were used in the sin2(ψ) strain determination of the 1000 kPa prepared Li film.
It is worth pointing out that the Be peak locations presented for PDF entry 00-022-0111 (see Figure 5) have been substantially shifted to higher 2θ angle so as to align them to the observed peaks in the ϕ-merged patterns. The Be peaks result from diffraction of the Be-dome surface which is positioned almost 1 cm above the specimen. This substantial displacement of the Be metal above the aligned height of the Li film results in the Be peaks shifting to much higher 2θ angles than expected. The Be peak locations were confirmed based on the prior test runs performed on the Be-dome holder with only the Cu substrate. It was easy to identify the Be peaks from this prior work as they were new reflections, observed only when the dome was in place on the holder. Note also, that one characteristic of the Be peaks is the near-constant peak width as a function of ψ (e.g., the Be (101) peak ~55° 2θ). This is in contrast to the Cu and Li peaks and speaks to the curved nature of the Be-dome which is less subject to beam defocusing as the sample is tilted. This additional feature made for clear diagnosis of all the peaks in the pattern and their origin.
A. Detection of residual strain in Li films
As mentioned earlier, the Li (211) peak was selected for use in the residual strain determination of the 1000 kPa film because it (1) was relatively isolated and unobstructed by any other peaks in the patterns, (2) showed sufficient intensity for peak fitting and employment in the sin2(ψ) technique, and (3) was at a reasonably high angle in 2θ to improve sensitivity to small changes in d-spacing that are required for the strain determination method. Figure 7 shows the resulting Δd/d o vs. sin2(ψ) for the 1000 kPa film. In this analysis, it is assumed that the film has a bi-axial stain behavior (common for thin films). Therefore, the out-of-plane d-spacing value for the Li (211) peak has been assigned as the d o value. Based on this framework for strain determination, Figure 7 clearly shows a negative slope, indicative of an in-plane compressive strain for the Li film. The magnitude of the strain was measured as −0.085(3)% and after correction for the LaB6 offset of 0.019% was determined to be −0.066(6)% compressive in-plane strain.

Figure 7. Sin2(ψ) plot confirming the presence of residual in-plane strain in a Li film formed under 1000 kPa pressure.
While this strain value is not a very large magnitude, it does register as a detectable strain based on assessments of strain sensitivity from the Tilt-A-Whirl method (see Rodriguez et al., Reference Rodriguez, Pearl, Van Benthem, Griego and Pillars2013). It is also worth noting that this strain value, derived from 2θ locations of the Li (211) peak, was extracted from fits of the ϕ-merged scans; each of these individual ψ scans represents the integration of 60 observed patterns. The large quantity of measured data employed to determine 2θ peak locations used in the strain plot does serve to improve sensitivity to weak strain signals. Additionally, it can often help overcome challenges posed by film texture to the measured intensities with ψ tilt. To this end, it was also possible to generate a similar sin2(ψ) plot for the Cu (220) peak at ~74° 2θ. This plot, shown in Figure 8, reveals a value of residual strain (after correction) of +0.023(7)% which suggests that the Cu substrate is either essentially unstrained or perhaps displays a slight tensile in-plane strain. As a check, an additional Li film was prepared at a very mild loading (10 kPa) and was analyzed in similar fashion. Sin2(ψ) analysis of this film (not shown) revealed a slope of −0.003(7)% after correction, i.e., effectively no detectable in-plane strain. Therefore, taking these results together, detection and quantification of subtle strain effects present in Li films have been demonstrated though our technique.

Figure 8. Sin2(ψ) plot for the Cu (220) peak in the 1000 kPa prepared sample. The weakly positive slope suggests little or no residual strain present in the Cu substrate.
Precise conversion of these strain values to stress requires knowledge of the crystallographically dependent X-ray elastic constants, beyond the scope of the current work. However, it is possible to provide only an approximate estimate of the stress values using the published untextured Young's modulus value of Li of ~5 GPa, as reported by Tariq et al. (Reference Tariq, Ammigan, Hurh, Schultz, Liu and Shang2003). For this modulus, a strain value of 0.066% corresponds to a stress of 3.4 MPa. It is difficult to determine whether 3.4 MPa is an appreciable fraction of the yield strength of Li because yield strength measurements in the literature vary significantly. The yield strength of Li has been reported to range from <1 MPa (see Tariq et al. (Reference Tariq, Ammigan, Hurh, Schultz, Liu and Shang2003), Lapage et al. (Reference LePage, Chen, Kazyak, Chen, Sanchez, Poli, Arruda, Thouless and Dasgupta2019), and Schultz (Reference Schultz2002), for examples) to ~100 MPa, as shown in Xu et al. (Reference Xu, Ahmad, Aryanfar, Viswanathan and Greer2017). Furthermore, Voyiadjis and Yaghoobi (Reference Voyiadjis and Yaghoobi2017) suggested that the yield strength is grain-size dependent. The discrepancies in the literature describing the yield strength of Li may arise because there is very steep work-hardening behavior in the early strain regime, which may cause precise determination to be difficult. Additionally, the yield strength of pristine Li may differ from that of electrodeposited Li, which is coated with SEI. Recently, Zhang et al. (Reference Zhang, Wang, Harrison, Roberts and Harris2020) have fitted experimental data with a model to show that the yield strength of electrodeposited Li with SEI on it is around 16 MPa.
B. Film texture
While the focus of this work has been detection of residual strain, the documentation of observed texture in the sample can help better understand and predict mechanical performance and yield additional insight into the deposition process. Figure 9 illustrates the pole figures obtained from the underlying Cu substrate metal for the 1000 kPa prepared sample. The Cu (111) and Cu (200) pole figures are presented. The pole figures indicate a strong bi-axial texture for the Cu substrate. The (200) pole figure (Figure 9 – right) shows very strong intensity in the center of the pole figure (i.e., 0° ψ), confirming a strong a-axis out-of-plane preferred orientation as was suggested in the ϕ-merged data in Figure 5. The Cu (111) pole figure is shown in Figure 9 (left) and reveals a fourfold symmetry with strong intensity spots every 90° in ϕ and tilted from the surface normal at 54° ψ. The presence of the well-isolated fourfold intensities at 54° ψ confirms the in-plane bi-axial texture of the Cu substrate.
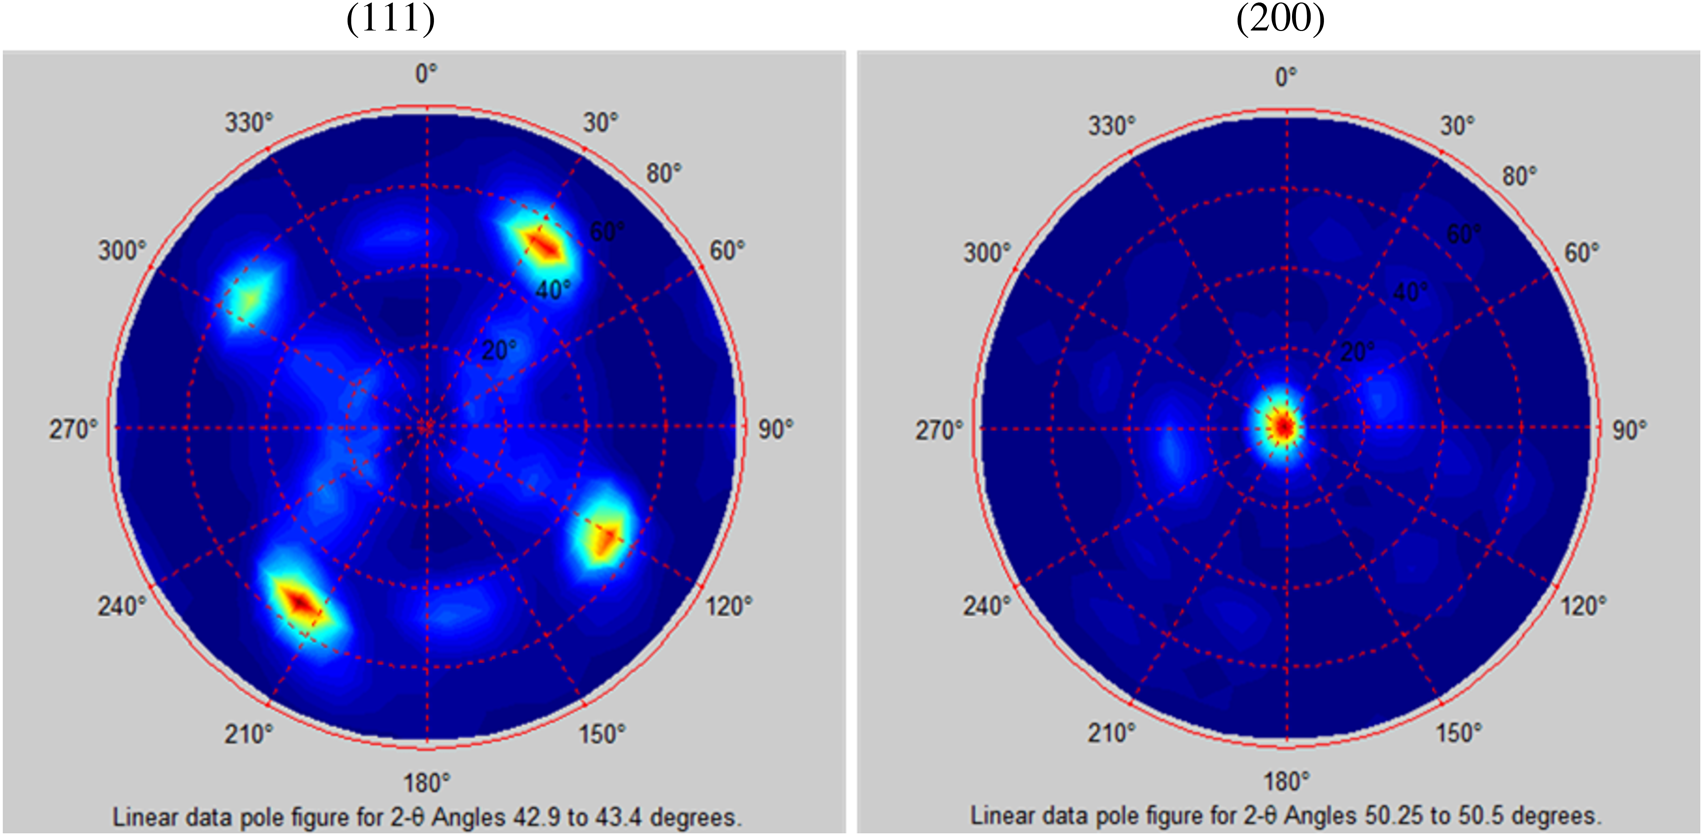
Figure 9. Pole figures for the Cu substrate from the 1000 kPa prepared sample, left (111) and right (200), verifying the a-axis out-of-plane preferred orientation and bi-axial in-plane orientation.
Pole figures obtained from the Li metal for the 1000 kPa prepared film are illustrated in Figure 10. The (110) and (200) pole figures are presented. The pole figures indicate a mild texture for the Li film. The (110) pole figure (Figure 10 – left) shows a dominant intensity in the center of the pole figure (i.e., ~0° ψ), but the intensity is spread out over almost 20° ψ and the central intensity is not fully coincident with ψ = 0°. This illustrates a much higher mosaic spread in the (110) orientation. This is consistent with the ϕ-merged data in Figure 5 which shows a more uniform relative intensity as a function of ψ. There looks to be an additional ring of intensity at ~60° ψ in the Li (110) pole figure. This ring is not quite continuous and shifts slightly downward on the figure by the same ~10° ψ offset. The presence of additional intensity at the ~60° ψ tilt is self-consistent with the (110) interplanar angles for additional members of the (110) family of planes (Cullity, Reference Cullity1978). The presence of a ring of intensity indicates a fiber texture for the in-plane grain orientation. Likewise, for the Li (200) pole figure (Figure 10 – right), one observes a continuous ring of intensity at ~45° ψ. This matches the expected interplanar angle for a (110) out-of-plane oriented film. Note also how the ring is slightly shifted downwards in the pole figure and not perfectly centered about the ψ = 0° center of the pole figure image. This also confirms that the (110) out-of-plane orientation for Li is not ideally positioned normal to the surface. The broadened distribution of the (200) ring at ~45° ψ also indicates the mosaic spread of the preferred orientation and helps support the assessment that the Li film is only mildly textured. The Li (200) peak is actually quite close to the Be (002) peak, as shown in Figure 5. Care was taken to limit the range of integrated 2θ intensity for the Li (200) pole figure so as to not overlap with the neighboring Be artifact peak, thus avoiding bleed-in intensity from other diffraction planes.

Figure 10. Pole figures for Li (110) – left and Li (200) – right showing mild (110) out-of-plane preference and in-plane fiber texture (data are for the 1000 kPa prepared sample).
C. Origin of compressive strain in Li films
The question naturally rises regarding the origin of the residual strain in the Li film. If one considers the geometry of the pouch cell in the compression tester, the Li film would be under compression between the separator and the Cu substrate, while the Li film is depositing and growing on the Cu substrate. With this being the case, it might seem reasonable to think there would be a tensile in-plane strain in the Li film after deposition due to the presence of compression from the compression tester at right angles to the Li film surface. Our results show the opposite, i.e., in-plane compressive strain. If one considers texture and templating from the Cu substrate as a means of driving the observed residual strain, there may be a small templating effect from the bi-axially oriented Cu substrate to potentially drive the Li to deposit with a (110) out-of-plane preference. However, the effect is mild at best, and the Li film shows no in-plane dependency as illustrated by the observed fiber texture. In addition, if the templating were the mechanism for the development of residual strain, one would expect such strains to exist in films deposited using either low- or high-pressure conditions. Therefore, it does not appear that texture plays a major role in the origin of the observed residual strain. Nor does the Cu substrate look to impact Li regarding the formation of residual strain, as the Cu substrate shows little or no strain presence in and of itself.
The fact that a compressive in-plane residual strain is observed for the Li film indicates that the Li metal crystallites are being constrained as they attempt to grow and expand in the plane of the film. A possible means of geometric constraint on these Li crystallites may be caused by the SEI layer, which may slow or hinder growth of the Li grains during electrodeposition. The presence of this external SEI layer on the surface of each Li grain may cause the buildup of compressive strain in the Li crystallites during the deposition process and under the conditions of an external load. The observation of compressive stress in electrodeposited Li films is not without precedent. Cho et al. (Reference Cho, Xiao, Guo, Liu, Gao and Sheldon2020) demonstrated that stress in electrodeposited Li is caused by the interaction with the SEI layer, and Yoon et al. (Reference Yoon, Jurng, Abraham, Lucht and Guduru2018) showed that SEI films on Li can exhibit compressive stress. However, it remains unclear from these arguments why only the Li electrodeposited at 1000 kPa exhibited residual strain (and not the Li electrodeposited at 10 kPa) since SEI forms under both applied compression conditions. In fact, Harrison et al. (Reference Harrison, Zavadil, Hahn, Meng, Elam, Leenheer, Zhang and Jungjohann2017) showed that SEI forms more copiously under low applied compression forces.
There are at least two possible explanations for why only the Li electrodeposited at high applied interfacial compression (1000 kPa) exhibits residual strain. First, Harrison et al. (Reference Harrison, Zavadil, Hahn, Meng, Elam, Leenheer, Zhang and Jungjohann2017) suggested that SEI formation is sensitive to the degree of interfacial compression. It is possible that the SEI-Li interfacial structure is only strained under larger applied compressive forces such that the SEI only exerts stress on Li particles when formed during Li electrodeposition at high applied interfacial compression. Second, it is important to note that Li tends to grow in denser morphology when electrodeposited under pressure, as is also shown in Harrison et al. (Reference Harrison, Zavadil, Hahn, Meng, Elam, Leenheer, Zhang and Jungjohann2017). This denser morphology may be related to a mechanical overpotential associated with pressure at the interface, which provides an energy barrier preventing growth in the direction of the applied compression; instead, this overpotential provides an incentive for Li to grow in the lateral direction perpendicular to the applied compression and may lead to much denser films (Zhang et al., Reference Zhang, Wang, Harrison, Jungjohann, Boyce, Roberts, Attia and Harris2019). In the films electrodeposited at 1000 kPa, we hypothesize that the dense Li crystallites and the incentive to grow laterally may cause neighboring crystallites to compress one another and locally confine the film so as to enable a compressive in-plane strain. The presence of this residual strain is likely to change how Li electrodeposits and is stripped and may possibly even have the adverse effect of contributing to dendrite formation, as suggested by Wang et al. (Reference Wang, Zeng, Hong, Xu, Yang, Wang, Duan, Tang and Jiang2018), Kushima et al. (Reference Kushima, So, Su, Bai, Kuriyama, Maebashi, Fujiwara, Bazant and Li2017), and Cho et al. (Reference Cho, Xiao, Guo, Liu, Gao and Sheldon2020). The XRD technique demonstrated herein to detect residual strain in electrodeposited Li metal enables further study to understand the conditions that lead to residual strain in Li anodes.
IV. CONCLUSIONS
We have demonstrated a means of determining residual strain in Li films via our Tilt-A-Whirl XRD characterization method which enables the detailed sin2(ψ) analysis as well as details of texture. The Be-dome allows for isolation of the Li film during XRD measurement to prevent reaction of the sample with the atmosphere. Li films exposed to high external pressure during cycling demonstrate a detectable in-plane compressive strain after removal from the pouch cell. Li films cycled at low pressure showed low or no detectable strain upon analysis after removal from the pouch cell. It is worth emphasizing that the interpretations and conclusions of this work are limited in scope due to the small number of samples analyzed. More samples with additional deposition conditions need to be tested for to establish a more comprehensive evaluation of residual strain in Li films.
ACKNOWLEDGEMENTS
This work was supported by the Laboratory Directed Research and Development program at Sandia National Laboratories, a multimission laboratory managed and operated by the National Technology and Engineering Solutions of Sandia, LLC., a wholly owned subsidiary of Honeywell International, Inc., for the U.S. Department of Energy's National Nuclear Security Administration under contract DE-NA-0003525. B.L.B. acknowledges lab assistance provided by Zachary Casias. The authors acknowledge Kevin Zavadil for useful discussions regarding the impact of SEI on strain behavior.


