I. INTRODUCTION
Scapolite is the name of a group of volatile-bearing framework aluminosilicate minerals, (Na,Ca,K)4[(Al,Si)3Al3Si6O24](Cl,CO3,SO4), that occur in a variety of metamorphic and igneous rocks. They exhibit compositional and structural complexities. Scapolites store volatiles in the lower crust and upper mantle (Lovering and White, Reference Lovering and White1969), and are indicators of the activities of the volatile components (Moecher and Essene, Reference Moecher and Essene1990, Reference Moecher and Essene1991; Jiang et al., Reference Jiang, Palmer, Xue and Li1994; Kullerud and Erambert, Reference Kullerud and Erambert1999). The volatile components in scapolite indicate that they may play a natural role in the capture and storage of greenhouse gases.
Ideal solid solutions between end members in a binary system generally give rise to simple relations between structural parameters, including unit-cell parameters and chemical compositions. Hitherto, no simple relation is observed for scapolite solid solutions because of antiphase domain boundaries (APBs), Ca–Na, Cl–CO3, and Al–Si order across the series. Nevertheless, scapolite-group minerals are excellent materials to investigate the relations between compositional and structural parameters. The tetragonal unit-cell parameters for scapolite are independent of the space group chosen (either I4/m or P42/n).
In this study, based on 27 samples across the scapolite series, electron microprobe analyses (EMPA), and unit-cell parameters obtained from synchrotron high-resolution powder X-ray diffraction (HRPXRD) and Rietveld structure refinements using space group P42/n indicate that there are two series: Me 0–75 and Me 75–100 with a discontinuity at Me 75. Across the series, the composition is given as Me% = [Ca/(Ca + Na + K)] × 100. A maximum c value occurs at Me 37.5, midway between Me 0–75, where maximum Al–Si, Ca–Na, and Cl–CO3 order were observed (Hassan and Buseck, Reference Hassan and Buseck1988; Antao and Hassan, Reference Antao and Hassan2011a, Reference Antao and Hassan2011b).
Scapolite forms solid solutions between the extreme end-members marialite, Na4[Al3Si9O24]Cl = Me 0 and meionite, Ca4[Al6Si6O24]CO3 = Me 100 (Deer et al., Reference Deer, Howie and Zussman1992). A near end-member silvialite, Ca4[Al6Si6O24]SO4, is known (Teertstra et al., Reference Teertstra, Schindler, Sherriff and Hawthorne1999). Scapolite forms two series that meet at end-member Me 75, Na2Ca6[Al10Si14O48](CO3)2, and the composition varies by replacement of [Na4 · Cl]Si2 for [NaCa3 · CO3]Al2 between Me 0–75, and by the replacement of [NaCa3 · CO3]Si for [Ca4 · CO3]Al between Me 75–100 (Evans et al., Reference Evans, Shaw and Haughton1969; Hassan and Buseck, Reference Hassan and Buseck1988; Deer et al., Reference Deer, Howie and Zussman1992). Chemical analyses of scapolite are represented by two straight lines that meet at Me 75, indicating two series (see Fig. 12 in Hassan and Buseck, Reference Hassan and Buseck1988; or Fig. 188 in Deer et al., Reference Deer, Howie and Zussman1992). The Ca–Na cations disorder on heating, but the Cl–CO3 order remains at 900 °C (Antao and Hassan, Reference Antao and Hassan2002, Reference Antao and Hassan2008a, Reference Antao and Hassan2008b). The Me 37.5 (midway between Me 0–75) composition, Na5Ca3[Al8Si16O48]Cl(CO3), has a ratio of clusters [Na4 . Cl]3+:[NaCa3 . CO3]5+ = 1:1, where complete cluster order occurs, and full Al–Si order is expected. Me 37.5 is where the maximum intensities occur for the type-b (h + k + l = odd) reflections (Lin and Burley, Reference Lin and Burley1973a, Reference Lin and Burley1973b, Reference Lin and Burley1973c; see Fig. 2 in Hassan and Buseck, Reference Hassan and Buseck1988). The crystal structure of a composition close to Me 37.5 was obtained by Antao and Hassan (Reference Antao and Hassan2011a). Complete Al–Si order was observed, and a maximum value occurs for the c parameter.
Some studies divided the scapolite series into three subseries at Me 20–25 and Me 60–67 based on discontinuities in the c unit-cell parameter (e.g., Sokolova et al., Reference Sokolova, Kabalov, Sherriff, Teertstra, Jenkins, Kunath-Fandrei, Goetz and Jäger1996, Reference Sokolova, Gobechiya, Zolotarev and Kabalov2000; Teertstra and Sherriff, Reference Teertstra and Sherriff1996; Zolotarev, Reference Zolotarev1996; Sherriff et al., Reference Sherriff, Sokolova, Kabalov, Teertstra, Kunath-Fandrei, Goetz and Jäger1998, Reference Sherriff, Sokolova, Kabalov, Jenkins, Kunath-Fandrei, Goetz, Jäger and Schneider2000; Teertstra et al., Reference Teertstra, Schindler, Sherriff and Hawthorne1999; Zolotarev et al., Reference Zolotarev, Petrov and Moshkin2003; Hawthorne and Sokolova, Reference Hawthorne and Sokolova2008; Sokolova and Hawthorne, Reference Sokolova and Hawthorne2008). At these two discontinuities, no significant changes occur in the chemical composition or unit-cell parameters, as observed in this study. The discontinuity in chemical composition at Me 75 is well-established. One reason for this study is to identify a structural cause for the chemical discontinuity at Me 75.
Using transmission electron microscopy (TEM) and the type-b reflections that distinguish between the two possible space groups for scapolite, three subseries were identified (Seto et al., Reference Seto, Shimobayashi, Miyake and Kitamura2004). Series Me 0–18 and Me 90–100 have space group I4/m, and series Me 18–90 has space group P42/n. At Me 18 and Me 90, no significant change occurs in composition or unit-cell parameters.
The division of the series into two or three and their boundaries is debatable, and is examined in this study. Where the scapolite series is divided into two that meet at Me 75, exchange reactions (given above) show how the composition changes, which is not the case where the series is divided into three. Only at Me 75, both the chemical composition and unit-cell parameters consistently show a discontinuity, as is illustrated in this study.
II. EXPERIMENTAL
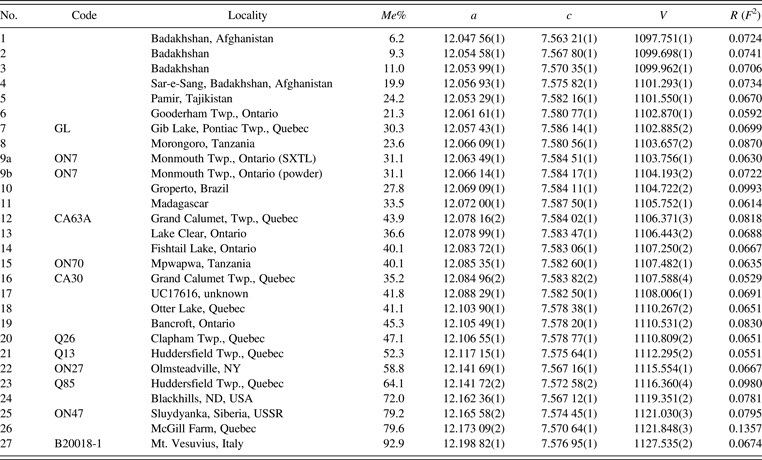
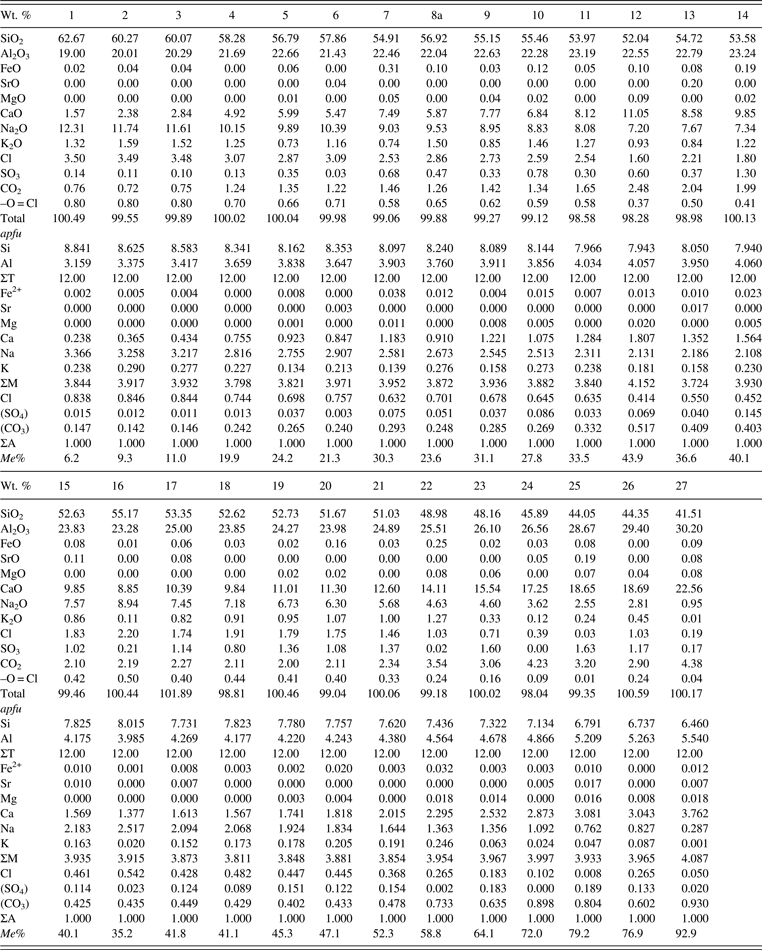
Twenty-seven scapolite samples between Me 6–93 from various localities were used in this study (Table I). Their descriptions and compositions were given by Shaw (Reference Shaw1960a, Reference Shaw1960b), Evans et al. (Reference Evans, Shaw and Haughton1969), and Lin and Burley (Reference Lin and Burley1973a, Reference Lin and Burley1973b, Reference Lin and Burley1973c) for some samples (Table I). The samples were analyzed using a JEOL JXA-8200 electron microprobe. The JEOL operating program on a Solaris platform was used for ZAF correction and reducing the data. The wavelength-dispersive operating conditions were 15 kV accelerating voltage, 20 nA beam current, and a beam diameter of 5 μm, and used various standards. The crystals are homogeneous based on optical observations and microprobe analyses of eight spots for each sample (≈0.2 mm in diameter). The 27 chemical compositions are given (Table II).
Table I. Scapolite samples: localities, Me%, unit-cell parameters, and R (F 2) values.

All of the samples were refined in space group P42/n. 9a was obtained as a large crystal and 9b was obtained as a powdered sample. Monochromatic wavelengths used were 0.402 43(2) Å (samples no.8, 10, 12, 13, 14, 15, 16, and 26); 0.402 41(2) Å (samples no. 7, 9b, 11, 19, 20, and 24); 0.414 17(2) Å (samples no.1 and 26); 0.412 22(2) Å (samples no. 2 and 3), 0.412 204(2) Å (samples no. 4 and 5); 0.412 26(2) Å (samples no. 9a and 17); 0.412 20(2) Å (sample no. 6).
Table II. Chemical composition and Me% for scapolite samples.
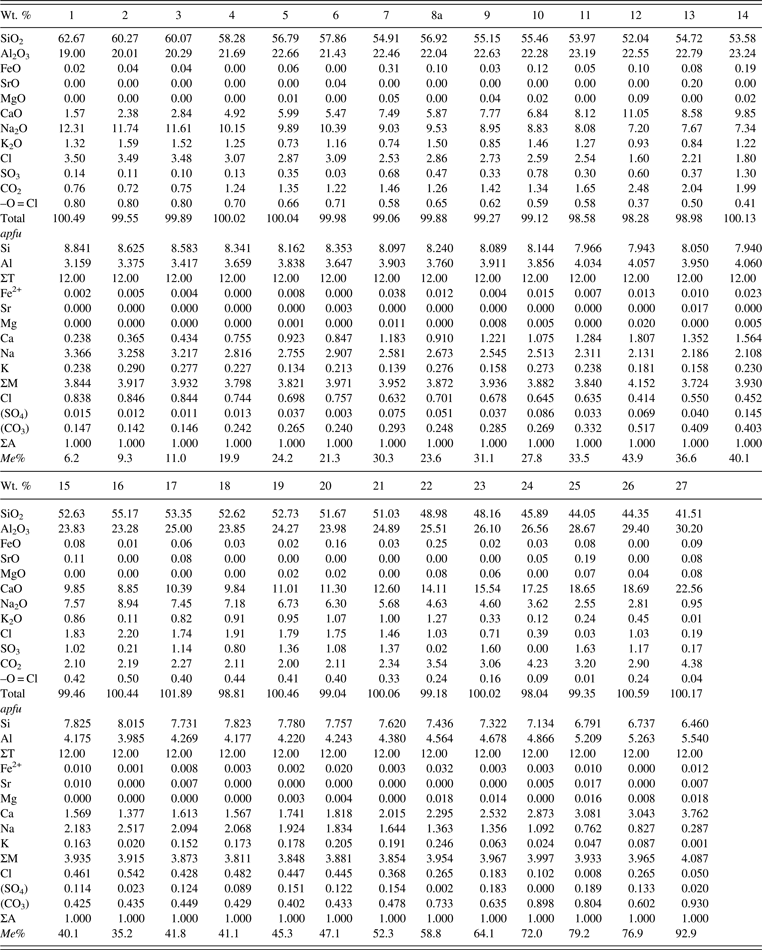
Me% = [Ca/(Ca + Na + K)] × 100; Analyses 11, 19, 21, and 24 are taken from Evans et al. (Reference Evans, Shaw and Haughton1969) as the samples were used up. CO2 was calculated from stoichiometry assuming ΣA = 1. The apfu were calculated based on Si + Al = 12.
Crystals of scapolite (≈0.2 mm in diameter) were handpicked under a binocular microscope, and finely crushed in an agate mortar and pestle for synchrotron high-resolution powder X-ray diffraction (HRPXRD) experiments that were performed at beamline 11-BM, Advanced Photon Source, Argonne National Laboratory. Each sample was loaded into a Kapton capillary (0.8 mm internal diameter) and rotated during the experiment at a rate of 90 rotations per second. These data were collected to a maximum 2θ of about 40° with a step size of 0.0005° and a step time of 0.1 s per step. A silicon and alumina NIST standard (ratio of ⅓ Si: ⅔ Al2O3 by weight) was used to calibrate the 12-analyzer crystal detector system response, zero offset, and determine the wavelength used in the experiment (see Table I). Additional details of the experimental set-up and data analyses were given (Antao et al., Reference Antao, Hassan, Wang, Lee and Toby2008; Lee et al., Reference Lee, Shu, Ramanathan, Preissner, Wang, Beno, Von Dreele, Ribaud, Kurtz, Antao, Jiao and Toby2008; Wang et al., Reference Wang, Toby, Lee, Ribaud, Antao, Kurtz, Ramanathan, Von Dreele and Beno2008).
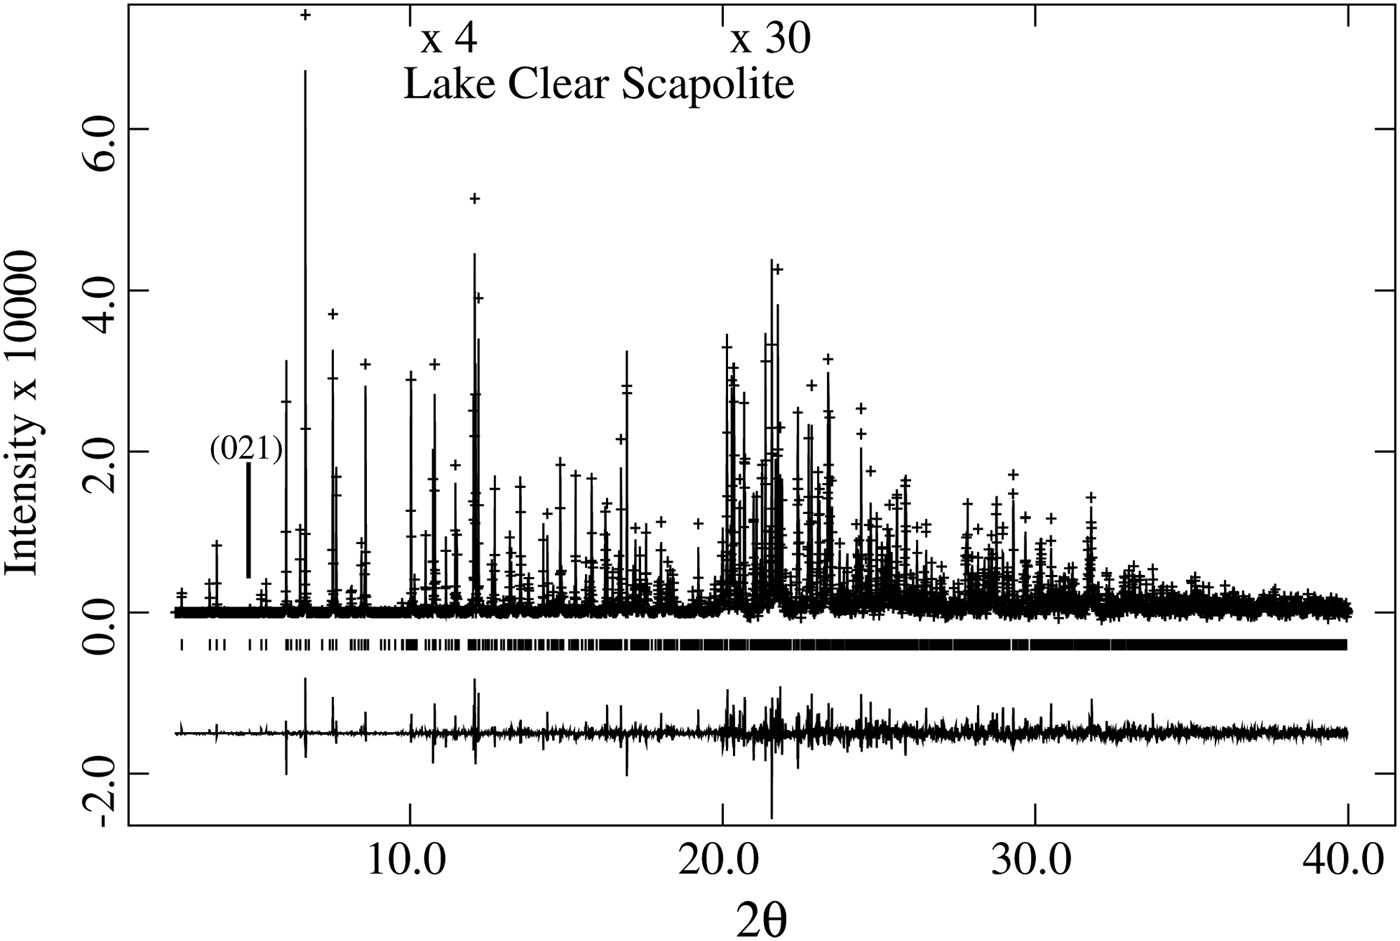
The unit-cell parameters for the 27 samples were obtained using the Rietveld method (Rietveld, Reference Rietveld1969), as implemented in the GSAS program (Larson and Von Dreele, Reference Larson and Von Dreele2000), and using the EXPGUI interface (Toby, Reference Toby2001). Structure refinements were conducted by varying parameters in the following sequence: scale factor, background (shifted Chebyschev), cell, zero shift, profile (type-3), atom positions, and isotropic displacement parameters. The chemical composition was used to fix the site occupancies and they were not refined. Finally, all of the other variables were refined simultaneously until convergence was achieved. Data for unit-cell and compositional parameters are reported, including the Rietveld R (F 2) values (Tables I and II). With these data, equations and correlations factors (R 2) for structural variations can easily be obtained, hence they are not reported. Structural parameters obtained by HRPXRD for a few scapolite samples were reported (Antao and Hassan, Reference Antao and Hassan2008a, Reference Antao and Hassan2008b, Reference Antao and Hassan2011a, Reference Antao and Hassan2011b; Antao et al., Reference Antao, Hassan, Wang, Lee and Toby2008). As an example, a typical Rietveld fit of a trace is shown in Figure 1 and the following Rietveld statistics were obtained [R (F 2) = 0.0688, wR p (fitted) = 0.0710, χ 2 = 2.338, N obs = 2959, 2θ range = 2.5–40°, and λ = 0.402 43(2)].
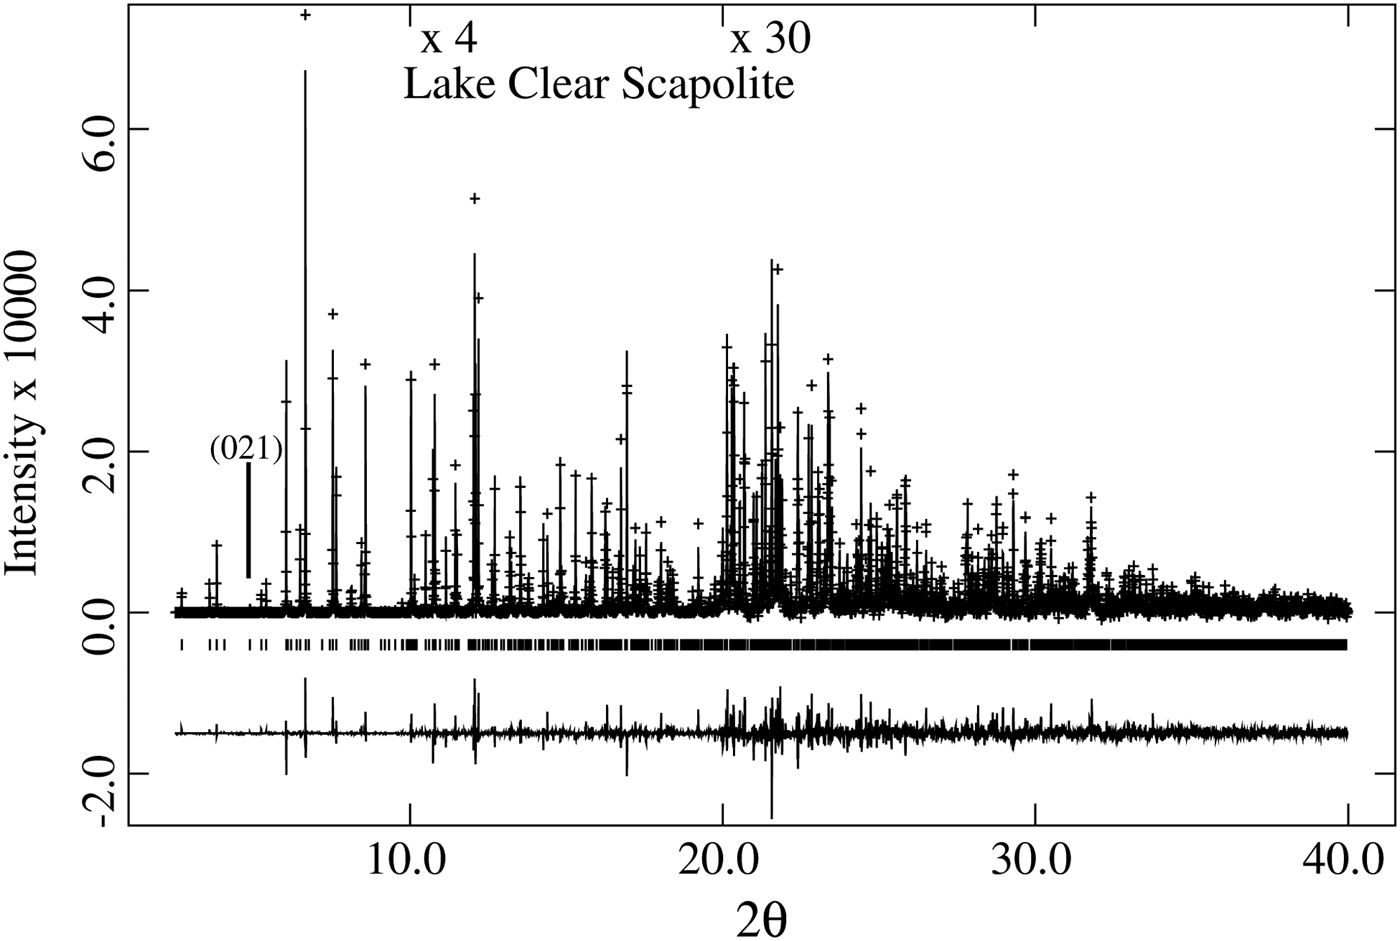
Figure 1. HRPXRD trace for Lake Clear scapolite, Me 37.5, at 25 °C, together with the calculated (continuous line) and observed (crosses) profiles. The difference curve (I obs–I calc) is shown at the bottom. The short vertical lines indicate allowed reflection positions. The intensities for the trace and difference curve that are above 10° and 20° 2θ are scaled by factors of ×4 and ×30, respectively. The (021) reflection is indicated.
III. RESULTS AND DISCUSSION
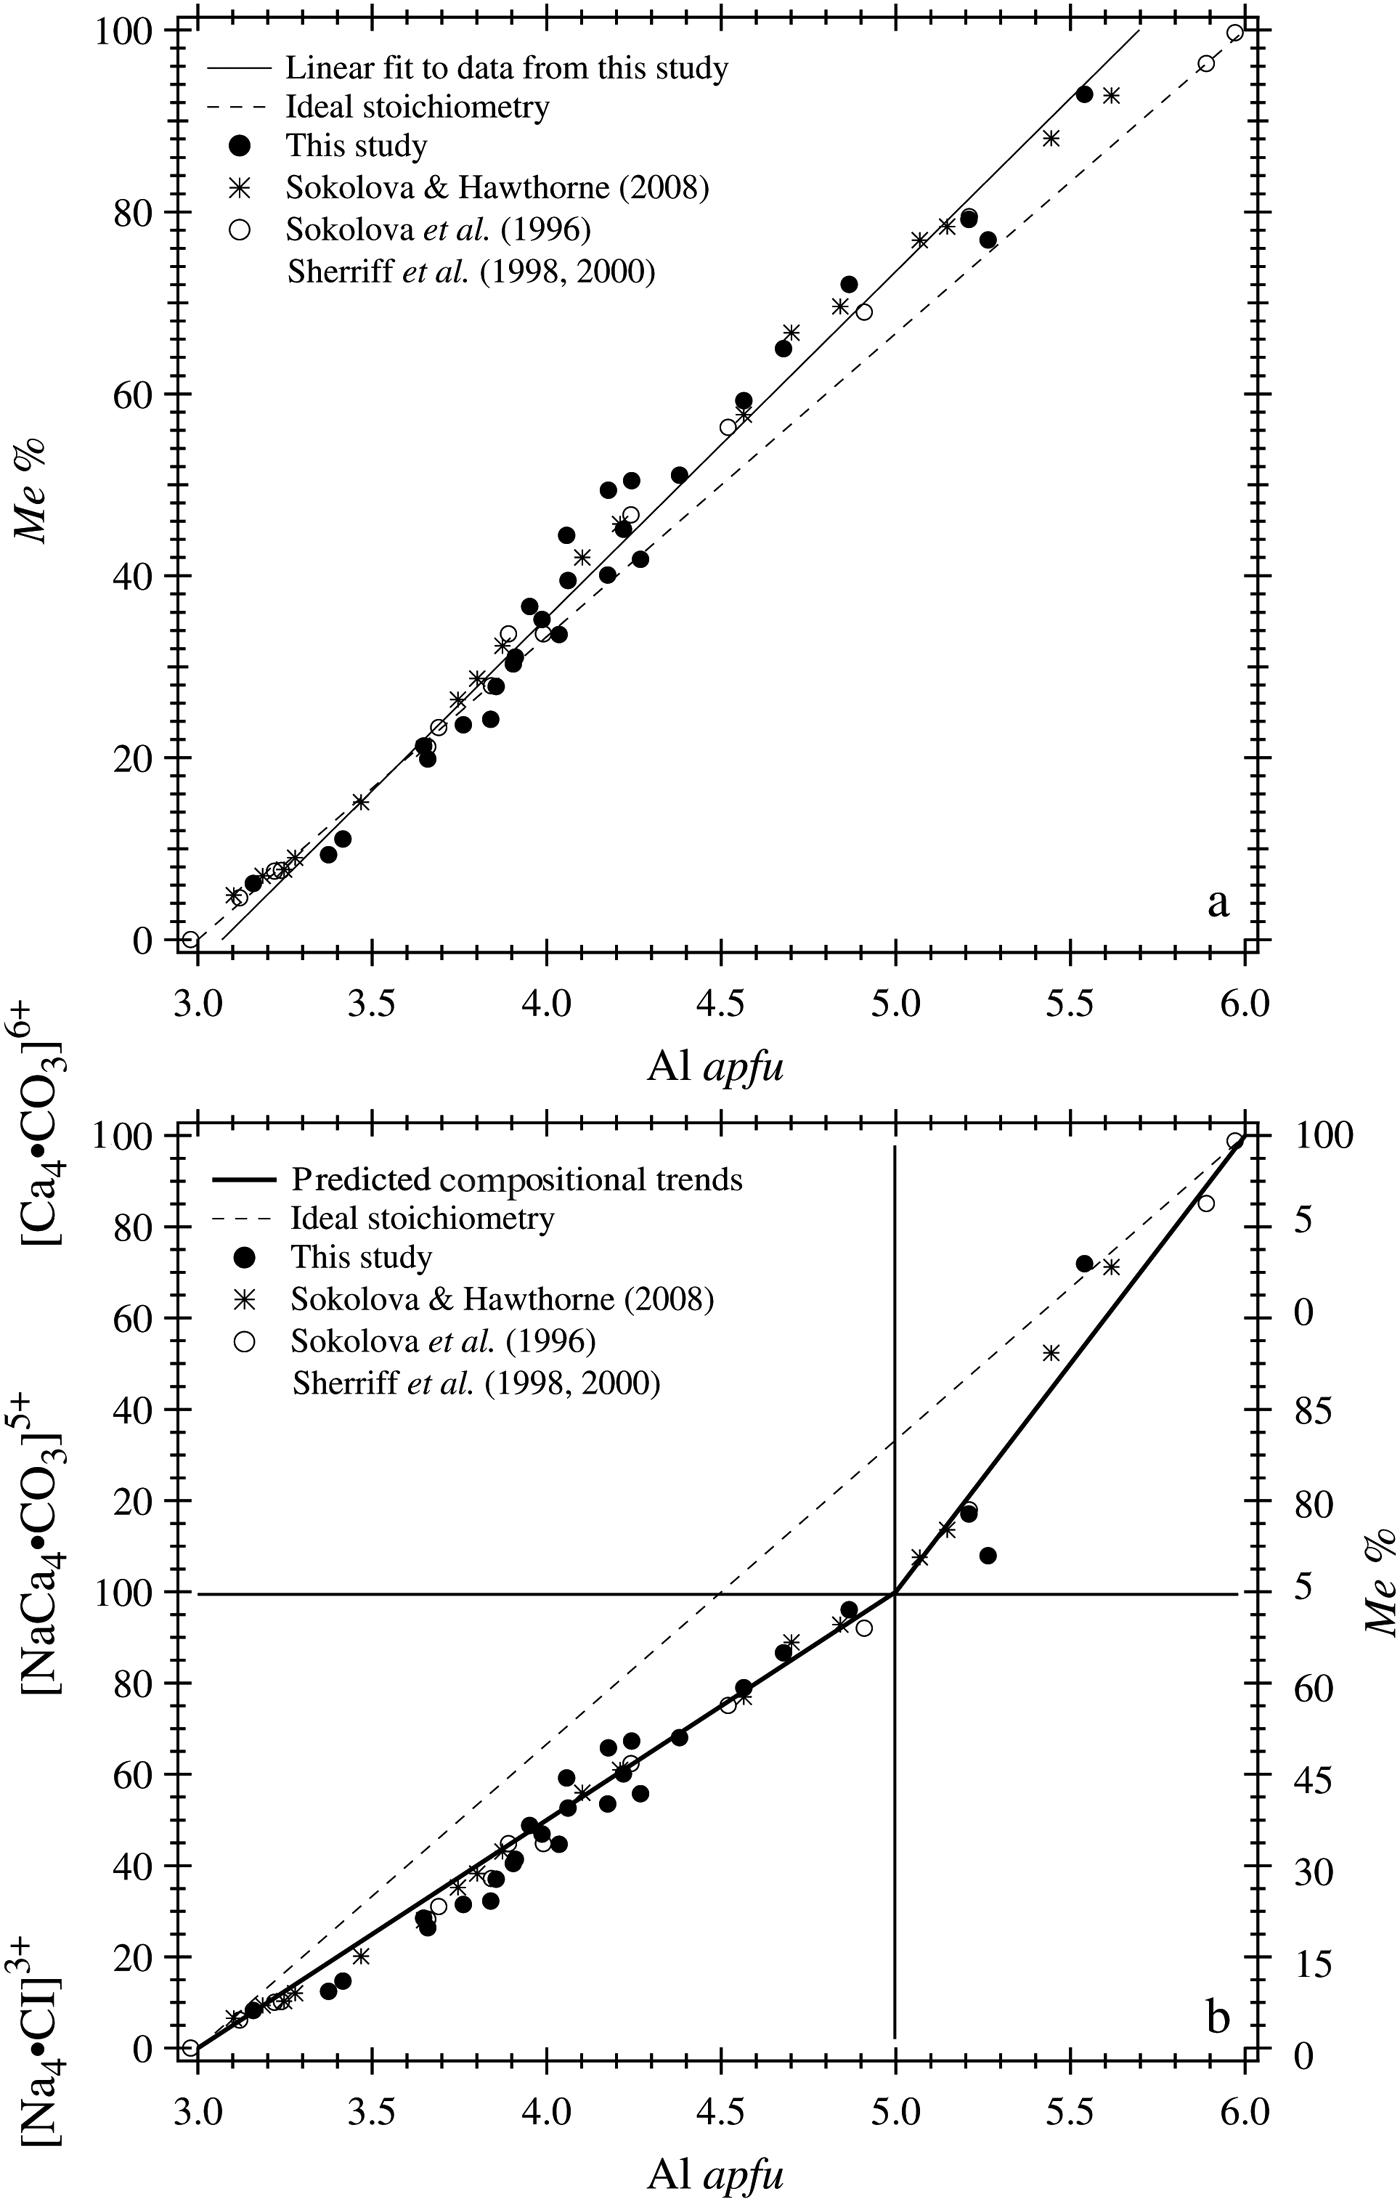
The chemical analyses for 27 samples are plotted (Figure 2). The dashed lines indicate the ideal stoichiometry for scapolite, which is not achieved, and is often referred to as scapolite chemical anomaly. The Me% increases linearly with Al apfu [Figure 2(a)]. Figure 2(b) shows the variation of scapolite analyses as two series that meet at Me 75. The thick solid lines are based on the ideal chemical compositions for Me 0, Me 75, and Me 100, and the measured data points are not fitted [Figure 2(b)]. This variation is the same as that reported by Hassan and Buseck (Reference Hassan and Buseck1988) and shown as Fig. 188 in Deer et al. (Reference Deer, Howie and Zussman1992), based on chemical analyses available at that time.

Figure 2. Chemical composition across the scapolite series. (a) The Me% increases linearly with Al apfu. The least-squares fitted solid line does not pass through the points (Me 0 and Al3) and (Me 100 and Al6) because of scapolite chemical anomaly. (b) Composition shown as two series that meet at (Me 75 and Al5) and represented by two thick solid lines that correspond to the ideal theoretical compositions of Me 0, Me 75, and Me 100. The data points are not fitted in (b). The dashed lines in (a) and (b) represent ideal stoichiometric compositions for scapolite solid solutions that do not occur. Data from the literature are included for comparison (insert).
Included for comparison in Figure 2 are data from Sokolova and Hawthorne (Reference Sokolova and Hawthorne2008), Sokolova et al. (Reference Sokolova, Kabalov, Sherriff, Teertstra, Jenkins, Kunath-Fandrei, Goetz and Jäger1996), and Sherriff et al. (Reference Sherriff, Sokolova, Kabalov, Teertstra, Kunath-Fandrei, Goetz and Jäger1998, Reference Sherriff, Sokolova, Kabalov, Jenkins, Kunath-Fandrei, Goetz, Jäger and Schneider2000). The chemical analyses from these studies and the data from this study are similar to each other. The solid straight line passes through the point (Me 0, 3 Al), but does not pass through the (Me 100, 6 Al) point [Figure 2(a)]. Compositions above Me 93 or below Me 6 do not occur naturally; so the synthetic end-members, Me 0 and Me 100, are shown.
Based on the chemical analyses, there is only one discontinuity at Me 75 [or five Al apfu; Figure 2(b)]; no other discontinuities occur at any other points such as: Me 20–25 and Me 60–67, or Me 18 and Me 90, as were reported in the literature (see Introduction). Can the Me 75 discontinuity be observed in the unit-cell parameters?
The unit-cell parameters for the 27 scapolite samples may be plotted against Me%, Al apfu, or V. These plots show similar features, irrespective of the variable chosen (Figure 3), three plots are discussed in detail. The a and c unit-cell parameters show discontinuities at 1120 Å3 [Figures 3(a) and 3(d)], which corresponds to Me 75 [=five Al apfu; Figures 3(c) and 3(f)]. A maximum in the c value occurs at about 1106.5 Å3, near Me 37.5 [Figure 3(d)] [=four Al apfu; Figure 3(f)]. The data points were fitted by least-squares and are shown as solid quadratic curves or straight lines. It is possible to fit the c data points between Me 0–75 with two straight lines that meet at about Me 37.5, but a quadratic curve was chosen for the fit over the Me 0–75 series [Figure 3(d)].

Figure 3. Variation of the unit-cell parameters across the scapolite series. (a) a vs. V, (b) a vs. Me%, (c) a vs. Al apfu, (d) c vs. V, (e) c vs. Me%, (f) c vs. Al apfu, (g) c/a vs. V, (h) c/a vs. Me%, (i) c/a vs. Al apfu, (j) V vs. Me%, (k) V vs. Al apfu, and (l) V vs. Al apfu. A dashed vertical line is drawn at 1120 Å3, Me 75, and five Al apfu where a discontinuity occurs. A maximum c value occurs at Me 37.5, and four Al apfu (d, e, and f). A continuous non-linear variation is shown for V vs. Me% or Al apfu (j and k), which rules out any phase transition in the scapolite series.
The unit-cell volume, V, varies smoothly with Me% [Figure 3(j)], and with Al apfu [Figure 3(k)]; in both of these cases no discontinuity occurs at Me 75. However, it is possible to fit the same V data to show a discontinuity at five Al apfu [Figure 3(l)]. For a first-order transition, it is important for V to show a significant change, instead of changes in the a or c unit-cell parameters. Such a transition would also require additional confirmation, such as a change in space group at that particular point. Since the V does not show a discontinuity between Me 0–100 [Figures 3(j) and 3(k)], no first-order transition occurs in the scapolite series, but a second-order transition at Me 75 cannot be ruled out. Therefore, point Me 75 is considered as a discontinuity instead of a transition.
There is no 1:1 correspondence between V, Me%, and Al apfu because the dashed vertical lines should occur at the same position on the horizontal x-axis (Figure 3). For example, the dashed vertical line at Me 75 occurs to the right of similar lines for V or Al apfu [Figures 3(a)–3(c)]. The V and Al apfu have a closer 1:1 correspondence than Me% [Figures 3(a) and 3(c)]. One expects the Me 75 vertical line to coincide with the dashed vertical line at five Al apfu based on the Me 75 formula, NaCa3[Al5Si7O24](CO3); which is not the case [Figures 3(b) and 3(c)].
The net change in the c value between Me 0–100 is small; about 7.556–7.588 Å, a difference of 0.032 Å, which corresponds to 0.42%. The net change in the a parameter is large; about 12.033–12.232 Å, a difference of 0.199 Å, which corresponds to 1.65%, and is about six times larger than the change in c value. Large changes are measured more accurately than small changes. The present data and those of Sokolova and Hawthorne (Reference Sokolova and Hawthorne2008) agree quite well for the a parameter [Figure 3(a)], but they disagree for the c parameter near the end members [Figure 3(d)]. The largest differences between these datasets are seen between Me 75–100, where two samples (25 and 27 in Table I) were used in many studies. The data shown as open circles were obtained by Rietveld refinements and are closer to the values from this study than to those obtained from the single-crystal method [Figure 3(d)]. Unit-cell parameters obtained by the Rietveld method, especially with HRPXRD data, are typically more accurate than those obtained by the single-crystal method.
Unit-cell parameters are generally measured more accurately than chemical compositions, so when a, c, and c/a are plotted against V from different studies, they are closer to each other [Figures 3(a), 3(d) and 3(g)], but they are more spread out when they are plotted against compositions such as Me% or Al apfu (Figure 3).
Based on the c unit-cell parameter, a number of studies divided the scapolite series into three subseries with transitions at Me 20–25 and Me 60–67, but not at Me 75. These data are included for comparison in the figures shown for this study, and all of the data appear to support the discontinuity at Me 75. Between Me 75–100, the cell parameters are slightly different among various studies, but they fall on similar parallel trend lines [Figures 3(a) and 3(d)]. The present data do not support a transition at Me 60–67.
The data from Sokolova and Hawthorne (Reference Sokolova and Hawthorne2008) occur as a cluster of six points between Me 0–21, which may indicate a separate trend and a transition at Me 20–25, as they have reported (Figure 3). These six data points occur on a nearly vertical straight line, indicating that they are independent of V [Figures 3(a) and 3(d)], but they do vary with Me% (and Al apfu), which is unusual [Figure 3(j)]; the V for these six points is constant between Me 0–21. Hawthorne and Sokolova (Reference Hawthorne and Sokolova2008) suggested introduction of K atoms into the structure as a cause for the transition at Me 20–25. The data from this study indicate that a transition at Me 20–25 is unlikely (Figure 3). The large K atom should cause a significant change in V, which is not observed (Figure 3).
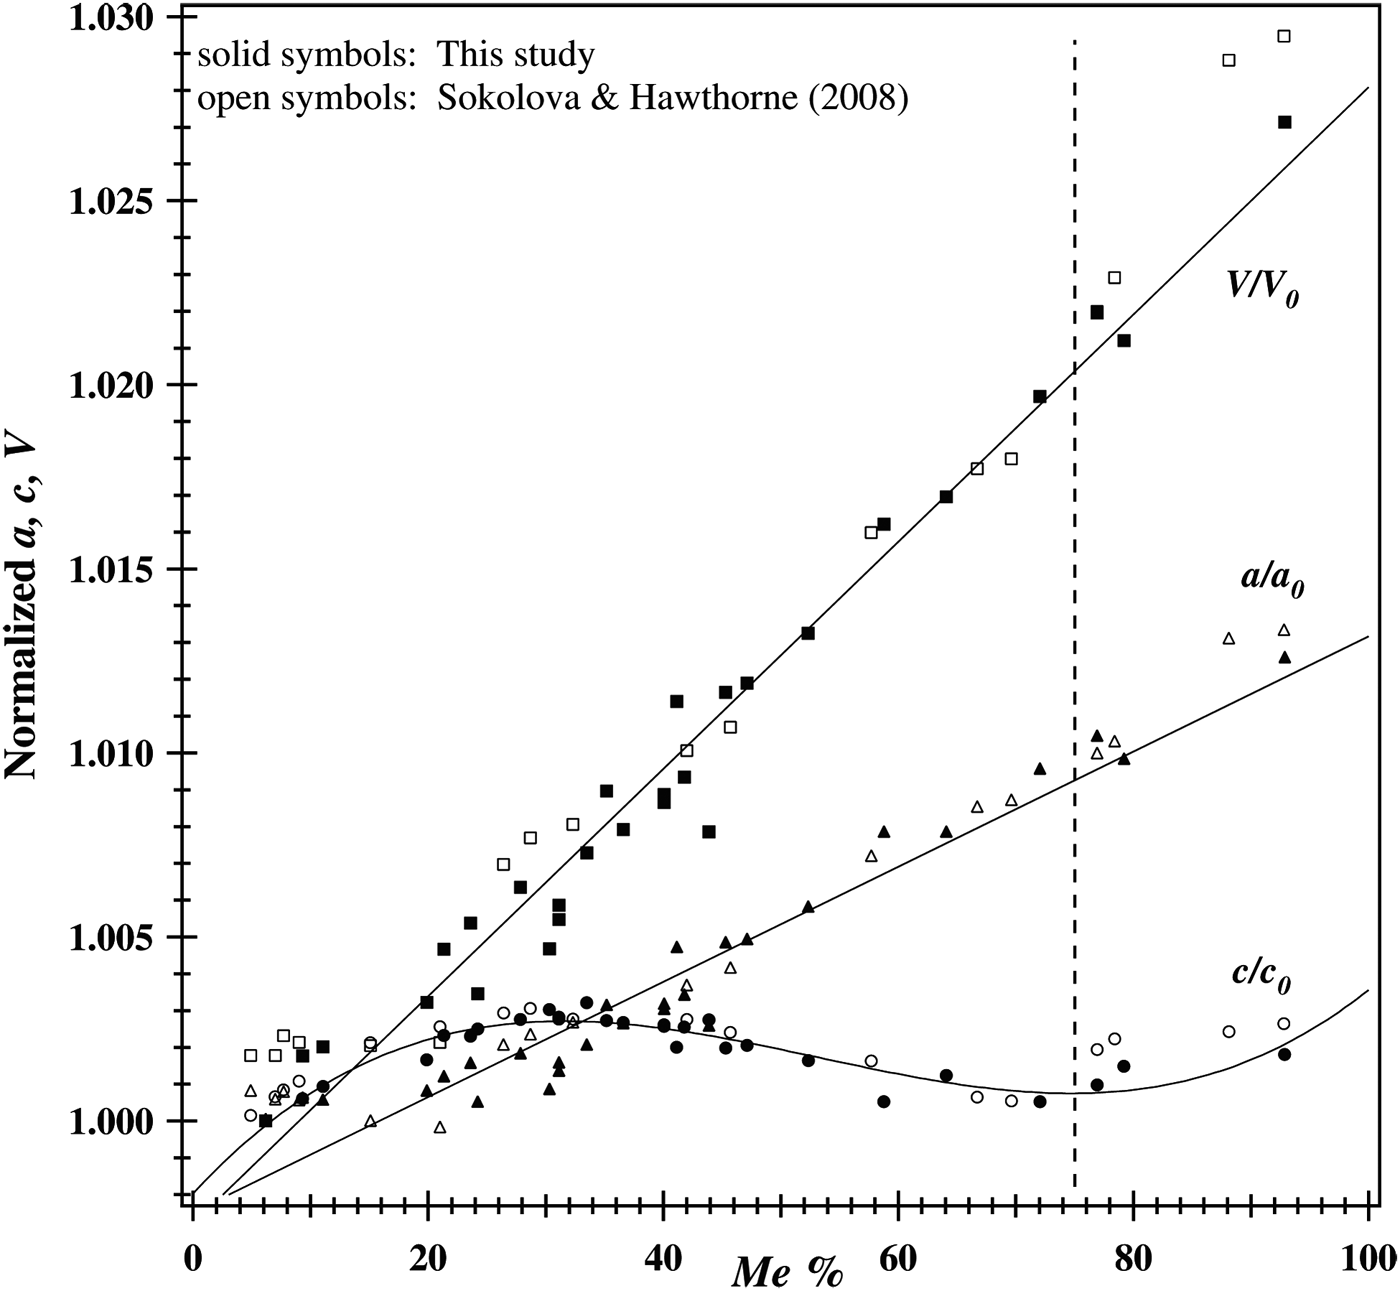
The normalized unit-cell parameters are shown in Figure 4. Both V/V 0 and a/a 0 vary linearly with Me% and show no discontinuity. The a 0, c 0, and V 0 values used are 12.047 56(1), 7.563 21(1), and 1097.751(1) Å, respectively, for sample-1 (Table I). The non-linear variation of c/c 0 shows a maximum value at about Me 37.5 and a minimum value at about Me 75 (Figure 4).
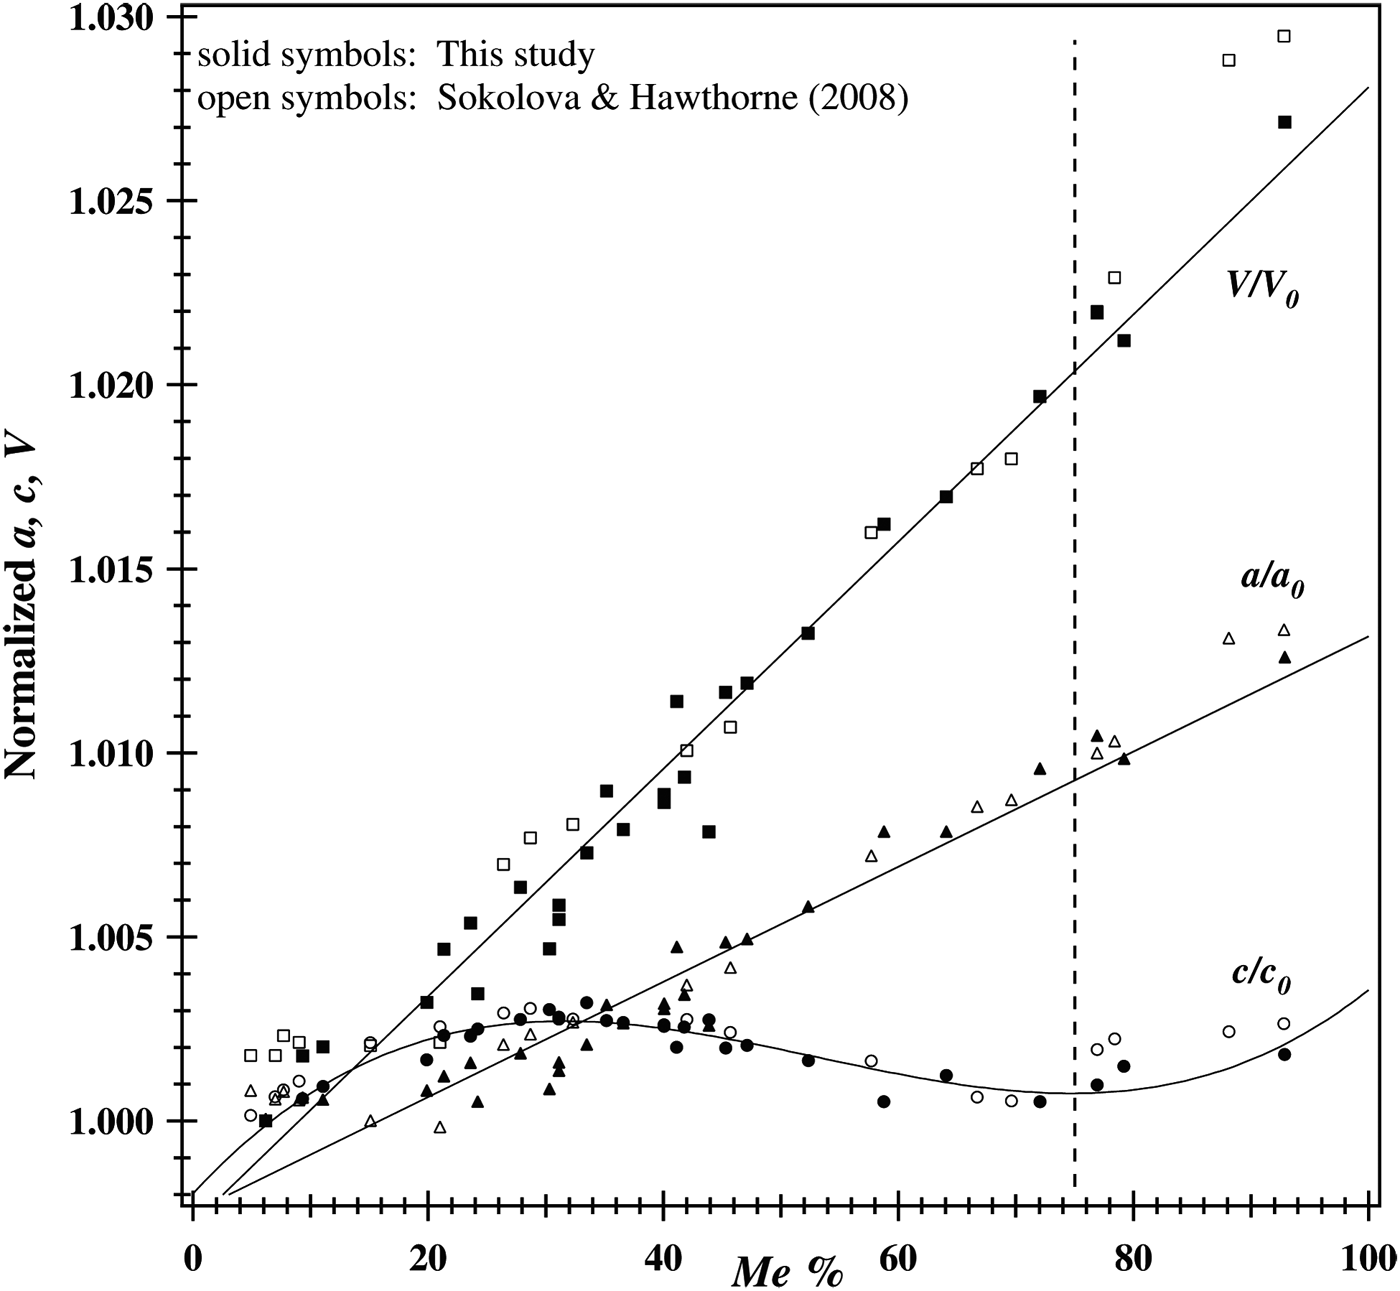
Figure 4. Normalized unit-cell parameters. Both V/V 0 and a/a 0 vary linearly with Me%. The non-linear variation of c/c 0 shows a maximum value at about Me 37.5 and a minimum value at about Me 75.
Some studies did not report a discontinuity at Me 75 and appear to incorrectly identify phase transitions in the ranges Me 20–25 and Me 60–67 (Sokolova et al., Reference Sokolova, Kabalov, Sherriff, Teertstra, Jenkins, Kunath-Fandrei, Goetz and Jäger1996; Teertstra and Sherriff, Reference Teertstra and Sherriff1996, Reference Teertstra and Sherriff1997; Zolotarev, Reference Zolotarev1996; Sherriff et al., Reference Sherriff, Sokolova, Kabalov, Teertstra, Kunath-Fandrei, Goetz and Jäger1998, Reference Sherriff, Sokolova, Kabalov, Jenkins, Kunath-Fandrei, Goetz, Jäger and Schneider2000; Sokolova and Hawthorne, Reference Sokolova and Hawthorne2008). In this study, a discontinuity occurs at Me 75 (=five Al apfu), and a maximum c value occurs at Me 37.5 (=four Al apfu). Maximum order of Al–Si, Cl–CO3, and Na–Ca, together with APBs occur at Me 37.5 (Hassan and Buseck, Reference Hassan and Buseck1988; Antao and Hassan, Reference Antao and Hassan2011a).
Why do the c values show some scatter between 1103 and 1108 Å3, that is, near Me 37.5 [Figure 3(d)]? This scatter is related to APBs and the averaging of different domains containing different clusters that form with Cl and CO3 ions, including minor SO4 2− and K+ ions, and the different percentages of such clusters.
Unit-cell data across the scapolite series, particularly the c parameter, contain a discontinuity at Me 75, Na2Ca6[Al10Si14O48](CO3)2, which does not correspond to a first-order transition; it marks the point where the series is divided into two with distinct exchange reactions (Evans et al., Reference Evans, Shaw and Haughton1969; Hassan and Buseck, Reference Hassan and Buseck1988). Note that type-b reflections were observed between Me 18–90 (Seto et al., Reference Seto, Shimobayashi, Miyake and Kitamura2004). At Me 75, the A site ideally contains only CO3 groups and no Cl atoms.
A detailed explanation of the unit-cell variations across the scapolite series with composition must come from bond distances and angles and will be addressed in a separate paper, but a qualitative explanation is given here. The height of a TO4 tetrahedron is about 2.5 Å, and the height of three tetrahedra is 7.5 Å, which is similar to the c parameter value in scapolite (Table I; Figure 5). The variation in the c parameter across the series is related to the Al–Si order. A maximum c value occurs where there is complete Al–Si order at Me 37.5 (Antao and Hassan, Reference Antao and Hassan2011a). From Me 0–100, Al replaces Si [Al–O > Si-O], larger CO3 group replaces Cl, longer M (Ca, Na site) −A (Cl,CO3 site) distances occur, hence a and V increase. This increase in a and V is restrained by stronger <Ca–O> bonds that decrease and cause the TO4 tetrahedra to rotate, resulting in decreasing T–O–T angles, as Ca replaces Na from Me 0–100.

Figure 5. (Color online) Part of the structure of scapolite showing a central cage containing the interstitial framework M cations and A anions and a few five-membered rings in space group P42/n. The c unit-cell parameter is related to the Al–Si order in the T sites and a maximum c value occurs at Me 37.5 (=four Al apfu) where complete Al–Si order is shown (T1 and T3 = Si, and T2 = Al; Antao and Hassan, Reference Antao and Hassan2011a).
Scapolite forms two solid solutions that meet at Me 75, Na2Ca6[Al10Si14O48](CO3)2, where a discontinuity occurs in the unit-cell parameters and chemical compositions. Division of the scapolite series into two at Me 75 was as previously observed (Evans et al., Reference Evans, Shaw and Haughton1969; Hassan and Buseck, Reference Hassan and Buseck1988). Me 75 is a valid end-member.
ACKNOWLEDGEMENTS
The author would like to thank late D. M. Shaw and J. Post for providing some scapolite samples. The author also thanks the two anonymous reviewers for their comments. Use of the Advanced Photon Source was supported by the US Department of Energy, Office of Science, Office of Basic Energy Sciences, under Contract no. DE-AC02-06CH11357. This work was supported by a Discovery grant from the National Science and Engineering Research Council of Canada and an Alberta Ingenuity New Faculty Award.


