I. INTRODUCTION
Double perovskite compounds including Sr2FeMoO6 (SFMO) are known to exhibit large magnetoresistances in weak magnetic fields (Kobayashi et al., Reference Kobayashi, Kimura, Sawada, Terakura and Tokura1998). The novel magnetoresistance properties have been explained by the intergrain spin-dependent carrier scattering process. SFMO has become one of the most promising candidates in magnetic storage materials (Prinz, Reference Prinz1999). SFMO has a typical ordered double-perovskite structure A 2B B′O6, where A is an alkali-earth ion and B and B′ are transition metals. In the structure of SFMO, alternating FeO6 and MoO6 octahedra are arranged regularly in a rocksalt superlattice with the Sr cations occupying the voids among the octahedra. The charge and radius differences between Fe3+ and Mo5+ are 2 and 0.035, respectively, which make fractions of Fe3+ and Mo5+ occupy the B and B′ sites randomly. There is also a fraction of Mo atoms located at the B site and an equivalent of Fe atoms located at the B′ site, and this is known as the antisite (AS) defect. It is also well known that the AS defect strongly depends on the synthesis process (Stoeffler and Silviu, Reference Stoeffler and Silviu2006). The AS defect was reported to decrease the magnetic moment of SFMO and has a large influence on its structure and magnetic properties (Navarro et al., Reference Navarro, Frontera, Balcells, Martínez and Fontcuberta2001). The successive sintering treatments can improve the ordering of the cations and physical properties of SFMO (Jurca et al., Reference Jurca, Berthon, Dragoe and Berthet2009). In this paper, the results on the study of crystal structures of SFMO samples prepared by solid-state reaction with long sintering times are reported.
II. EXPERIMENTAL
Sample of Sr2FeMoO6 was prepared by standard solid-state reaction. Stoichiometric amounts of powders of SrCO3, Fe2O3, and MoO3 were mixed, ground, and heated at 900 °C for 10 h in air. A small amount of the presintered sample was kept for X-ray powder diffraction (XRD) analysis and the rest of the sample was finely ground, pressed into pellets, and then sintered at 1280 °C in a stream of 5% H2/Ar gas for 5 h. The heating and cooling rates for the sintering process at 1280 °C were 5 °C/min. One pellet was kept for XRD analysis (sample 1) and the remaining pellets were then subjected through the process of regrinding and resintering for one, two, three, and four times to produce samples 2, 3, 4, and 5, respectively. Therefore, the total sintering times (at 900 and 1280 °C) used to synthesize samples 1, 2, 3, 4, and 5 were 5, 10, 15, 20, and 25 h, respectively.
Crystalline phases and crystal structures of the samples were studied by XRD using a Rigaku D/max 2500 diffractometer. The diffraction data were collected at room temperature (300 K) over a 2θ range of 20° to 100°. Other experimental conditions were diffracted-beam graphite monochromator, Cu K α radiation, 45 kV, 120 mA, and θ-2θ scan with 2θ steps of 0.02° and count time per step of 2 s. The Rietveld refinement program GSAS (Toby, Reference Toby2001) was used for crystal-structure determination from the experimental XRD data.
III. RESULTS AND DISCUSSION
A. Crystalline phase
The XRD pattern for the presintered sample is shown in Figure 1. In the presintered process, the main reactions can be described by the following equations:

Figure 1. (Color online) XRD pattern for the presintered sample prepared at 900 °C for 10 h in air. The three peaks appeared in the 2θ range indicated by the oval are the main peaks of SrMoO4. The vertical bars at the bottom indicate the Bragg reflection positions for Sr2FeMoO6.
The electronic configuration of Mo is 4d 55s 1 and the stable valance of Mo is +6. The reaction of Eq. (3) is more prone to occur in the presintered process. This can be seen from Figure 1, in which the three peaks appeared in the 2θ range indicated by the oval are the main peaks of SrMoO4. According to the results of the Mossbauer spectrum obtained by Lindén et al. (Reference Lindén, Shimada, Motohashi, Yamauchi and Karppinen2004), the main valences of Fe and Mo cations in SFMO are +3 and +5, respectively. Thus, the presintered mixture needs to process further in reducing atmosphere in order to reduce Mo+6 in SrMoO4 to Mo+5 in SFMO. The reducing atmosphere of 5% to 95% H2/Ar was used based on the results of our previous study (Hu et al., Reference Hu, Wang, Lv, Ji, Wu and Lu2009) that the reducing atmosphere of 5 to 95% H2/Ar can effectively reduce Mo6+ to Mo5+ and prevent the reduction of Fe3+ to Fe. Figure 2 shows the XRD pattern for sample 1, and the two peaks appeared in the 2θ range indicated by the

Figure 2. (Color online) XRD pattern for sample 1. The two peaks appeared in the 2θ range indicated by the oval are the main peaks of SrMoO4. The vertical bars at the bottom indicate the Bragg reflection positions for Sr2FeMoO6.

Figure 3. (Color online) XRD pattern for sample 2. The two peaks appeared in the 2θ range indicated by the oval are the main peaks of SrMoO4. The vertical bars at the bottom indicate the Bragg reflection positions for Sr2FeMoO6.
oval are the main peaks of SrMoO4 with significantly smaller intensities than those of the prereacted mixture shown in Figure 1. Therefore, the amount of SrMoO4 in sample 1 is significantly smaller than that in the presintered sample. Figure 3 shows the XRD pattern for sample 2 with only about 2% of SrMoO4. Figure 4 shows XRD pattern for sample 3 with a total sintering time of 15 h, and it can clearly be seen that sample 3 is pure Sr2FeMoO6, and no trace of SrMoO4 can be detected. The total chemical reaction equation for synthesizing a pure SFMO phase is as follows:
The XRD patterns for samples 4 and 5 are similar to that of sample 3 shown in Figure 3, showing that only the SFMO phase is presented in samples 3 and 4.
B. Crystal structure
The Rietveld refinements of X-ray diffraction patterns of SFMO for samples 3, 4, and 5 were carried out based on a tetragonal structure with space group I4/m and Sr located at the 4d site of (1/2, 0, 1/4), Fe/Mo at both the B site of 2a (0, 0, 0) and the B′ site of 2b (0, 0, 1/2), and O1 at 8h (x, y, 0) and O2 at 4e (0, 0, z). Before each refinement, we assume full occupancy for each site. In addition, the sum of the occupancies

Figure 4. XRD pattern for sample 3. The vertical bars at the bottom indicate the Bragg reflection positions for Sr2FeMoO6. Similar XRD patterns were obtained for samples 4 and 5.

Figure 5. (Color online) Observed (circles) and calculated (continuous line) XRD patterns for sample 5. The vertical bars at the bottom indicate the Bragg reflection positions for Sr2FeMoO6. The lowest curve shows the differences between the observed and the calculated XRD patterns.
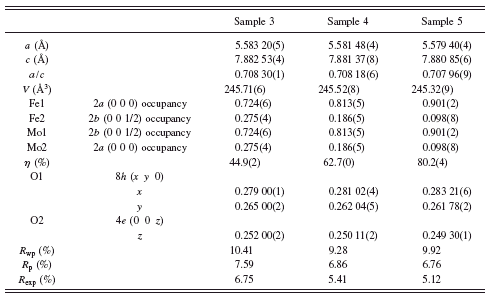
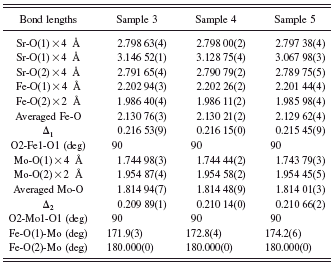
of the Fe cations at both the B and the B′ sites was also fixed to 1.0, the same for the Mo cations. The reason for assuming full oxygen occupancies at the O1 and the O2 sites was the uncertainty caused by weak X-ray scattering by oxygen (Wu et al., Reference Wu, Jiang, Lin, Liu, Chen and Jin1998). Each refinement was performed according to the refinement order previously reported by Wu et al. (Reference Wu, Jiang, Xu, Pan, Huang, Ji, Mao, Xu and Zhang1996). Figure 5 shows the refinement results on sample 5, and similar crystal-structure results were obtained for samples 3 and 4. Refined crystal-structure parameters and R factors for samples 3, 4, and 5 are listed in Table I, and values of bond lengths and bond angles of the three samples are also listed in Table II.
As shown in Table I, the values of a, c, a/c, and V decrease systematically with increasing sintering time. The occupancy of Fe at the B site increases with increasing sintering time. By defining the degree of ordering of the Fe or Mo cation to be η=1–2AS, where AS represents the antisite occupancy, the value of η increases almost linearly from 44.9(2)% for sample 3 to 80.2(4)% for sample 5. This indicates
TABLE I. Crystal-structure parameters, site occupancies, and degrees of Fe and Mo orderings, η, obtained by the Rietveld refinements of XRD patterns of samples 3, 4, and 5 of Sr2FeMoO6.

TABLE II. Bond lengths and angles for samples 3, 4, and 5 of Sr2FeMoO6 obtained by the Rietveld refinements.

that the increases in the sintering time did improve the ordering of cations (or reduce the number of antisite defects) in SFMO.
Table II shows the values of bond lengths and angles for SFMO samples 3, 4, and 5 prepared by total sintering times of 15, 20, and 25 h, respectively. As shown in Table II, the average Fe-O and Mo-O bond lengths decrease with increasing sintering time. The value of Δ 1 (where Δ 1=|l Fe-O(1)−l Fe-O(2)| and l Fe-O(1) and l Fe-O(2) are the bond lengths of Fe-O1 and Fe-O2, respectively) decreases with increasing sintering time, indicating that the difference between the lengths of the Fe-O1 and Fe-O2 bonds is getting smaller. On the other hand, the value of Δ 2 (where Δ 2=|l Mo-O(1)−l Mo-O(2)| and l Mo-O(1) and l Mo-O(2) are the bond lengths of Mo-O1 and Mo-O2, respectively) increases with increasing sintering time, indicating that the difference between the lengths of the Mo-O1 and Mo-O2 bonds is becoming larger.
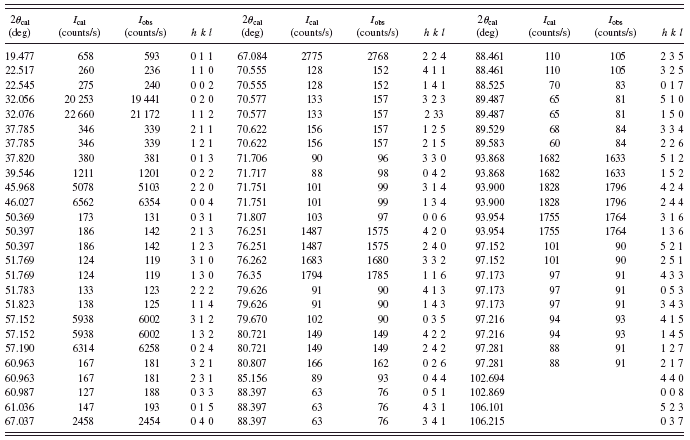
TABLE III. X-ray diffraction data for sample 5 of Sr2FeMoO6.

The angles for O2-Fe1-O1 and O2-Mo1-O1 remain constant at 90°, and the angles for Fe-O2-Mo are also unchanged at 180°. However, the angle for Fe-O1-Mo increases from 171.9° to 174.2° with increasing total sintering time from 15 to 25 h. The angle for Fe-O1-Mo gradually moves closer to 180° with increase sintering time indicating that the connected Fe-O1 and O1-Mo bonds align toward a straight line as that for Fe-O2-Mo. This suggests that the tilt between the neighboring FeO6 and the MoO6 octahedra becomes smaller with larger sintering time, and this structural change may have an effect on the exchange interactions among Fe-O-Fe and Mo-O-Mo. The calculated XRD data for sample 5 are listed in Table III.
IV. CONCLUSION
Long total sintering times of 15 and more hours at 1280 °C were found to be essential to synthesize single-phase Sr2FeMoO6 by solid-state reaction. The Rietveld refinement results show that the ordering of the Fe and Mo cations (or the reduction of antisite defects) in the Sr2FeMoO6 structure improves with increasing total sintering time. The unit-cell volume and the average Fe-O and Mo-O bond lengths decrease with increasing sintering time. The difference between the two Fe-O bond lengths in a FeO6 octahedron also decreases with increasing sintering time. On the other hand, the difference between the two Mo-O bond lengths in a MoO6 octahedron becomes larger with increasing sintering time. The crystal-structure results obtained by this study may provide useful information to the understanding of the mechanism of room-temperature magnetoresistance in an oxide material with an ordered double-perovskite structure previously reported by Kobayashi et al. (Reference Kobayashi, Kimura, Sawada, Terakura and Tokura1998).
ACKNOWLEDGMENTS
This work was supported by NNSFC (Grant Nos. 10974081, 10774065, and 10523001) and NKPBRC (Grant Nos. 2006CB921802 and 2010CB923404).


