I. INTRODUCTION
Papers addressing the structural crystallography for hydrated copper (II) oxalate, CuC2O4. nH2O, extend back over 50 years. Schmittler (Reference Schmittler1968), in studying a suite of synthetic samples using Guinier X-ray diffraction (XRD), observed sample-to-sample differences involving XRD line shifts, line broadening differences, and the presence of additional lines in some samples. The differences were interpreted in terms of order-disorder (OD) theory (Fichtner-Schmittler, Reference Fichtner-Schmittler1979), with the sample-to-sample differences being explained in terms of (i) an orthorhombic, fully-disordered stacking fault (FDSF) structural model (designated the “superposition structure’) with space group Pnnm; or (ii) an ordered monoclinic structure with space group P21/n which was described by Schmittler as “pseudo-orthorhombic’. The space groups, unit-cell parameters and atom coordinates for both models were first proposed by Schmittler (Reference Schmittler1968). Subsequently, Kondrashev et al. (Reference Kondrashev, Bogdanov, Golubev and Pron1985) designated the orthorhombic and monoclinic structures as the α- and β-forms, respectively, with the unit cells of the α- and β-forms being related through an orthorhombic-monoclinic transformation. Other papers which have contributed to understanding the structure forms of copper oxalates include Michalowicz et al. (Reference Michalowicz, Girerd and Goulon1979); Gleizes et al. (Reference Gleizes, Maury and Galy1980); Fichtner-Schmittler (Reference Fichtner-Schmittler1984) and Christensen et al. (Reference Christensen, Lebech, Andersen and Grivel2014). Also relevant is the report of the crystal structure of fully-ordered orthorhombic monohydrate [diaqua-μ-oxalato-copper(II) monohydrate] (Wu and Zhai, Reference Wu and Zhai2007).”
A study of natural hydrated copper oxalate material, designated moolooite by Clarke and Williams (Reference Clarke and Williams1986), which had been extracted from mineral specimens collected 12 km from Mooloo Downs Station homestead in Western Australia, described sound fits to Debye-Scherrer XRD data using an orthorhombic cell. Clarke and Williams reported unit-cell dimensions, a = 5.35, b = 5.63, c = 2.56 Å (V c = 77.1 Å3), after which Chisholm et al. (Reference Chisholm and Jones1987) gave very similar values, a = 5.348–5.381, b = 5.625–5.639, c = 2.548–2.559 Å (V c = 77.17 Å3) for moolooite material extracted from Scandinavian lichens. While the work of Schmittler and others has provided atom coordinates for synthetic material, to date there has been no report of atom coordinates for natural moolooite.
Christensen et al. (Reference Christensen, Lebech, Andersen and Grivel2014) described the use of laboratory XRD, synchrotron diffraction data (SRD), and neutron diffraction data for synthetic copper oxalate powders to develop a disordered monoclinic P21/n structural model for synthetic Cu oxalate specimens, and also provided evidence for there being no crystal water in the structure of the material examined. The structural model has two randomly-occupied Cu and oxalate sites, which are attributed to the existence of anisotropic nano-sized crystallites.
The issue of water content in copper (II) oxalates has not been fully explained. Schmittler (Reference Schmittler1968) used thermogravimetric analysis and pycnometry to estimate the water content of chemically synthesised oxalate powders and provided plots of unit-cell parameters vs. water content for the a and b unit-cell parameters. Using the Schmittler calibrations, Clarke and Williams reported a moolooite water content corresponding to n = 0.6, and Chisholm et al. (Reference Chisholm and Jones1987) a range of values n = 0.4–0.7 for their lichen moolooite material. This evidence points to there being more take up of water in natural moolooites possibly because the material has been precipitated relatively slowly, compared with synthetics. By contrast, Frost et al. (Reference Frost, Erickson and Weier2004) described a thermogravimetric and hot stage Raman study of a reportedly natural moolooite specimen which indicated that the material examined was anhydrous; however, it is noted that the source of the sample was not specified. Taking into account literature reports on the water content issue, it appears that there is no “crystal” water in Cu oxalates, but that zeolitic water may be present depending on the conditions under which the compound forms.
In view of the structural variability, use of the current Powder Diffraction File (PDF) data for copper oxalates (ICDD, Reference Kabekkodo2016) should be viewed with caution. The only indexed pattern for CuC2O4. nH2O is PDF 00-021-0297, which derives from Schmittler's data for synthetic samples, and there is no PDF pattern for natural moolooite even though Clarke and Williams had published indexed data for the mineral. Importantly in terms of the current paper, the entry for 00-021-0297 includes the comments Spacings and intensities vary slightly with n. All data refer to a sample consisting of strongly disordered crystals (stacking disorders in the b-direction; OD structure) and correspond to the periodicity of a superposition structure. Additional reflections owing to ordered crystals may occur … The water content (n between 0 and 1) is a “zeolitic” type.
The present study was designed to extend the work of Clarke and Williams by examining SRD data for moolooite from Mooloo Downs and also synthetic copper oxalate material with particular reference to defining the crystal structure, including characterising the disordered state of the mineral. An important aspect of the study has been the issue of water content. Additionally, it was intended to clarify confusion from the literature as to the means of identifying natural moolooite and also synthetic copper oxalates using the International Centre for Diffraction Data (ICDD)-PDF data base and pattern simulations, taking into account the complexities of disorder.
II. STRUCTURAL MODELS FOR COPPER OXALATE FROM THE LITERATURE
A. Orthorhombic and monoclinic cells for copper oxalates
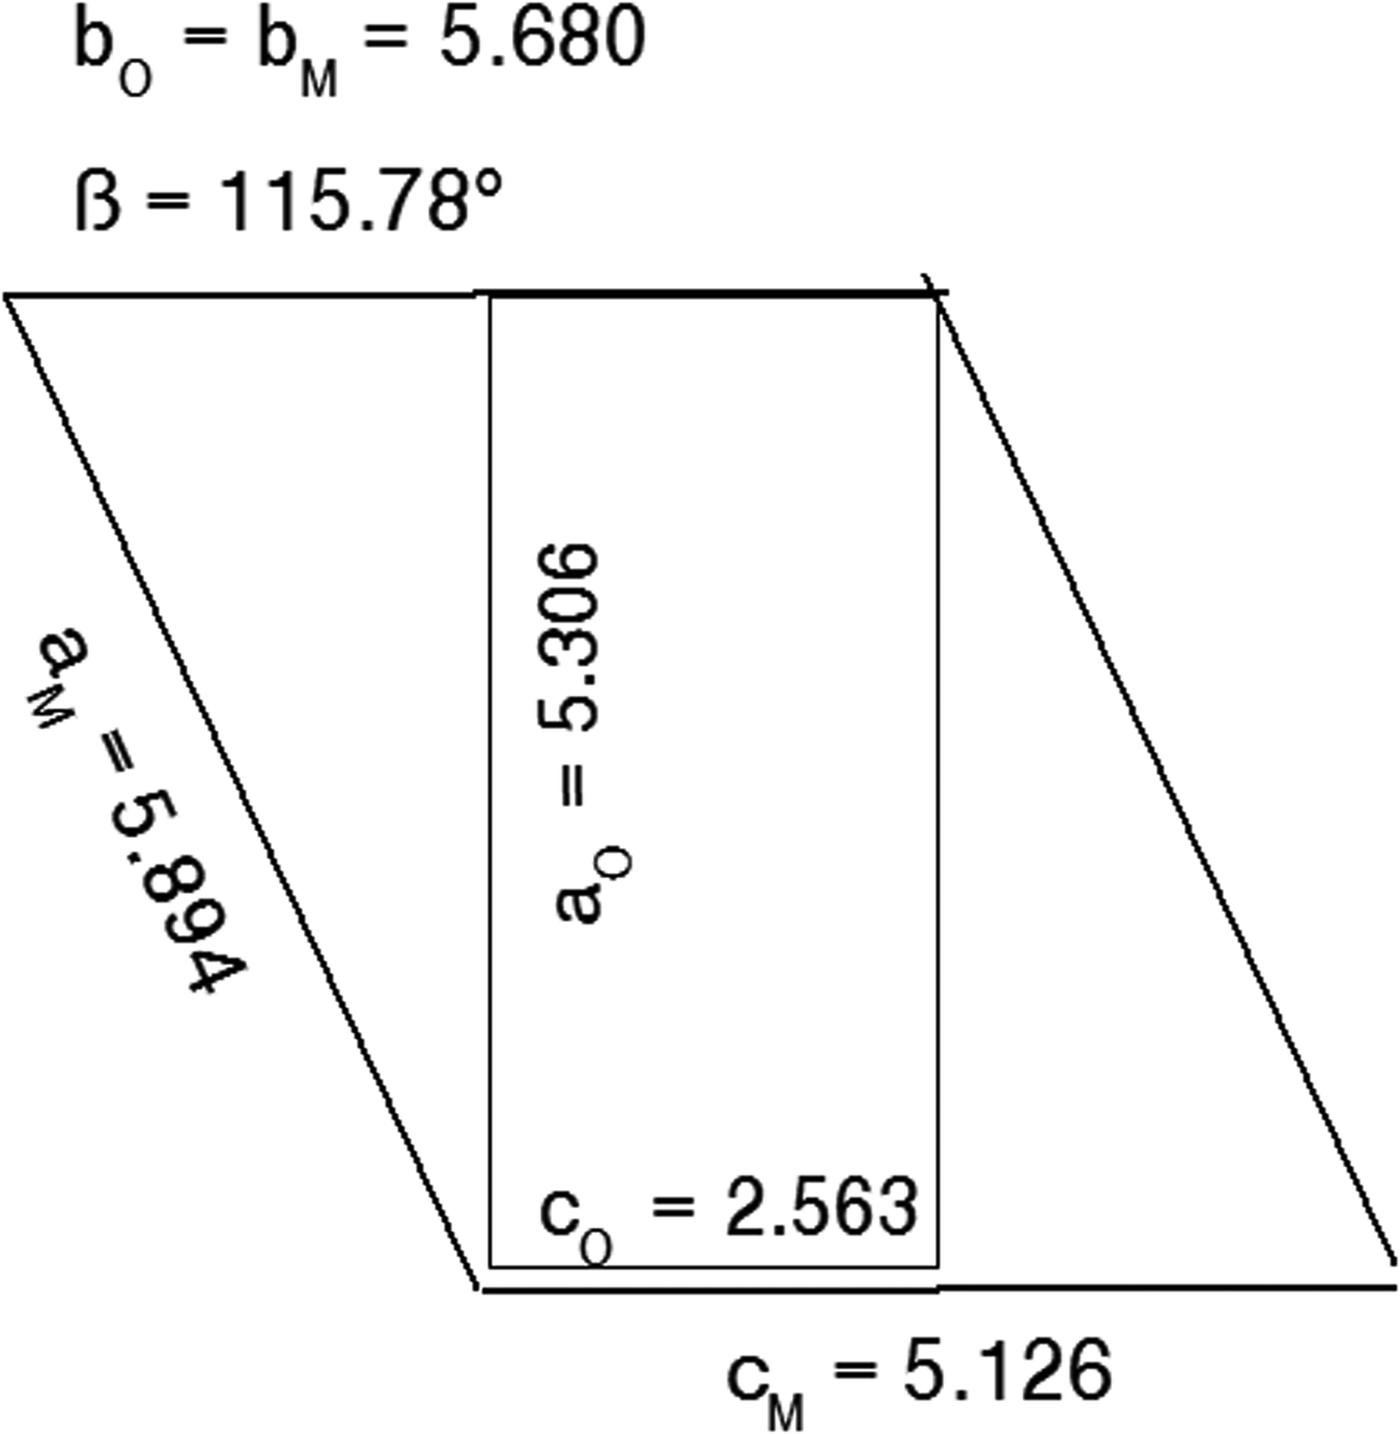
Figure 1 shows the relationship between the α-form orthorhombic unit cell for the FDSF structure, following Schmittler (Reference Schmittler1968) and Kondrashev et al. (Reference Kondrashev, Bogdanov, Golubev and Pron1985), and the transformed monoclinic cell for the ordered β-form.

Figure 1. Relationship between the orthorhombic Pnnm cell and the alternative monoclinic cell generated by Eqs. 1(a)–(d). Unit-cell parameter values taken from Table IV.
The unit-cell parameter transformations are:
 $$a_{\rm M} = a_{\rm O}/{\rm cos}\lpar {\beta -{\rm 9}0^\circ} \rpar \ldots$$
 $$b_{\rm M} = b_{\rm O} \ldots $$
 $$c_{\rm M} = {\rm 2\ x}c_{\rm O} \ldots$$
 $$\beta _{\rm M} = {\rm 9}0^\circ + {\rm ta}{\rm n}^{-{\rm 1}}\lpar {c_{\rm O}/a_{\rm O}} \rpar \ldots$$
and the relationships between the hkl indices for the orthorhombic and monoclinic cells are:
 $$h_{\rm M} = h_{\rm O}-l_{\rm O},k_{\rm M} = k_{\rm O},l_{\rm M} = {\rm 2}l_{\rm O} \ldots$$
 $$h_{\rm O} = h_{\rm M} + l_{\rm M}/{\rm 2},k_{\rm O} = k_{\rm M},l_{\rm O} = l_{\rm M}/{\rm 2} \ldots$$
Views of the monoclinic model are shown in Figures 2(a) and 2(b), and for the disordered orthorhombic model in Figure 3, respectively.
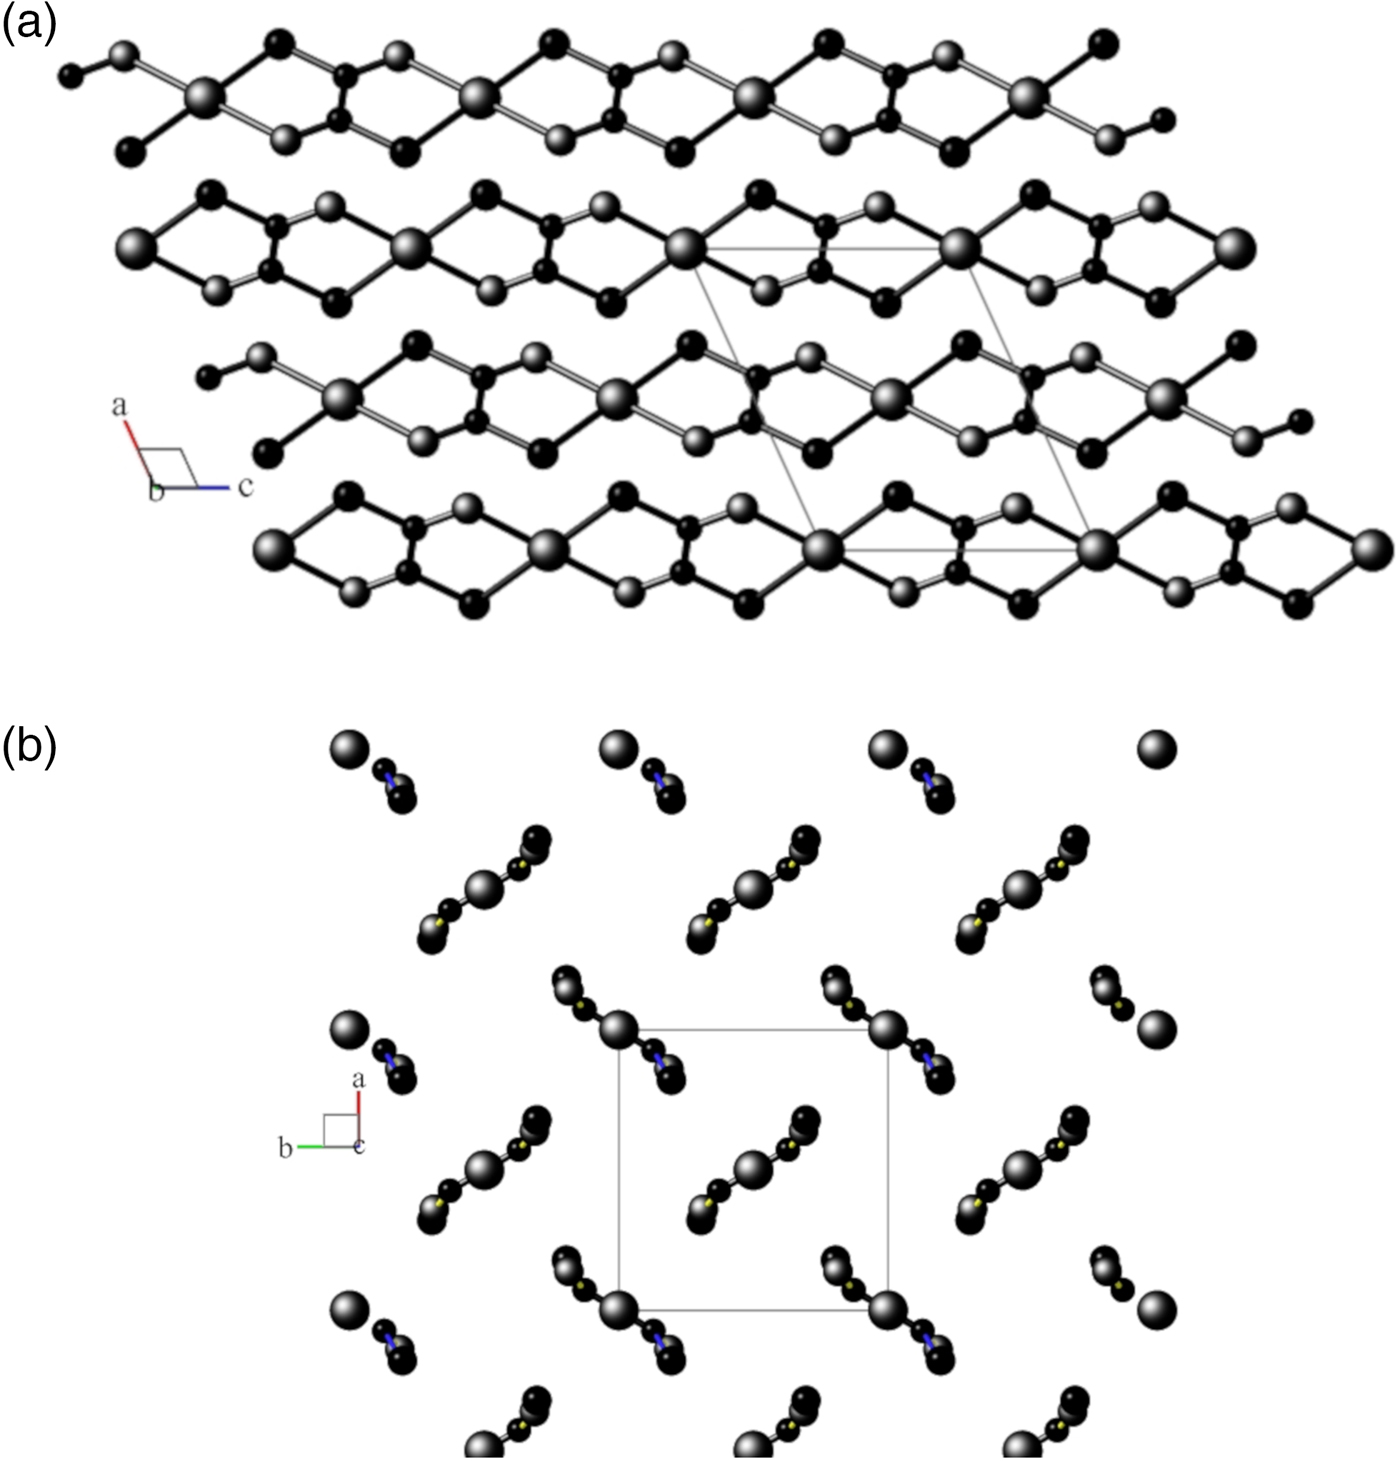
Figure 2. (a) View down the unique b-axis of the fully-ordered monoclinic structural model in space group P21/n, following Kondrashev et al. (Reference Kondrashev, Bogdanov, Golubev and Pron1985) Atom sizes: Cu = large, O = medium, C = small. Generated using program Balls & Sticks (V1.80). (b) View down the c-axis of the fully-ordered monoclinic structural model in space group P21/n, following Kondrashev et al. (Reference Kondrashev, Bogdanov, Golubev and Pron1985). See (a) for atom identities.
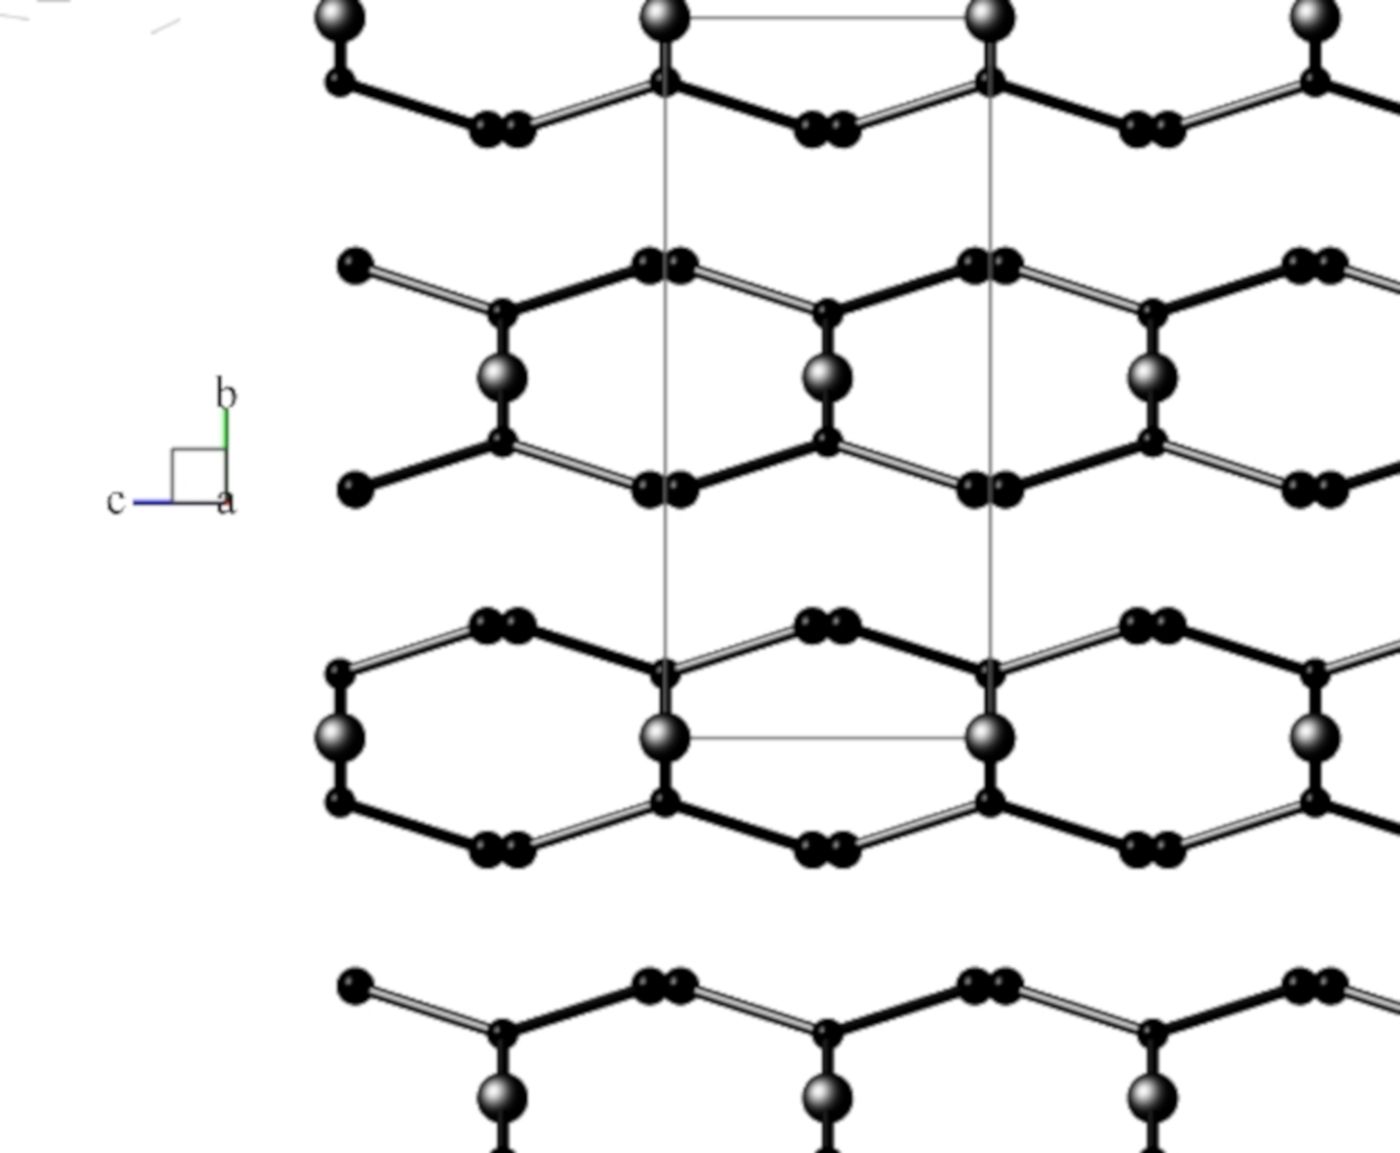
Figure 3. View down the a-axis of the FDSF orthorhombic structural model in space group Pnnm, following Schmittler (Reference Schmittler1968, and after RTV optimisation in the current study with SRD data. Atom sizes: Cu = large, O = medium, C = small. Generated using program Balls & Sticks (V1.80).
B. XRD patterns for copper oxalate models from OD theory
Fichtner-Schmittler (Reference Fichtner-Schmittler1979) summarised the aspects of OD theory which are relevant to copper oxalate crystallography. Key statements from the review are –
(i) Different stackings of OD layers result in ordered structures (periodic in three dimensions) and/or disordered structures, with different stackings possibly occurring in individual crystallites. The various structures which may occur for a particular material are called polytypes.
(ii) Any XRD pattern of OD material includes reflections that are common to all members of the respective family: the family reflections.
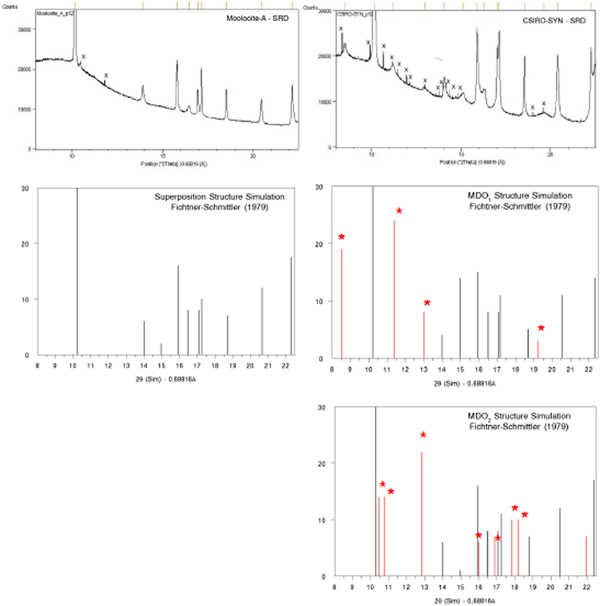
(iii) the family reflections are those for a fictitious structure which is periodic in three dimensions: the superposition structure. It is demonstrated in this paper that the natural moolooite material characterised by SRD corresponds to the superposition structure.
(iv) Amongst the ordered structures for any family there is a small number of so-called Maximum Degree of Order (MDO) polytype structures. For Cu oxalate, Fichtner-Schmittler (Reference Fichtner-Schmittler1979) designated two likely MDO structures as MDO1 and MDO2, and provided XRD simulations for each and also for the superposition structure.
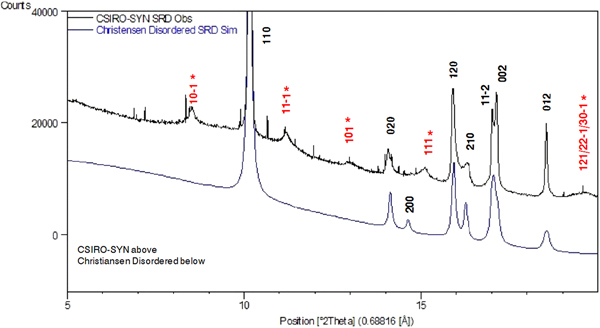
Figure 4 shows a comparison of (i) SRD pattern for moolooite from this study and simulated pattern intensities for the superposition structure of Cu oxalate; and (ii) SRD pattern for CSIRO-SYN synthesised Cu oxalate from this study and simulated intensities for the MDO1 and MDO2 polytype structures. It is evident by inspection that the natural moolooite SRD pattern agrees closely with the Cu oxalate superposition structure, whereas the SRD pattern for CSIRO-SYN is very similar to that simulated for the MDO1 polytype.
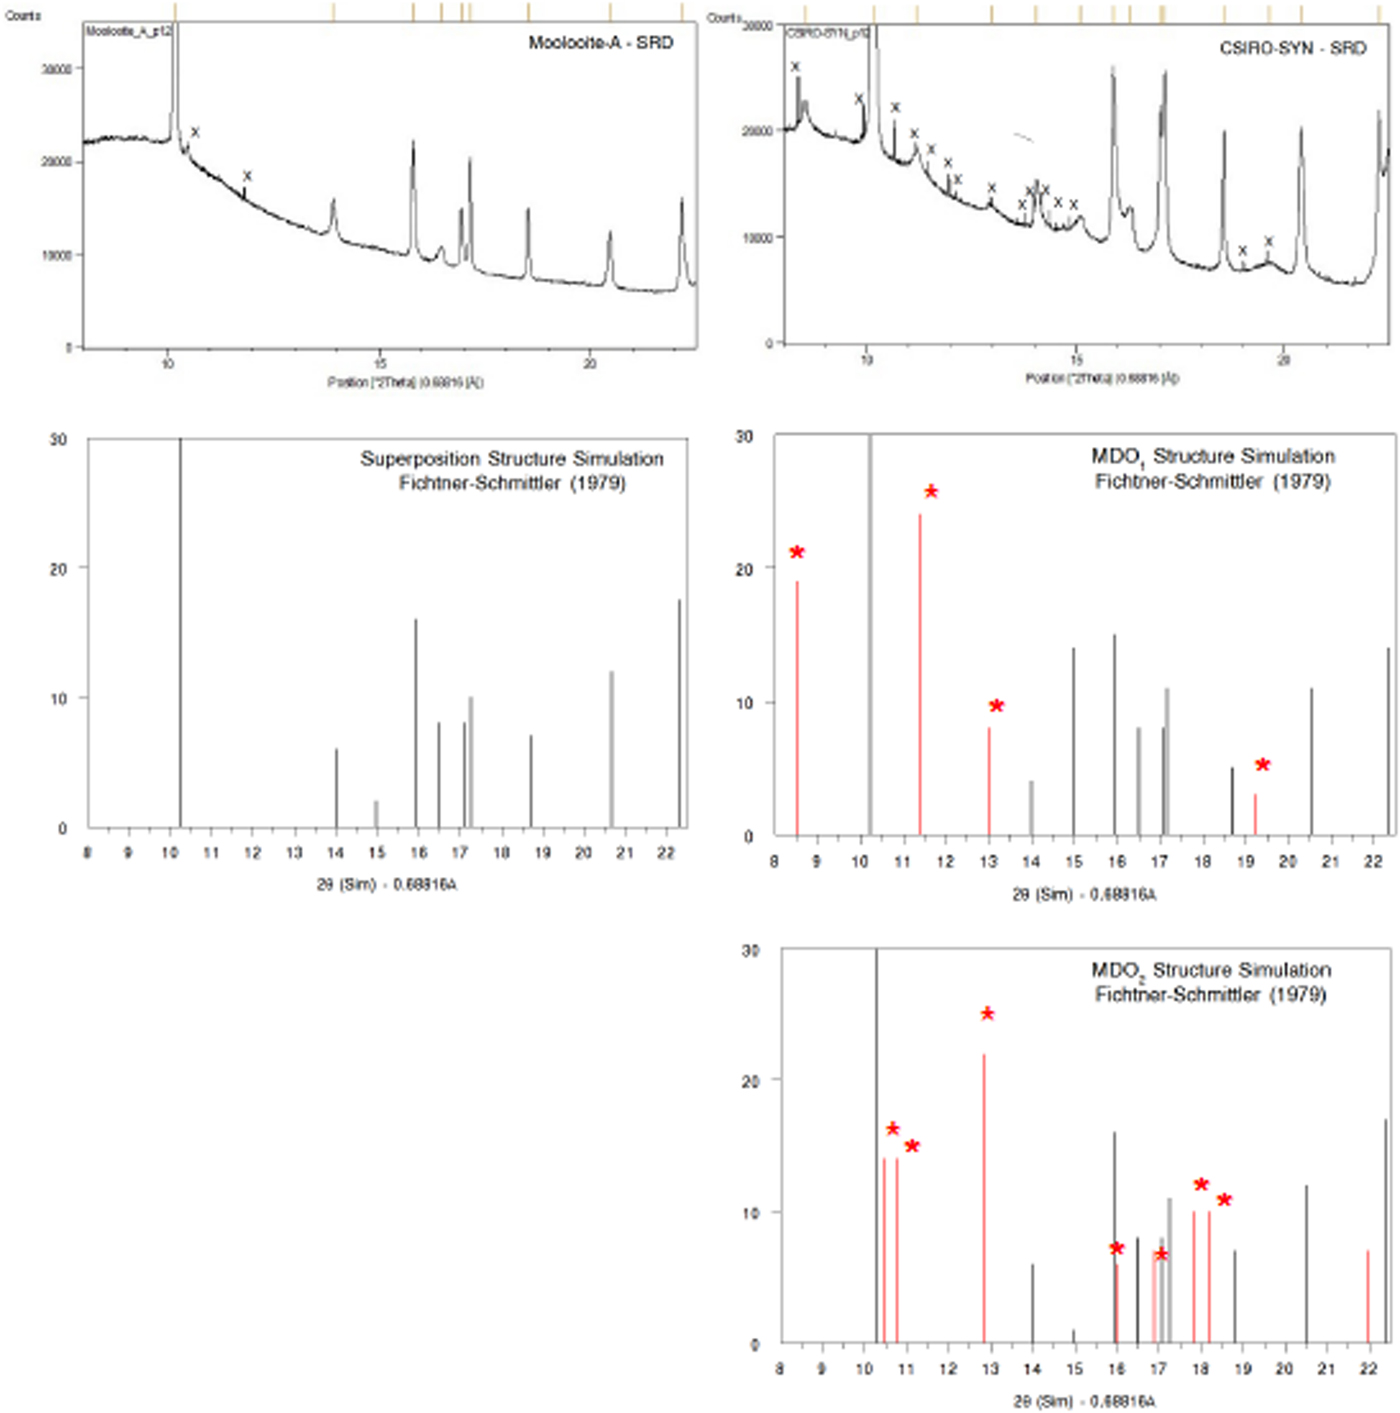
Figure 4. (Color online) Comparison of OD patterns simulated by Fichtner-Schmittler (Reference Fichtner-Schmittler1979) with the measured SRD patterns. Left diagram pair: simulated pattern for superposition structure compared with natural moolooite SRD pattern: x = contaminant lines for middlebackite and quartz impurities (10.5 and 11.8°, respectively). Right diagram set: simulated patterns for MDO1 structure (centre) and MDO2 structure (below) compared with CSIRO-SYN synthetic copper oxalate SRD pattern. The red reflection lines (marked with asterisk) are non-family reflections for the polytype. x = contaminant lines from 3% CuSO4. 5H2O reagent in the measured SRD pattern.
III. EXPERIMENTAL
A. Materials
The moolooite material for SRD analysis was sourced from Mooloo Downs (Clarke and Williams, Reference Clarke and Williams1986), being designated topotype specimen C7 as registered under ChemCentre laboratory number 13F1170 – see Clarke and Williams for a description of the material described previously – physical appearance, microscopy, chemical analysis, and Debye-Scherrer XRD data. In summary, (i) the material is composed of turquoise-green aggregates of generally sub-micron sized equidimensional crystallites; and (ii) from microchemical analysis corresponds to the empirical formula CuC2O4. 0.44H2O.
Two Cu oxalate samples were chemically synthesised as follows –
(i) Sample CSIRO-SYN was prepared by slowly adding a solution of oxalic acid dihydrate to a solution containing a stoichiometric mass of copper sulphate pentahydrate. The mixture was allowed to stand under ambient laboratory conditions for several hours. The pale blue precipitate was filtered, washed thoroughly with water and air-dried. The SRD pattern showed that a slight excess of the copper salt (ca. 3% by weight from Rietveld analysis) was present in the Cu oxalate product.
(ii) Sample GCLSYNF was prepared by the same procedure after substituting an equivalent mass of copper acetate monohydrate for CuSO4.5H2O. The purity of the precipitate as copper oxalate was confirmed by CHN microanalysis.
B. SRD data measurement and analysis
For SRD analysis, the three samples were manually dispersed by shearing between glass slides to a granularity <<10 µm. Approximately 1 mg of material was mounted for SRD analysis in a 0.2 mm diameter glass capillary. The composite sample of natural moolooite varied in colour from grey near the sealed end of the capillary to turquoise in the central region, with the discolouration being attributed to differences in radiation colour-centre densities following variable exposure to laboratory XRD radiation.
SRD patterns were measured using the Powder Diffraction Beamline at the Australian Synchrotron (AS) which was set to provide a photon energy 18.0068 keV (λ = 0.68816 Å). Each capillary was mounted on a crystallographic goniometer head and rotated at 15 rpm. Patterns were measured using Debye-Scherrer geometry with a goniometer diameter = 152 cm, over the 2θ range 5.5087° to 85.3236° and with an effective step size = 0.00375°. The SRD incident and diffracted beams were fully polarised. The incident beam dimensions at the capillary were approximately 3 mm × 1 mm. Two patterns were measured for the natural moolooite – one for the central 5 mm portion (Pattern A – mainly turquoise material) and a second pattern at the end of the capillary which included grey material (Pattern B). Patterns were measured with a 16 module Mythen II microstrip X-ray detector system (Schmitt et al., Reference Schmitt, Bronnimann, Eikenberry, Gozzo, Horrmann, Horisberger and Patterson2003), each module covering ca. 4.8° in 2θ with there being a gap of ca. 0.2° between the segments covered by adjacent detector modules. Each pattern was measured twice using 600 s acquisitions, with the Mythen detector being off-set by 0.5° for the second data acquisition. The two off-set patterns were merged using the program PDViPeR. An additional pattern was measured for a NIST SRM-660b LaB6 powder under exactly the same conditions to determine the instrument wavelength, the 2θ 0 correction and the instrument full-width-half-maximum (FWHM) widths for the Bragg peaks. A 2θ 0 value = 0.0036° was determined by Rietveld fitting to the LaB6 data. Peak positions, above-background intensities and FWHM peak widths were determined with the PANalytical HighScore Plus (HSP) Version 3.0 utility PROFIT. The merged SRD patterns for the four samples have been provided as Supplemental data.
Pattern indexing and space group checks were conducted with the HSP program, and Rietveld computations were performed with HSP and also parallel Rietveld calculations conducted with the Bruker Topas (Version 5) program. The CIF file used to model the CuSO4. 5H2O crystal structure was taken from ICSD-60059.
IV. RESULTS AND DISCUSSION
A. Moolooite SRD patterns
Figure 5 shows moolooite SRD patterns A and B. It is evident from the plots that the space group decribes the diffraction line positions very well and that the indexing is in accord with that by Clarke and Williams (Reference Clarke and Williams1986) for DS data. There is no evidence in the SRD patterns for (i) supercell lines reported by Clarke and Williams (see Table I) or (ii) for additional lines for the β-Cu oxalate polymorph which is also described as the MDO1 polytype – see Figure 4. Accordingly, it is confirmed that the moolooite specimens examined are described by the FDSF superposition structure. Comparison of Patterns A and B showed that there are no pattern differences evident which might point to crystallographic differences. The overall intensities of the Bragg peaks for pattern A are approximately 3 × more intense than those for Pattern B on which basis Pattern A was used for the subsequent crystallographic work having effectively a substantially greater diffracting volume. Both patterns have impurity features according to the identifications provided in Table II.
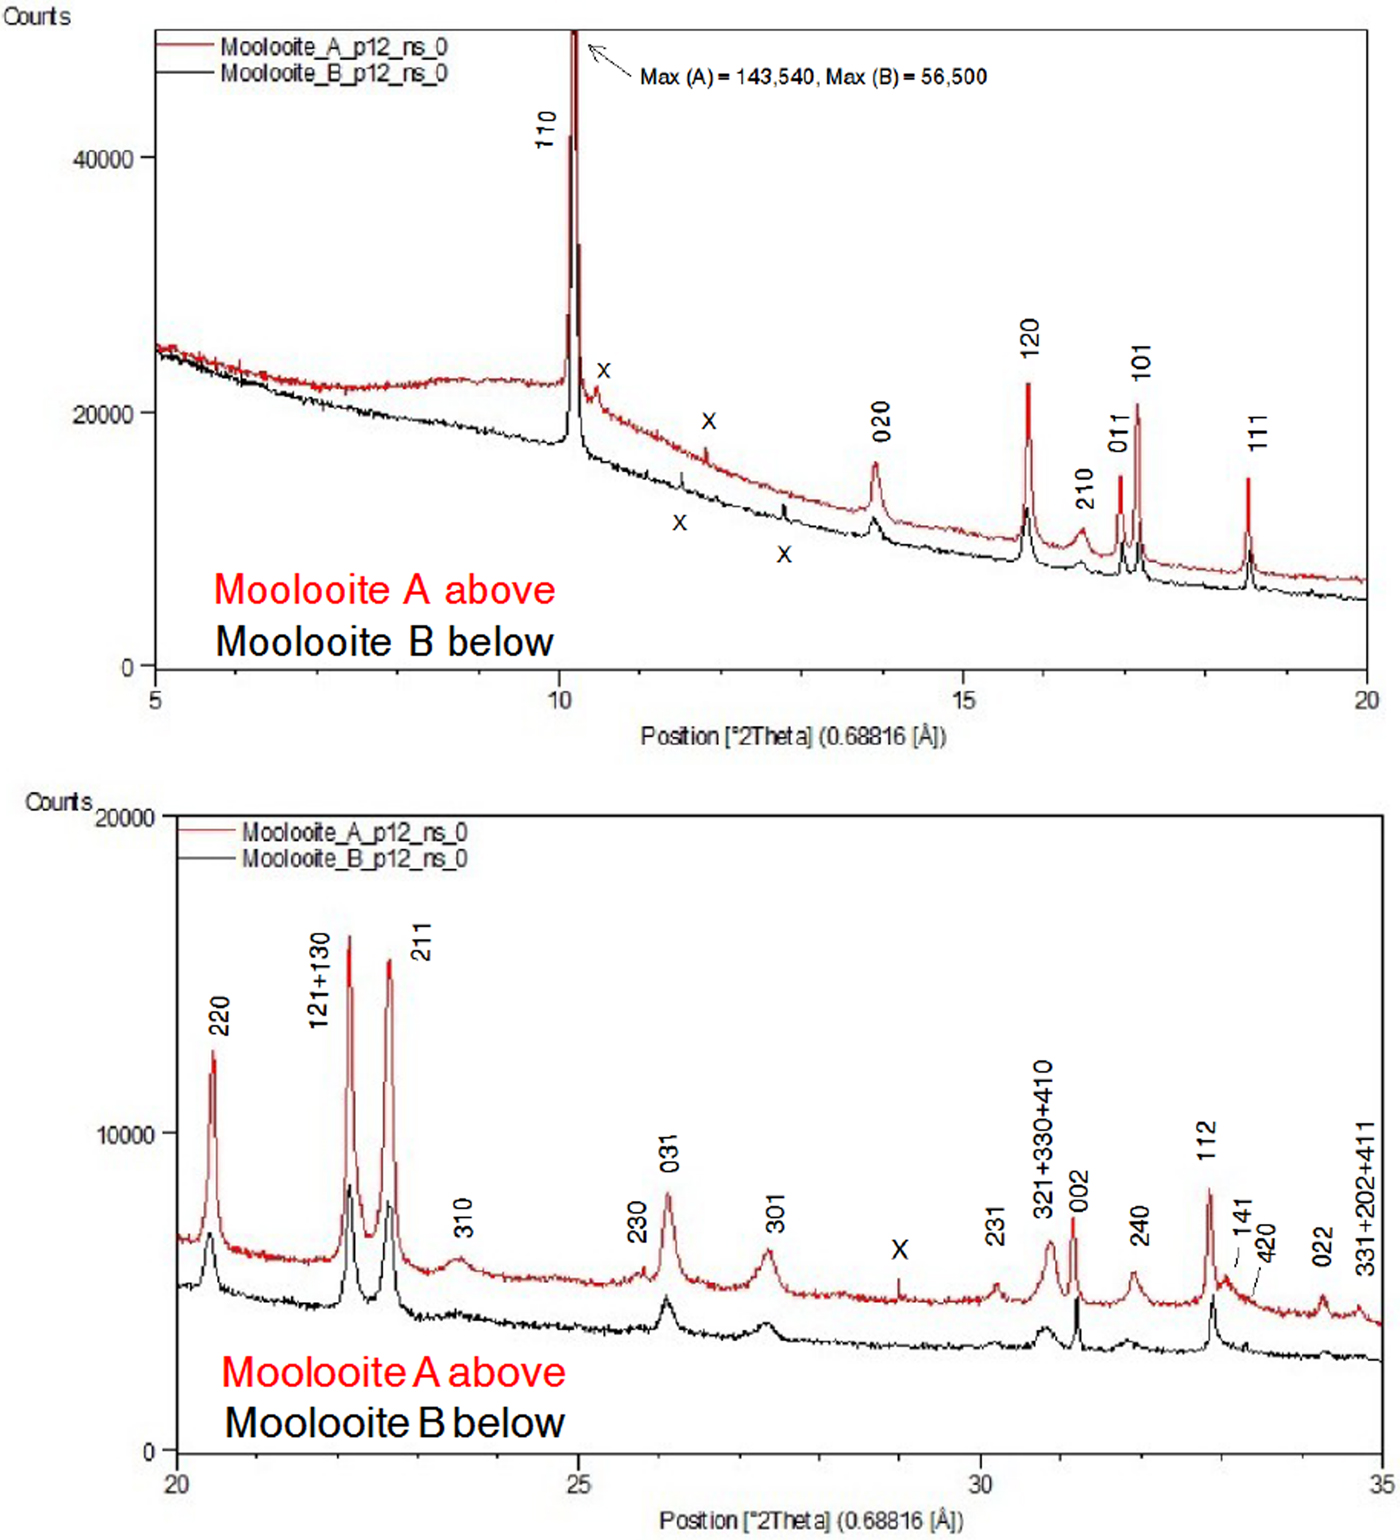
Table I. Moolooite SRD data (Pattern A) compared with Debye-Scherrer XRD data from Clarke and Williams (Reference Clarke and Williams1986).
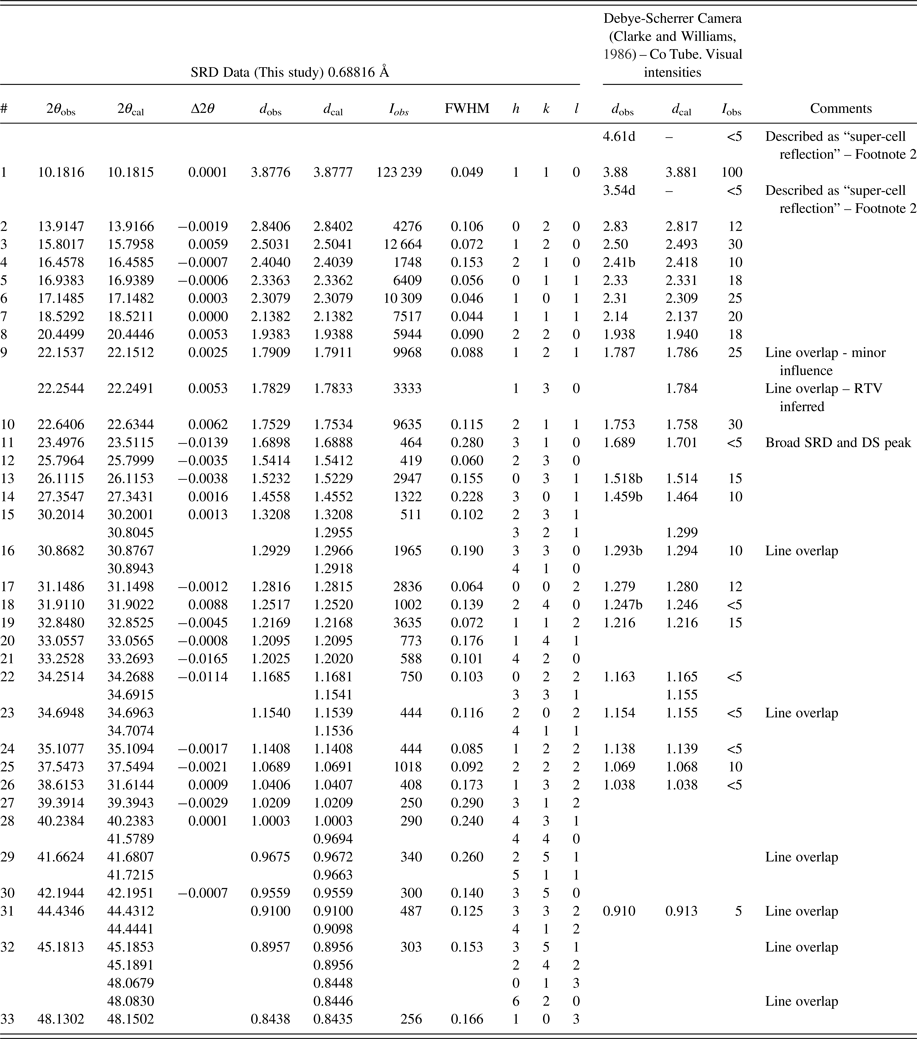
1)Contaminant lines omitted – see Table II. d-spacings calculated for space group Pnnm lines with Rietveld unit-cell parameters a = 5.3064, b = 5.6804, c = 2.5630 Å.
2)The diffuse 4.61 and 3.54 Å lines from Clarke & Williams Debye-Scherrer data may be MDO1 polytype reflections, 10–1 and 11–1, respectively.
3)Smith-Snyder figure-of-merit for indexing of SRD data (excluding overlapping lines): First 26 resolved lines to 2θ = 42.19°, d = 0.956 Å:  $ \lt \vert {\triangle (2\theta )} \vert \gt $ = 0.0042°, F 26 = 87 (0.0042, 37).
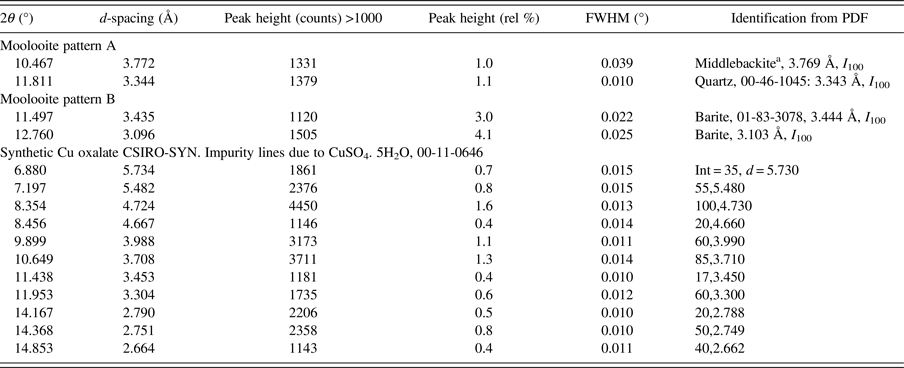
Table II. Impurity phase identifications for SRD moolooite patterns A and B, and for the synthetic Cu oxalate pattern CSIRO-SYN.

a Middlebackite, Cu2C2O4(OH)2: new copper oxalate mineral (Elliott, Reference Elliott2016 and Reference Elliott2018; Clarke and O'Connor Reference Clarke and O'ConnorIn progress and O'Connor et al., Reference O'Connor, Clarke and KimptonIn progress).
Table I gives an analysis of the moolooite SRD data set in sufficient detail to provide data for natural moolooite in the ICDD-PDF database. The attachment also compares the SRD data with the DS data published by Clarke and Williams (Reference Clarke and Williams1986). The following observations are made from the comparison. Overall, there is consistency between the SRD and DS data sets with the exception of the two weak, “diffuse” lines reported by Clarke & Williams which appear to correspond to the most intense non-family MDO1 polytype lines. As expected, the SRD set has added substantial additional information to that from the laboratory DS set – notably by detecting additional lines, and importantly by providing line width estimates. The additional 13 SRD lines are all very weak lines which would be below the laboratory DS detection limit.
The moolooite space group was determined with great caution in view of the similarities in patterns for the orthorhombic and monoclinic polymorphs. The HSP search program was used for ab-initio indexing with the algorithms: DICVOL04 (Boltif and Louer algorithm) and TREOR90 (Werner algorithm). The same solution was obtained for all calculations using 29 fully-resolved lines. The SRD orthorhombic fit from indexing after least squares fitting, assuming Pnnm, gave reasonable agreement between the measured and calculated line positions, with a Smith-Snyder figure-of-merit F 26 = 87 (0.0081, 37). From Rietveld analysis, the optimised unit-cell parameters gave improved agreement which reflects the excellent quality of the SRD measurements: F 26 = 167 (0.0042, 37). It is noted also that the best monoclinic fit to the Pattern A data assuming the monoclinic space group P21/n was poor according to expectations for SRD data: F 29 = 4.4 (0.023, 296) which indicates that the moolooite material reported here cannot be described as monoclinic. The final set of moolooite unit-cell parameters – see Table I – was a = 5.3064(2), b = 5.6804(2), c = 2.5630(1) Å. Space group possibilities were examined using HSP which identified Pnnm (#58) as the best possible space group choice according to the systematic absence conditions: h0l, h + l = 2n; 0kl, k + l = 2n; h00, h = 2n; 0k0, k = 2n; 00l, l = 2n. However it is noted for the axial reflections that (i) h00 reflections were not detected, and (ii) only 020 was measured for 0k0 and only 002 for 00l.
B. Synthesised Cu oxalate SRD patterns
Figure 6 provides a comparison of the SRD patterns for the two synthesised Cu oxalate patterns. The following comments are made on the data.
• The two patterns both show clear evidence of the presence of additional “non-family” reflections expected for the MDO1 polytype, as illustrated in Figure 4. In particular, CSIRO-SYN shows the broad non-family (NF) lines 10–1, 11–1, 101 and 111 and the overlapping line triplet 121/22–1/30–1, none of which is observed for moolooite.
• The pattern for GCL-SYN is poorly defined relative to that for CSIRO-SYN which points to this sample having substantially reduced crystallinity, presumably because of the differences in the conditions under which the two synthetics were precipitated.
• The CSIRO-SYN pattern includes a sub-set of contaminant lines, all being because of a slight excess of CuSO4. 5H2O reagent in the synthesis – see Table II.
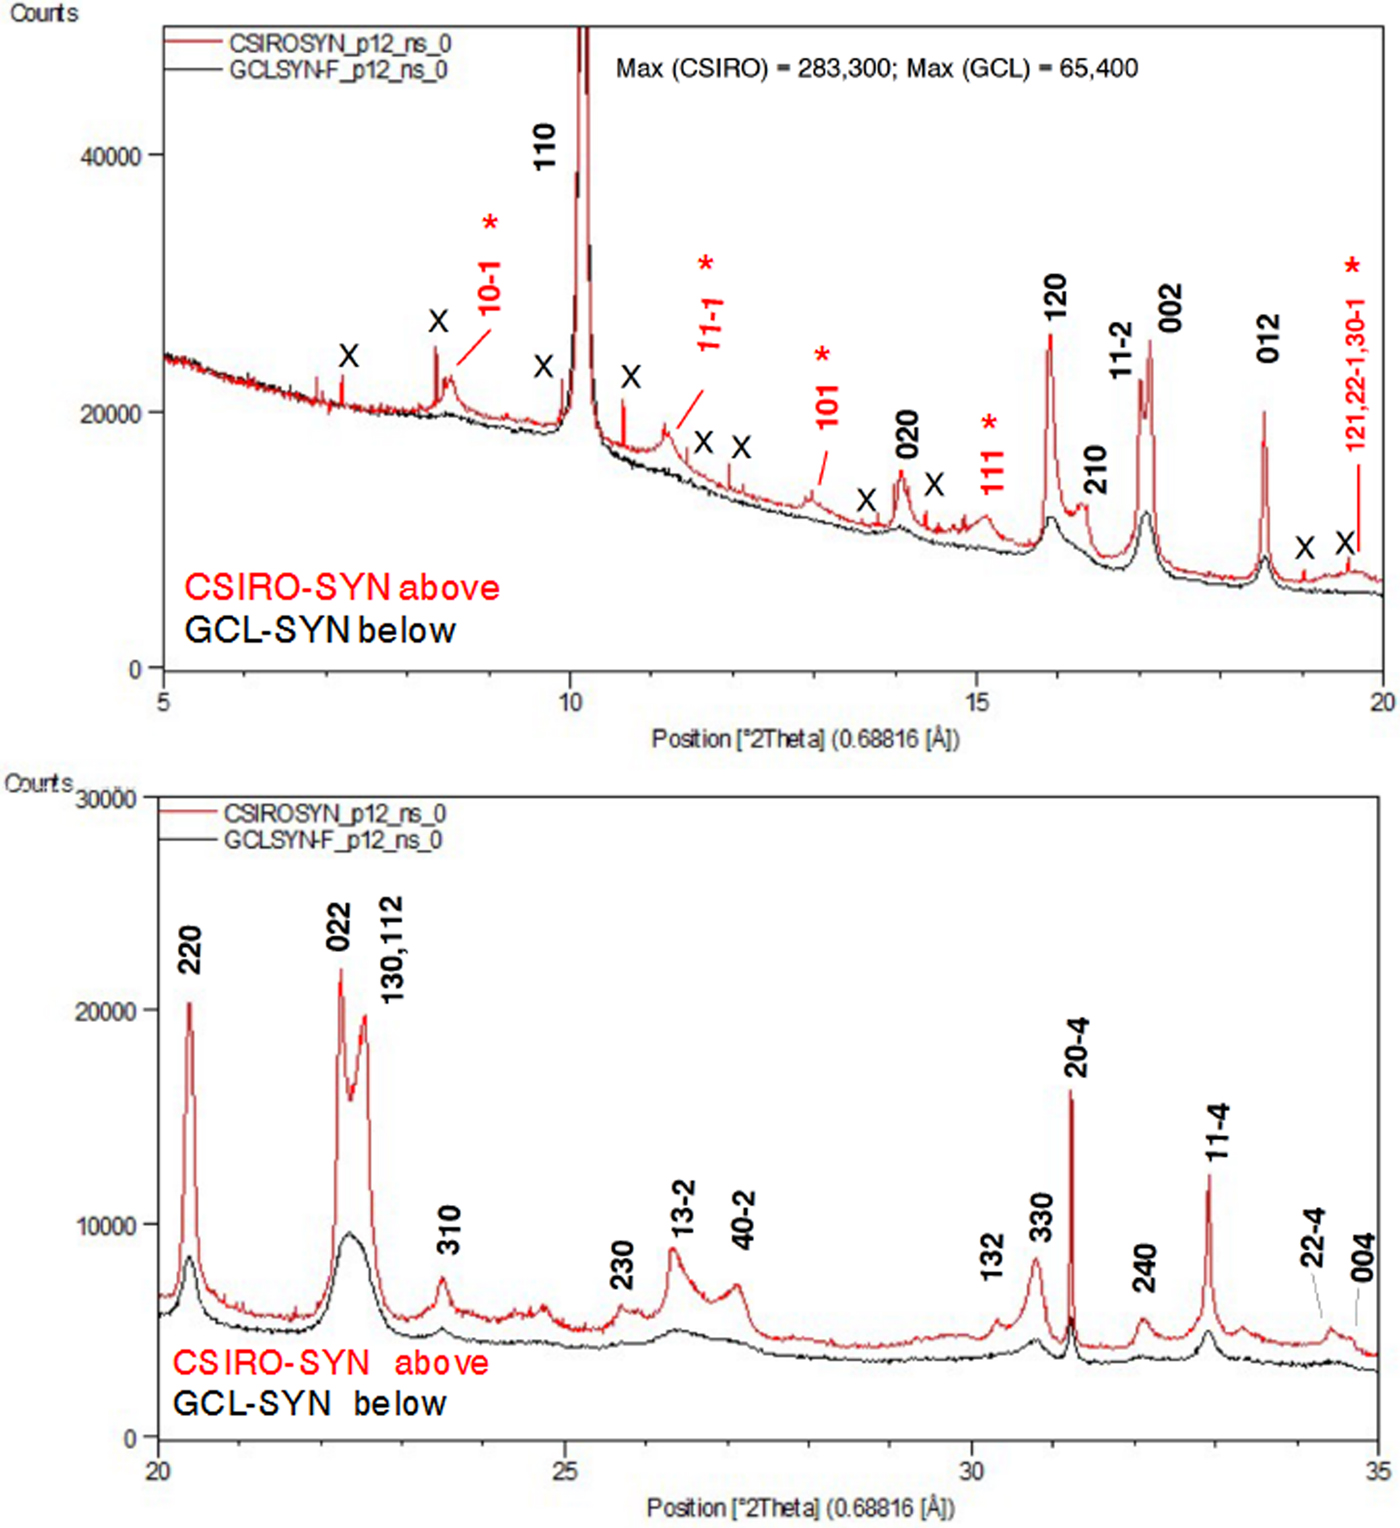
Figure 6. (Color online) SRD patterns for the synthetic Cu oxalate samples: CSIRO-SYN and GCL-SYN-F. λ = 0.688161 Å. Line hkl indices for space group P21/n – see Table III. Indices in red (marked with asterisk) in (a) are MDO1 polytype NF lines not observed for the natural moolooite material.
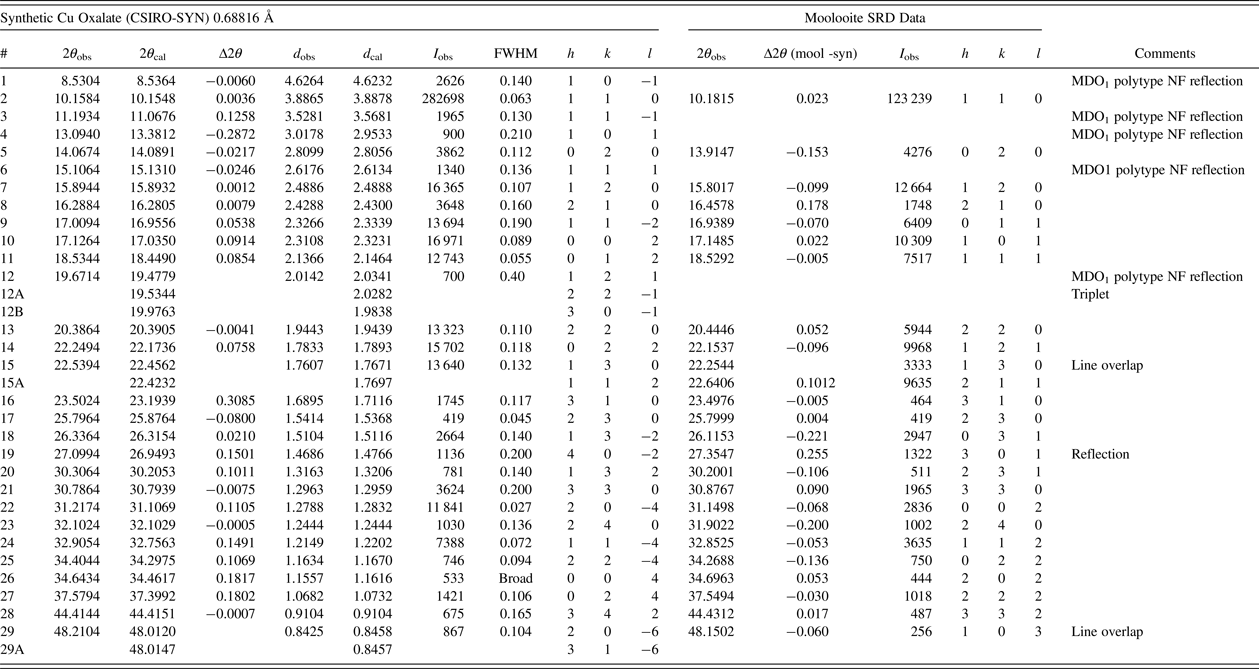
Table III gives the line-by-line analysis of the CSIRO-SYN data following the indexing procedure. Pattern indexing and space group determination were conducted as for the moolooite pattern. A set of 20 lines which appeared to be free of peak overlap and for which the peak intensity exceeded 1000 units was selected for indexing. This included four reflections thought to be MDO1 polytype reflections: 10–1, 11–1, 101 and 111 (see Figure 6). The DICVOL04 and TREOR 90 programs each gave the same solution: (i) monoclinic fit, with space group P21/n; (ii) least squares optimised cell parameters: a = 5.957(7), b = 5.611(5), c = 5.133(7) Å; β = 115.16(2)°; (iii) measured-calculated line fits from indexing: F 20 = 2.9 (0.078, 51). The indexing data fit is well outside the level of agreement expected for SRD data. In particular, there are lines for which the value of |Δ(2θ)| exceeds 0.1°: MDO1 lines 11–1 (0.13°) and 101 (−0.29°), and family lines 310 (0.31°), 40–2 (0.15°), 20–4 (0.11°), 11–4 (0.15°), 004 (0.18°) and 024 (0.18°). The large difference for 310 is not explained. The systematic absences for the SRD data indicate space group P21/n: h0l, h + l = 2n; h00, h = 2n; 0k0, k = 2n; 00l, l = 2n. However for the axial reflections (i) h00 reflections were not detected, and (ii) only 020 was observed for 0k0.
Table III. Synthetic Cu Oxalate SRD data (CSIRO-SYN) compared with Moolooite SRD data.

Contaminant lines omitted – see Table II. d-spacings calculated with unit-cell parameters a = 5.957, b = 5.611, c = 5.133 Å, β = 115.16°.
Smith-Snyder figure-of-merit for indexing of SRD data (excluding overlapping lines): First 20 resolved lines to 2θ = 31.22°, d = 1.279 Å:  $ \lt \vert {\triangle (2\theta )} \vert \gt $ = 0.078°, F 20 = 2.9 (0.078, 51).
C. Comparison of SRD patterns for moolooite and synthesised Cu oxalate specimens
Figure 7 compares the moolooite and CSIRO-SYN synthetic patterns. This underlines the comments of Schmittler (Reference Schmittler1968) that sample-sample line position differences may be observed depending on the synthesis conditions. The analysis of line position differences in Table III shows that the differences in line positions range from −0.221 to +0.255°, with the average difference magnitude being 0.075°. These large differences indicate the need to develop a set of suitable SRD patterns for a suite of synthetic Cu oxalates so that these may be characterised in greater detail.
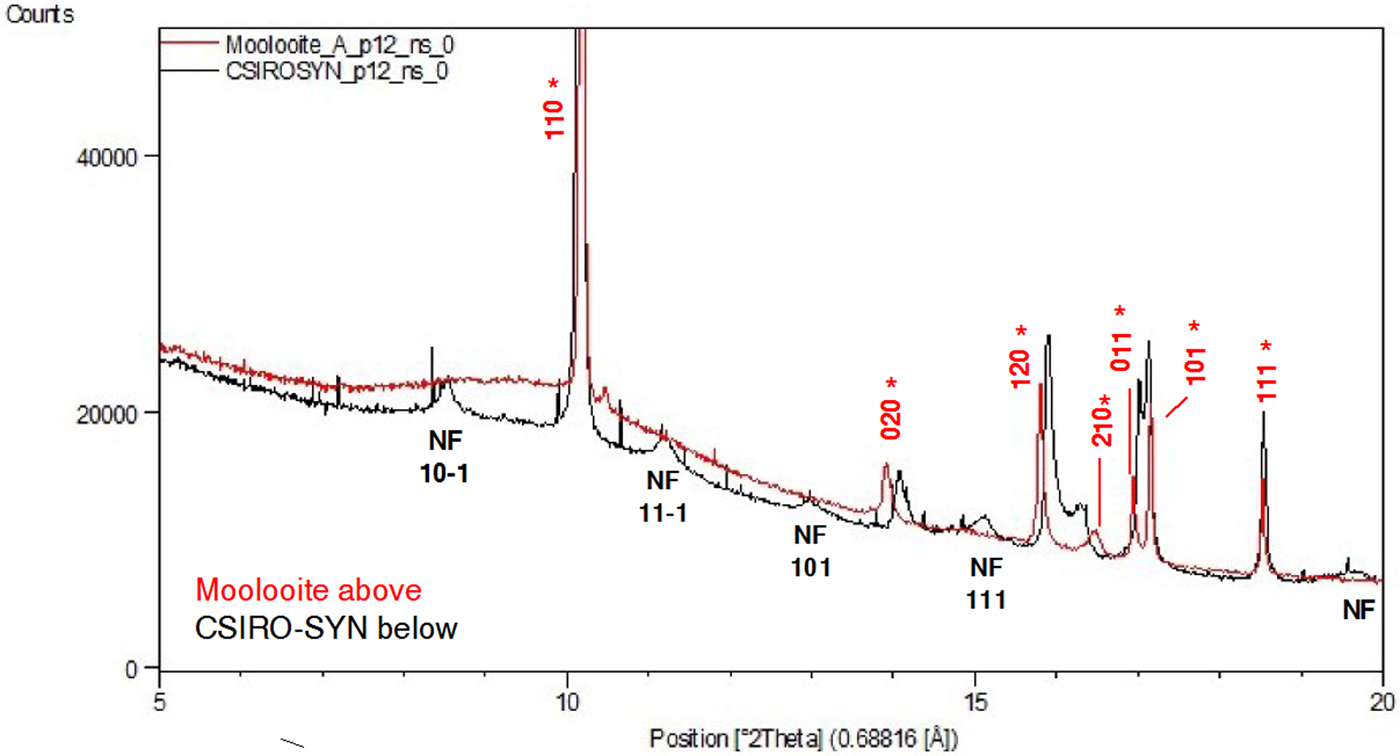
Figure 7. (Color Online) Comparison of SRD patterns of moolooite and synthetic CSIRO-SYN specimens. λ = 0.688161 Å. Moolooite line hkl indices in red (marked with asterisk) are for space group Pnnm – see Table I. NF = non-family lines for MDO1 polytype.
D. Crystal data for moolooite and synthesised Cu oxalate specimens: water content
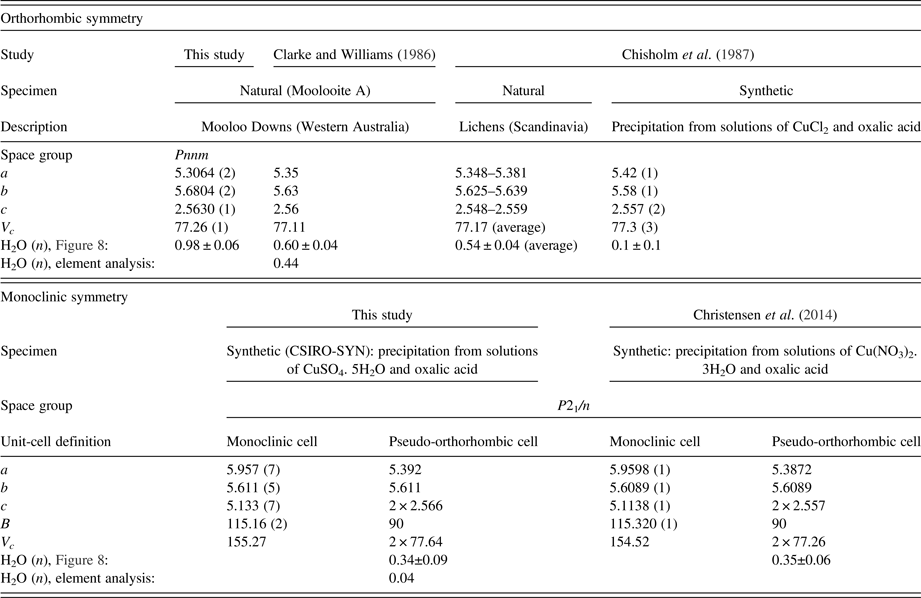
Table IV summarises the crystal data for the moolooite and synthetic Cu oxalate from this study and compares these with data from the literature. With reference to water content, Figure 8 shows the water-content calibration plots re-constructed from Schmittler (Reference Schmittler1968) who reported pyncnometry data for samples A, B, and F from that study. The Schmittler plots show trends in the a- and b-parameters for orthorhombic and monoclinic cells, with the latter being expressed for the equivalent pseudo-orthorhombic cell. The Schmittler linear relations in Figure 8 are –
 $$a = 5.419 - 0.108\, {\rm n} {\rm \AA}$$
 $$b = 5.552 + 0.139\,{\rm n} {\rm \AA}$$
where n represents the water content. nH2O. The estimates of water content from Figure 8 for the samples considered in this SRD study indicate that for n in CuC2O4. nH2O the value for Moolooite A was n ≈ 1.0, whereas the value for the CSIRO-SYN sample was much smaller, n ≈ 0.3. Overall the data points in Figure 8 indicate that the three natural samples have higher water content than the synthetics. This strengthens speculation from the literature that the level of zeolitic water in moolooite appears to depend on the conditions under which the sample forms – notably on the time taken for crystallisation to occur which is likely to be much longer in the natural environment.
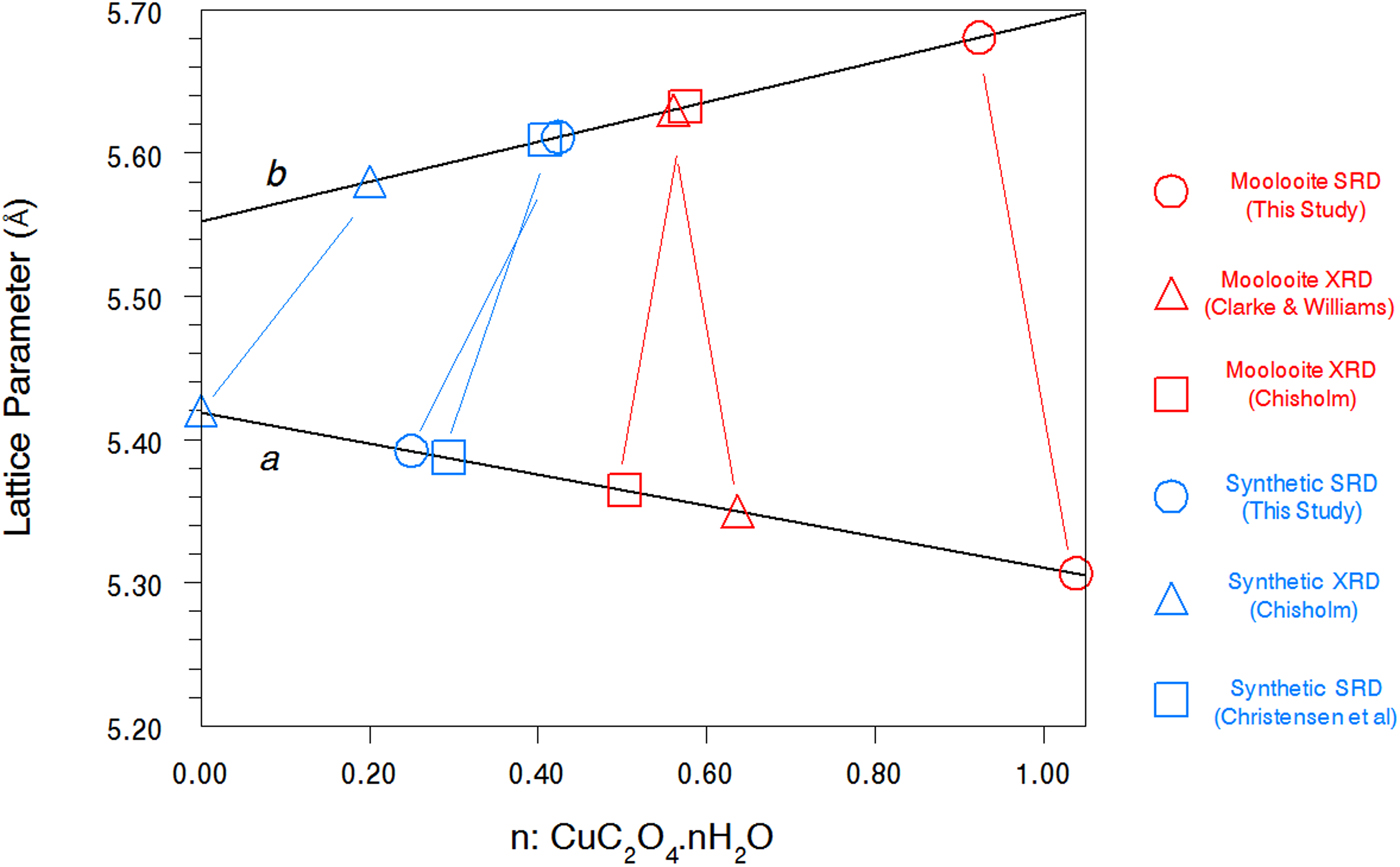
Figure 8. (Color online) Calibration plots after Schmittler (Reference Schmittler1968) based on unit cell parameters for orthorhombic and pseudo-orthorhombic data sets vs. measured value of water content: n in CuC2O4. nH2O. Unit-cell parameters from present and other studies are shown with estimates of n from the Schmittler calibrations.
Table IV. Comparison of unit-cell parameters from current study and water content estimates from the Schmittler (Reference Schmittler1968) calibrations – see Figure 8.
E. Line broadening effects in the SRD data – microstrain and ordered domain sizes
The moolooite SRD lines all show substantial specimen broadening (ranging from ca. 0.03° to about 0.27°, noting that the instrument width is only ca. 0.015° (see Table I). Figure 9 shows the line width FWHM values (instrument corrected) vs. 2θ. Only strong lines (peak intensity >1000) and with minimal line overlap are included in the plot. It is evident that the moolooite lines all show specimen broadening (up to about 0.15°) pointing to microstrain and/or crystallite domain size broadening, and also that the broadening effects are anisotropic. The anisotropic broadening character resembles that for the synthetic copper oxalates reported by Christensen et al. (Reference Christensen, Lebech, Andersen and Grivel2014).
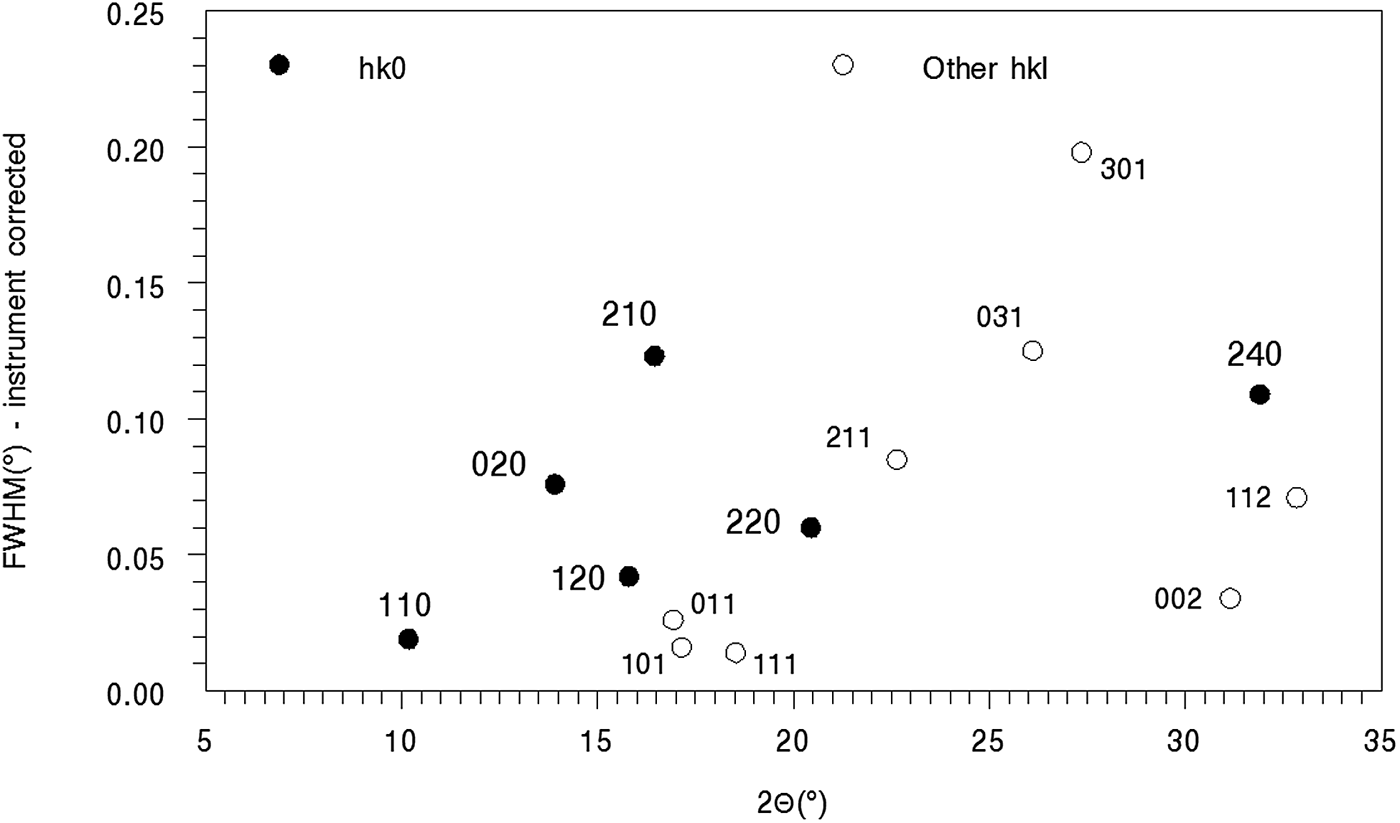
Figure 9. Line broadening for moolooite SRD pattern A. The most intense lines, with peak intensity >1,000, are shown in the plot.
The Williamson-Hall plot for the hk0 reflections was used to obtain indicative information for strain and size notwithstanding the obvious anisotropic nature of the broadening. The intercept of the plot provides a crystallite size estimate of ca. 200 nm, and from the gradient a substantial microstrain estimate of 0.10%. The broadening is dominated by microstrain.
F. Crystal structure analysis of natural and synthetic sample SRD data
1. Moolooite SRD pattern A
Rietveld structural model optimisation was conducted starting with atom coordinates from Schmittler (Reference Schmittler1968) transformed to space group Pnnm. The Rietveld calculations were run with two programs – HighScore Plus (Version 3.1) and Topas (Version 5) to check the reproducibility of the Rietveld calculations which proved to be excellent. The refinement involved fitting –
• Pattern background with a 15-term Chebyshev function
• Pseudo-Voigt and TCH-pV profile shape function types for the HighScore Plus and Topas computations, respectively.
The instrument 2θ-zero setting was fixed at the value determined with a calibration standard – see Table I.
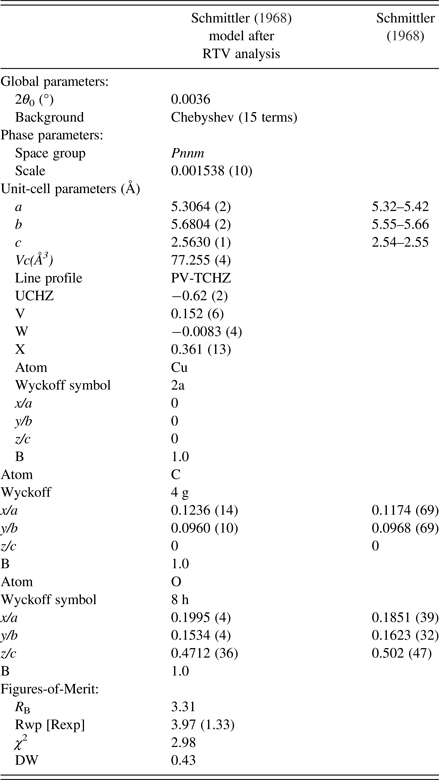
The final parameter sets from the Topas program are given in Table V, and the Rietveld residual plot from program Topas is provided in Figure 10. The Rietveld calculations were more challenging than would be typically expected for a fully-ordered material. Importantly, we note from Table V that the Durbin-Watson statistic (Hill and Flack, Reference Hill and Flack1987), DW, is 0.43 which indicates pronounced serial correlation between some parameters, in this case probably because of the planar groups and infinite linear molecules in the structure. Specifically, there were substantial correlations between the phase scale factor, the C and O atom positional parameters and the atom thermal parameters. The strong serial correlations between the atom positional parameters are shown in Table VI. The following substantial correlations are noted:
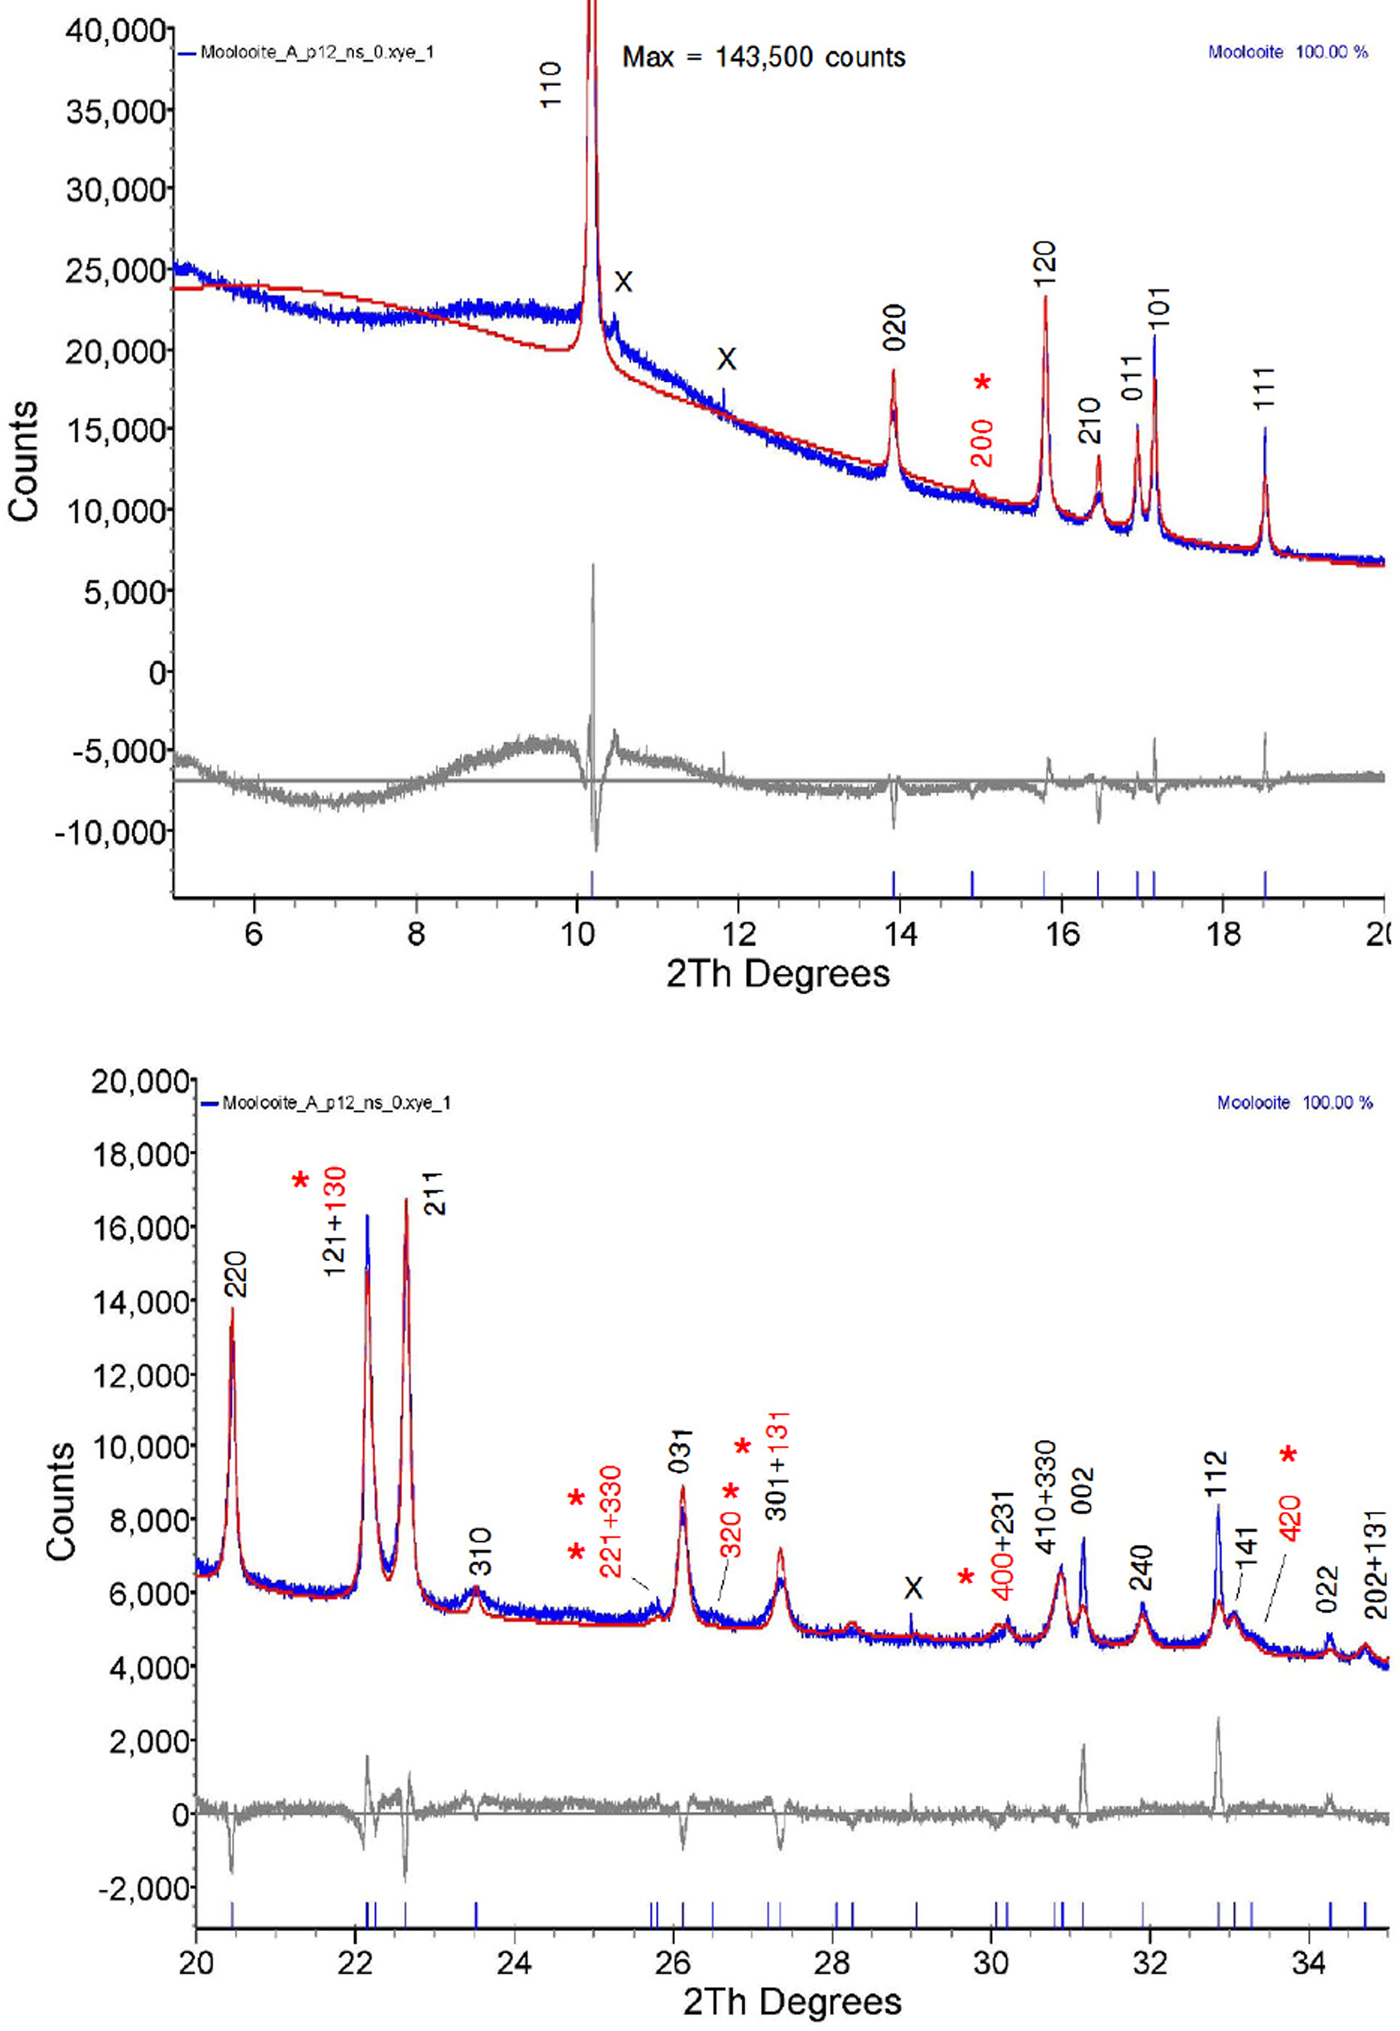
Figure 10. (color online) Rietveld difference residual plot for moolooite SRD pattern using the optimised structural model defined in Table V. Measured pattern in blue, calculated pattern in red. Symbol x = contaminant lines. hkl indices shown in red (marked with asterisk) are weak measured lines not listed in Table II of the Clarke & Williams study of moolooite DS data.
Table V. Structural parameters from moolooite SRD Rietveld calculations.

Table VI. Selected correlation coefficients between C and O atom positional parameters.

Schmittler moolooite orthorhombic model Rietveld optimised with SRD data – see Table V. Off-diagonal values greater than 0.40 are highlighted.
C(x/a): correlations with C(y/b) and O(z/c)
C(y/b): correlation with O(z/c).
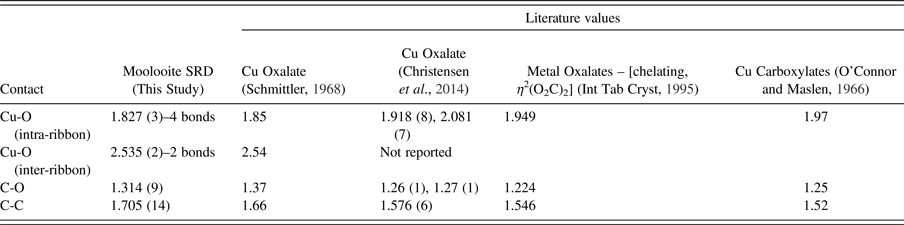
Table VII provides the interatomic distances for the Topas atom parameter set, and compares these with values from the literature. We note that distances are probably acceptable taking into account the refinement correlations.
Table VII. Interatomic distances (Å) for moolooite SRD Rietveld structural optimisation calculations.
The residual plot indicates that all above-background Bragg peaks have been accounted for by the structural model, there being sound agreement between the calculated and measured lines other than the peak shape for some lines, noting that strain/size anisotropy was not factored into the refinement model. There is no indication of non-family lines for the MDO1 polytype seen for the CSIRO-SYN specimen (see following subsection). The Rietveld residual plots were used to validate some line identities shown in Table I.
2. Synthetic copper oxalate structural model evaluations
The approach taken with respect to crystal structure for the synthetic material was to critically examine the structure models described in the literature, specifically –
• Structural polytypes according to OD theory as described by Fichtner-Schmittler (Reference Fichtner-Schmittler1979), noting especially the MDO1 and MDO2 polytypes – see discussion above, “Structural Models for Copper Oxalate from the Literature”
• The ordered structural model proposed by Kondrashev et al. (Reference Kondrashev, Bogdanov, Golubev and Pron1985), described as the β-oxalate polymorph which may be also described as the MDO1 polytype
• The disordered model from Christensen et al. (Reference Christensen, Lebech, Andersen and Grivel2014).
SRD pattern simulations were conducted for each of the models to test agreement with the measured SRD patterns. The comparisons showed (i) reasonable agreement between measured and simulated patterns for the Fichtner-Schmittler MDO1 polytype; but (ii) less agreement for the Kondrashev et al. (Reference Kondrashev, Bogdanov, Golubev and Pron1985) and Christensen et al. (Reference Christensen, Lebech, Andersen and Grivel2014) models. By way of example, Figure 11 shows a comparison of the Christensen et al. (Reference Christensen, Lebech, Andersen and Grivel2014) simulation with the measured SRD pattern for CSIRO-SYN, with the indexing for the measured pattern indicating the sound agreement for the Fichtner-Schmittler MDO1 structure. The Christensen et al. (Reference Christensen, Lebech, Andersen and Grivel2014) model produces the family lines for the MDO1 model seen in the measured pattern but does not generate the measured non-family lines.
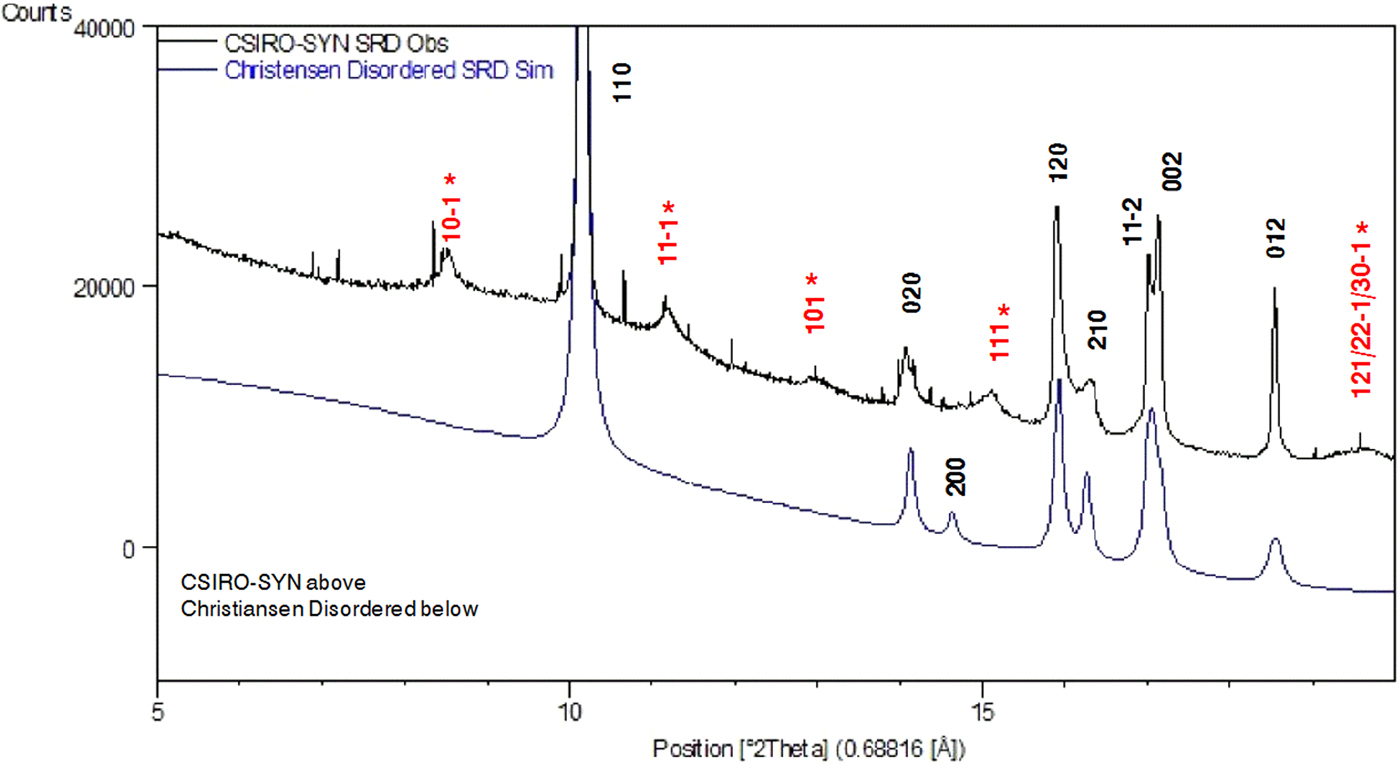
Figure 11. (Color online) Simulation testing of monoclinic structural models from Christensen et al. (Reference Christensen, Lebech, Andersen and Grivel2014). Comparison with the measured SRD pattern for CSIRO-SYN material. Line hkl indices for space group P21/n – see Table III. Indices in red (marked with asterisk) are MDO1 polytype NF lines not observed for the moolooite material. The very narrow lines are because of the CuSO4. 5H2O contaminant (ca. 3% by weight).
Taking the above observations into account, and the obvious dependence of line positions and intensities on synthesis conditions, it is evident that there is a need for a major systematic study on the way in which synthesis conditions influence the disordered character of Cu oxalates. It is noted that the results of Rietveld optimisations with the CSIRO-SYN pattern (not reported here) were inconclusive owing to model shortcomings.
V. CONCLUSION
The SRD study has extended the results of the earlier moolooite crystallographic study using Debye-Scherrer photographic data (Clarke and Williams, Reference Clarke and Williams1986). In particular, it has been confirmed that moolooite has a FDSF structure with the orthorhombic space group Pnnm first proposed for synthetic copper oxalates by Schmittler (Reference Schmittler1968). SRD data from two synthetic specimens has shown a closely-related monoclinic structure with space group P21/n. The subtle differences in SRD diffraction patterns for the two forms are attributed to differences in disorder according to interpretations by Fichtner-Schmittler (Reference Fichtner-Schmittler1979) using OD theory. It is evident from this study and earlier work that the monoclinic diffraction patterns show differences in peak position, breadth and intensity which are attributed to conditions under which the material was synthesised. This clearly complicates the identification of synthetics. The complexity is best described by seeing the orthorhombic form as fully disordered, whereas monoclinic synthetics are partially disordered. The best structural fit to the synthetic SRD data was obtained using the model proposed by Christensen et al. (Reference Christensen, Lebech, Andersen and Grivel2014) from another SRD study of synthetics in which there are two equally-weighted configurations which are offset by c/2 in space group P21/n. However, this model does not simulate some of the weak non-family peaks predicted by Fichtner-Schmittler for the MDO1 polytype.
The question of the level and form of water in the materials has been considered with the approach followed by Schmittler (Reference Schmittler1968) using thermogravimetry and pycnometry, which points to the moolooite material examined in this study having the formula CuC2O4. nH2O where n ≈ 1.0, It is postulated that the absence of water reported for some synthetic specimens may be attributed to the conditions under which synthetic samples have been synthesised. The conditions under which moolooite forms naturally appear to favour the take up of zeolitic water. Further work of the type conducted by Schmittler is required to determine the degree of zeolitic water in individual samples.
From indexing, new PDF data for both moolooite and one of the synthetic specimens have been proposed for inclusion in the ICDD-PDF database to assist the identification of natural and synthetic copper oxalate specimens. It will be important for the future releases of the database to include high-quality patterns for natural moolooite as well as synthetic Cu oxalates.
Supplementary material
The supplementary material for this article can be found at https://doi.org/10.1017/S0885715619000101.
Acknowledgements
The Australian Synchrotron is thanked for providing access to the Powder Diffraction Beamline, and also Curtin University and the ChemCentre for use of the additional instrumentation and software used in the study. M Bussell, formerly of CSIRO Division of Mineralogy, is acknowledged for preparing the CSIRO-SYN synthetic moolooite, R Hermann of the Department of Chemistry, Curtin University for element analysis (CHN) of synthetic moolooite and D Allen of MBS Environmental for advice on the chemical synthesis. P Elliott of The University of Adelaide is acknowledged for providing a pre-proof copy of the accepted article Elliott (Reference Elliott2018).