I. INTRODUCTION
The extensively use of devices based on modified lead titanate, PbTiO3 (PT), in a large number of applications, such as piezoelectric actuators and ultrasonic transducers, increases continuously because of its high-density and optimal piezoelectric properties (Jaffe et al., Reference Jaffe, Cook and Jaffe1971; Ikeda, Reference Ikeda1990; Xu, Reference Xu1991; Jona and Shirane, Reference Jona and Shirane1993; Rabe et al., Reference Rabe, Ahn and Triscone2007). Rare earths’ doping decreases the large tetragonal distortion of PT at room temperature (c/a – 1 = 0.064), which results in a highly brittle material (Xu, Reference Xu1991; Jona and Shirane, Reference Jona and Shirane1993). Assuming the lanthanide ions valence fixed, it has been proposed that the preference for their incorporation into both A and B sites of the perovskite structure depends on the ion size and therefore the cation ratio. The analyses have suggested the A-site incorporation, but exceptions have been reported for smaller lanthanide ions (Ln3+) in barium titanate (BT) (Buscaglia et al., Reference Buscaglia, Buscaglia, Viviani, Nanni and Hanuskova2000, Reference Buscaglia, Viviani, Buscaglia, Bottino and Nanni2002, Reference Buscaglia, Buscaglia, Ghigna, Viviani, Spinolo, Testino and Nanni2004).
The incorporation of rare-earth ions into A and/or B sites is an issue of interest in perovskite oxides titanates (García-Zaldívar et al., Reference García-Zaldívar, Saniger, Torres-García, Flores, Calderón-Piñar, Llópiz and Peláiz-Barranco1997; Buscaglia et al., Reference Buscaglia, Buscaglia, Viviani, Nanni and Hanuskova2000, Reference Buscaglia, Viviani, Buscaglia, Bottino and Nanni2002, Reference Buscaglia, Buscaglia, Ghigna, Viviani, Spinolo, Testino and Nanni2004; Peláiz-Barranco et al., Reference Peláiz-Barranco, Guerra, Calderón-Piñar, Aragó, García-Zaldívar, López-Noda, Gonzalo and Eiras2009, Reference Peláiz-Barranco, Mendez-González, Calderón-Piñar, Arnold, Keeble and Guerra2010, Reference Peláiz-Barranco, Mendez-González, Arnold, Saint-Grégoire and Keeble2012; Mackie et al., Reference Mackie, Peláiz-Barranco and Keeble2010; Mendez-González et al., Reference Mendez-González, Peláiz-Barranco, Calderón-Piñar and Castellanos-Guzmán2010, Reference Mendez-González, Pentón-Madrigal, Peláiz-Barranco, Figueroa, de Oliveira and Concepción-Rosabal2014). Previous studies, in BT ceramics, have shown that Ba2+ can be substituted by La3+ and Pr3+ ions, while fractional occupancy of Gd3+ and Tb3+ at the B site has been predicted (Buscaglia et al., Reference Buscaglia, Buscaglia, Viviani, Nanni and Hanuskova2000).
The Ln3+ ion doped PT co-doped with 2 at% Mn has also been studied (García-Zaldívar et al., Reference García-Zaldívar, Saniger, Torres-García, Flores, Calderón-Piñar, Llópiz and Peláiz-Barranco1997; Peláiz-Barranco et al., Reference Peláiz-Barranco, Guerra, Calderón-Piñar, Aragó, García-Zaldívar, López-Noda, Gonzalo and Eiras2009). Experimental results have shown the partial substitution of smaller ions Dy3+, Ho3+, and Er3+ at the B site (García-Zaldívar et al., Reference García-Zaldívar, Saniger, Torres-García, Flores, Calderón-Piñar, Llópiz and Peláiz-Barranco1997), and a preferential incorporation of larger ions (La3+, Nd3+, Sm3+, and Gd3+) at the A site of the perovskite structure (Peláiz-Barranco et al., Reference Peláiz-Barranco, Guerra, Calderón-Piñar, Aragó, García-Zaldívar, López-Noda, Gonzalo and Eiras2009). In PT ceramics, which has been modified with 2 and 8 at% of La3+ ions, the behavior of the tetragonal distortion and the transition temperature has been found to be consistent with the A-site substitution, while the results for Sm3+, Eu3+, Gd3+, and Dy3+ ions have suggested the incorporation at both A and B sites (Mendez-González et al., Reference Mendez-González, Peláiz-Barranco, Calderón-Piñar and Castellanos-Guzmán2010; Peláiz-Barranco et al., Reference Peláiz-Barranco, Mendez-González, Calderón-Piñar, Arnold, Keeble and Guerra2010, Reference Peláiz-Barranco, Mendez-González, Arnold, Saint-Grégoire and Keeble2012). Recently, a structural study using the extended X-ray absorption fine structure technique and Rietveld refinement on a PT compound modified with 8 at% of Eu3+ has shown the incorporation of this ion at both sites of the perovskite structure (Mendez-González et al., Reference Mendez-González, Pentón-Madrigal, Peláiz-Barranco, Figueroa, de Oliveira and Concepción-Rosabal2014). Indirect evidence on the possible incorporation of lanthanide elements at both crystallographic sites has been established from positron annihilation lifetime spectroscopy measurements on rare-earth-doped PT ceramics (Peláiz-Barranco et al., Reference Peláiz-Barranco, Mendez-González, Arnold, Saint-Grégoire and Keeble2012). The results have shown, qualitatively, a higher occupancy at the A site for La3+, Nd3+, and Eu3+ ions, while smaller ions (Gd3+ and Dy3+) mostly prefer to occupy the B site.
On the other hand, the doping in the PT structure influences significantly on its vibrational spectrum making Raman scattering a useful technique to analyze its structure locally. Softening of the lower frequency transverse optical phonon modes can be used to probe the changes in the vibrational spectrum. It has been found that the E(TO1) soft phonons correspond to a large vibration of the lead ion with respect to a TiO6 octahedral, which is only slightly distorted (Kholkin et al., Reference Kholkin, Bdikin, Yuzyuk, Almeida, Chaves, Calzada and Mendiola2004; Paris et al., Reference Paris, Gurgel, Boschi, Joya, Pizani, Souza, Leite, Varela and Longo2008). The remaining bands, at higher frequencies, correspond to different modes of vibration because of the relative movement between oxygen ions and ions at the B site of the structure (Slodczyk et al., Reference Slodczyk, Colomban and Pham-Thi2008).
The X-ray diffraction (XRD) technique is also suitable to analyze the structure on a long-range scale. To analyze quantitatively the possible incorporation of Ln3+ elements into A and B sites of the PT structure, Rietveld refinement can be carried out (Young, Reference Young1993). In the present work, the incorporation of lanthanide ions (Ln3+) into the PT perovskite structure (Ln3+ = La3+, Sm3+, Eu3+, and Dy3+) is quantitatively evaluated.
II. EXPERIMENTAL
A. Ceramic samples preparation
The ceramic samples were prepared using the standard solid-state reaction method (Xu, Reference Xu1991) from nominal composition Pb0.88 Ln 0.08TiO3, where Ln = La, Sm, Eu, and Dy. The stoichiometric mixture of high-purity oxides (PbO, TiO2, and Ln2O3) was first ball-milled and then prefired at 900 °C in air for 2 h. The calcined powders were again ball-milled. The powders were pressed uniaxially under 200 MPa to form thick discs. Finally, sintering was carried out in air at 1200 °C for 2 h, in a well-covered platinum crucible in order to minimize the evaporation of reagents. The samples are hereafter labeled as PTLn8.
B. Characterization
Raman spectra were recorded at room temperature using a Jobin Yvon T64000 spectrometer equipped, with a charge-coupled device, and polarized light from an Ar+ laser (λ = 514.5 nm). All spectra were obtained in backscattering geometry using a microprobe device that allows the incident light to be focused on the samples as a spot of about 2 µm in diameter. The spectra were corrected for the Bose–Einstein temperature factor.
The high-resolution XRD experiments were conducted using the XPD beam line at the Brazilian Synchrotron Light Laboratory (LNLS), Campinas, Brazil, with a Bragg–Brentano configuration, a crystal monochromator of Si (111) and a crystal analyzer of Ge (111). The measurements were made on powder samples at room temperature with a fixed counting time, a step of 0.02° and an incident wavelength of 1.770 93 Å. A LaB6 sample was used as external standard. Micrographs using scanning electron microscopy (SEM) were taken from fractured polycrystalline pellets. The experiments were performed at the Brazilian National Nanotechnology Laboratory (LNNano). The field emission gun-scanning electron microscope analysis (SEM-FEG) was made using a high-resolution FEI Inspect F50 at 30 kV, which is equipped with an electron microprobe spectrometer. The energy-dispersive spectroscopy spectra were obtained with good resolution, showing little overlap of the signal coming from the different elements present in the samples. The statistic was good, reaching a counts number of about 15 000 s−1 which means the possibility of achieving accuracy between 1 and 2% for the most of elements. In terms of at% it would represents an accuracy of up to 10−3 for the measurement.
III. RESULTS AND DISCUSSION
A. SEM-FEG analysis
The nominal compositions of the doped PTLn8 samples were verified using the microchemical analysis by means of SEM-FEG. The obtained chemical stoichiometry for the studied samples is presented in Table I. All compositions are around the nominal composition Pb0.88Ln0.08TiO3. The standard deviation of the weights % is <1%. However, the changes in composition appear in the second significant digit (Table I), which shows compositional changes as function of the lanthanides, in particular for the Pb2+ content. Moreover, a slight increase of the Pb2+ content for the Dy3+ doping can be observed.
Table I. X-ray microanalysis results for the studied samples.

The micrographs for all samples have shown well-defined particles with size of the order of 1 µm and with varying porosity. The PTDy8 sample shows a microstructure with large pores, while the porosity decreases with the increasing of the ionic radii (not shown).
B. Raman analysis
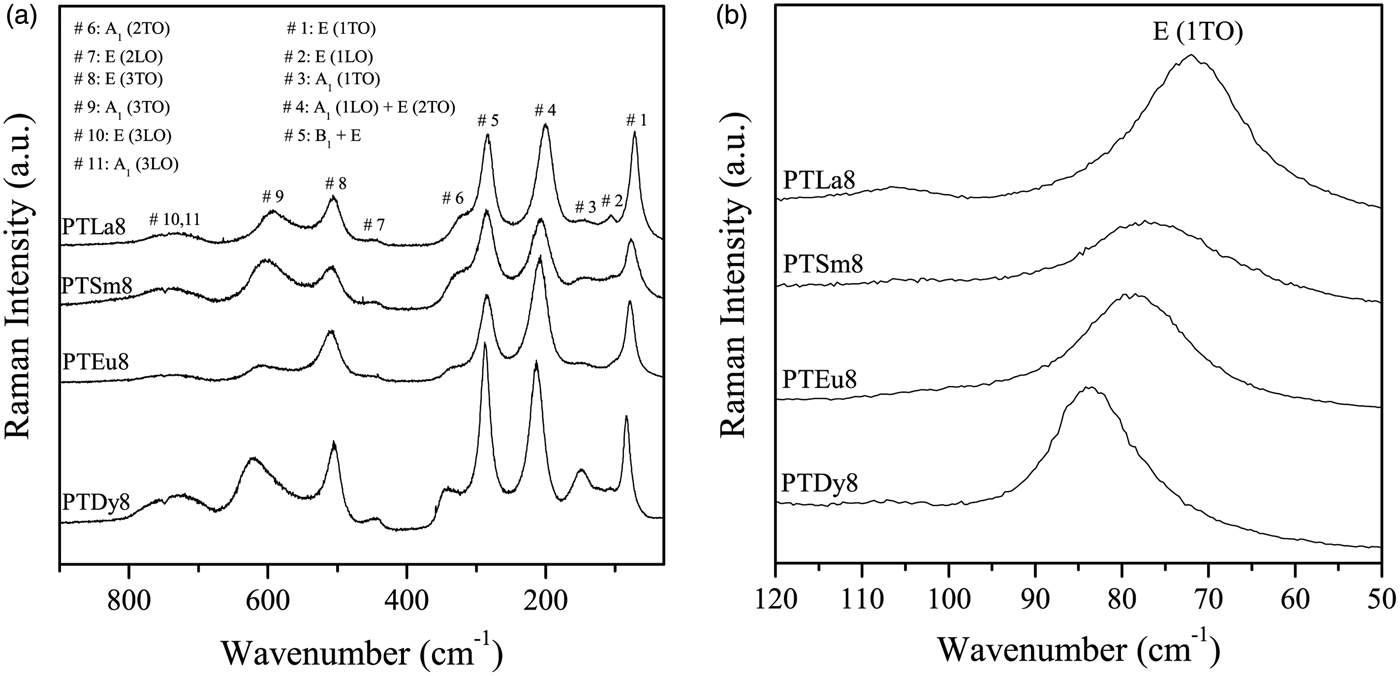
The room temperature Raman spectra for the 8 at%-doped PT samples are shown in Figure 1(a), within the frequency range of 30–900 cm−1. All the Raman modes were assigned according to Foster et al. (Reference Foster, Li, Grimsditch, Chan and Lam1993).
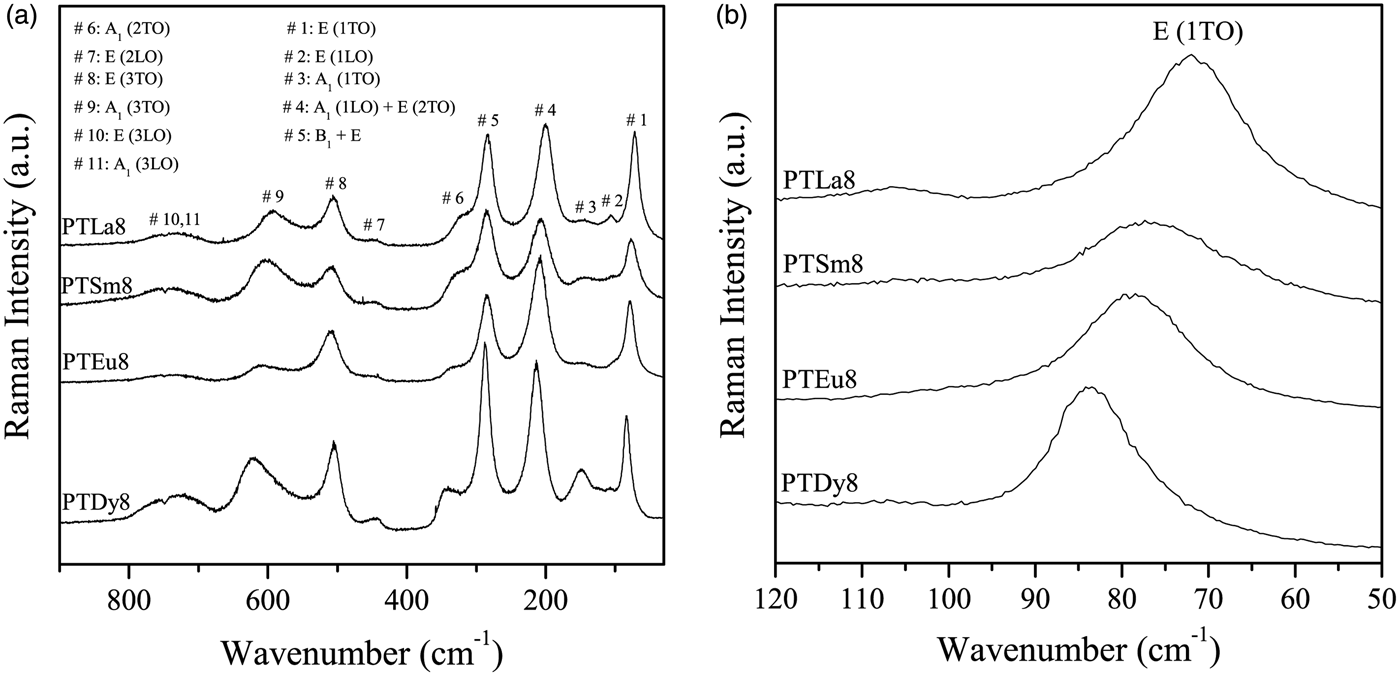
Figure 1. (a) Raman spectra, at room temperature, for the PTLn8 ceramics; (b) low-frequency region of the Raman spectra.
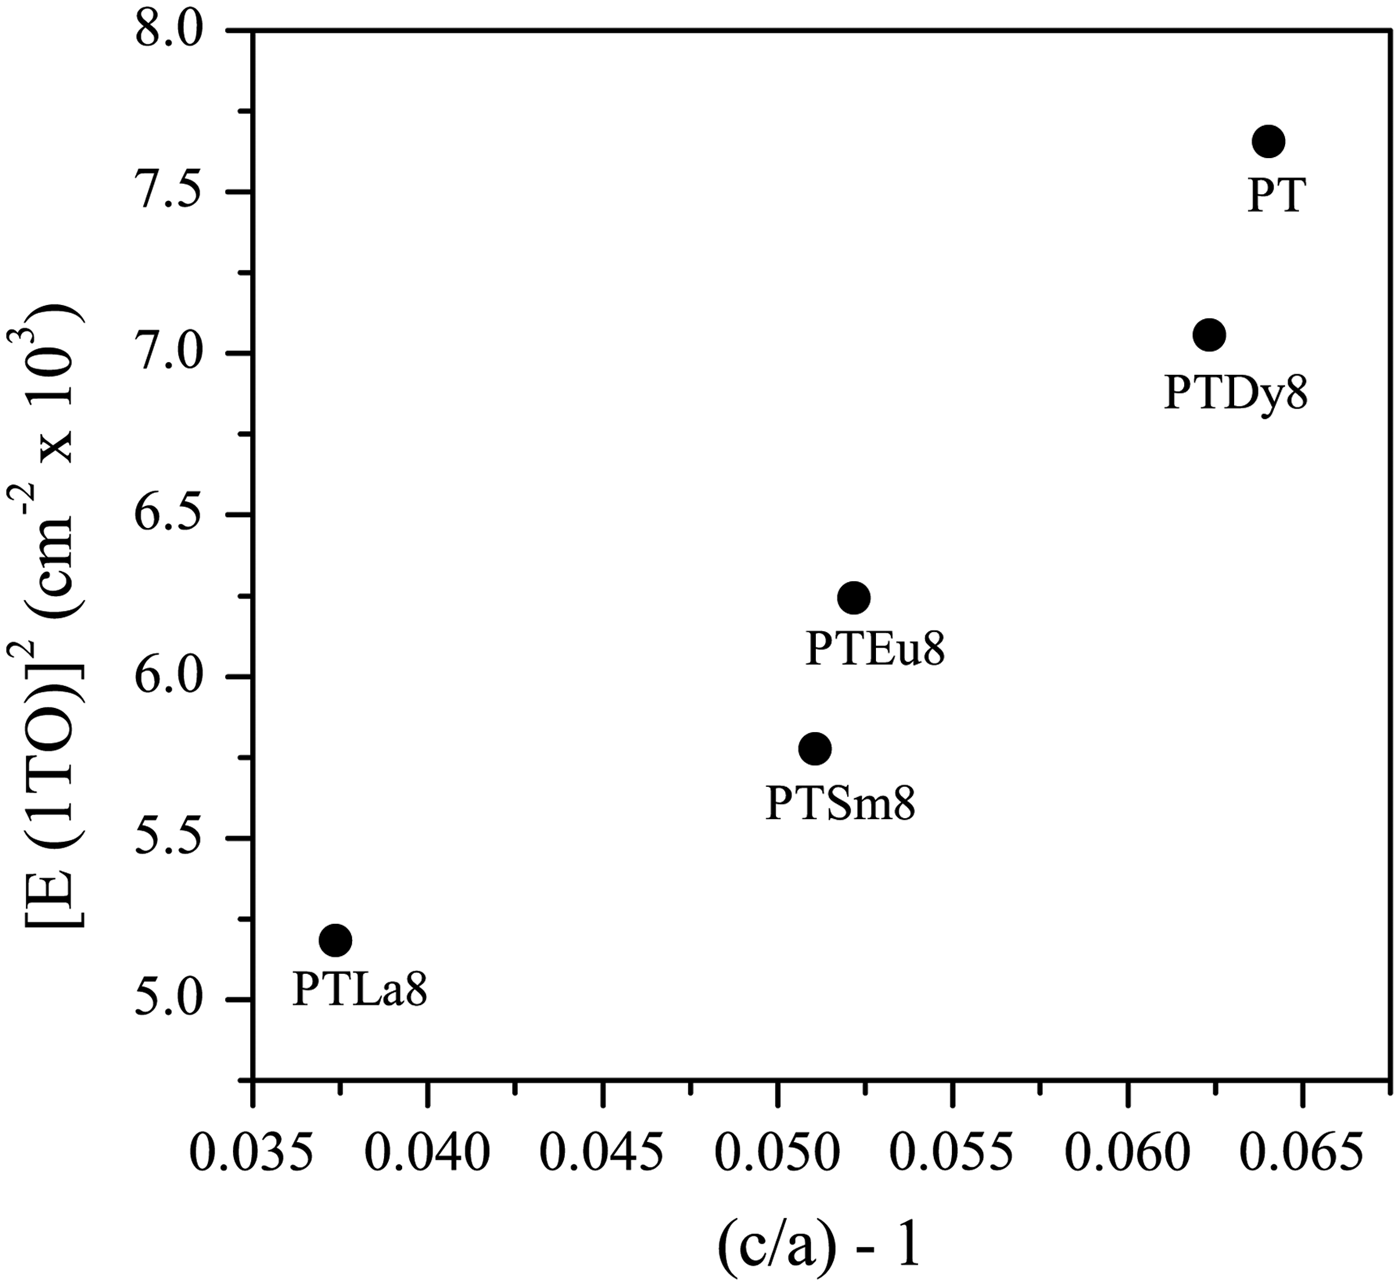
Basically, the effect of Ln3+ ions doping is to soften the lowest transverse optical mode E (1TO) because of the increase of the ionic radius [Figure 1(b)]. This behavior suggests that the incorporation of lanthanide ions induces a change in the crystal structure of the PT. As the average grain sizes in these samples are approximately the same (~1 µm), its effect on the mode shifts is negligible. The value for undoped PT, used as a reference, was taken from Paris et al. (Reference Paris, Gurgel, Boschi, Joya, Pizani, Souza, Leite, Varela and Longo2008). It can be observed that the values increase from 5184 to 7056 cm−1 with the decrease of the ionic radius of the rare-earth ions.
It is well known that there is a direct correspondence of the soft mode with the tetragonal distortion [(c/a) − 1 relation] (Dobal and Katiyar, Reference Dobal and Katiyar2002). Previous XRD experiments have shown an increase of the [(c/a) − 1] values with the decrease of the ionic radii of the rare earths (Peláiz-Barranco et al., Reference Peláiz-Barranco, Mendez-González, Arnold, Saint-Grégoire and Keeble2012). It could be expected an increase of [E (1TO)]2 as well (Figure 2). The increase of the [(c/a) − 1] values has been explained previously considering the partial occupation of Ln3+ ions at both A and B sites of the perovskite structure (Mendez-González et al., Reference Mendez-González, Peláiz-Barranco, Calderón-Piñar and Castellanos-Guzmán2010, Reference Mendez-González, Pentón-Madrigal, Peláiz-Barranco, Figueroa, de Oliveira and Concepción-Rosabal2014; Peláiz-Barranco et al., Reference Peláiz-Barranco, Mendez-González, Calderón-Piñar, Arnold, Keeble and Guerra2010, Reference Peláiz-Barranco, Mendez-González, Arnold, Saint-Grégoire and Keeble2012). For the initial structural model it could be considered that the observed [E (1TO)]2 behavior as a function of the tetragonal distortion, is also an experimental evidence of the partial occupation of Ln3+ ions at both crystallographic sites of the ABO3 structure.
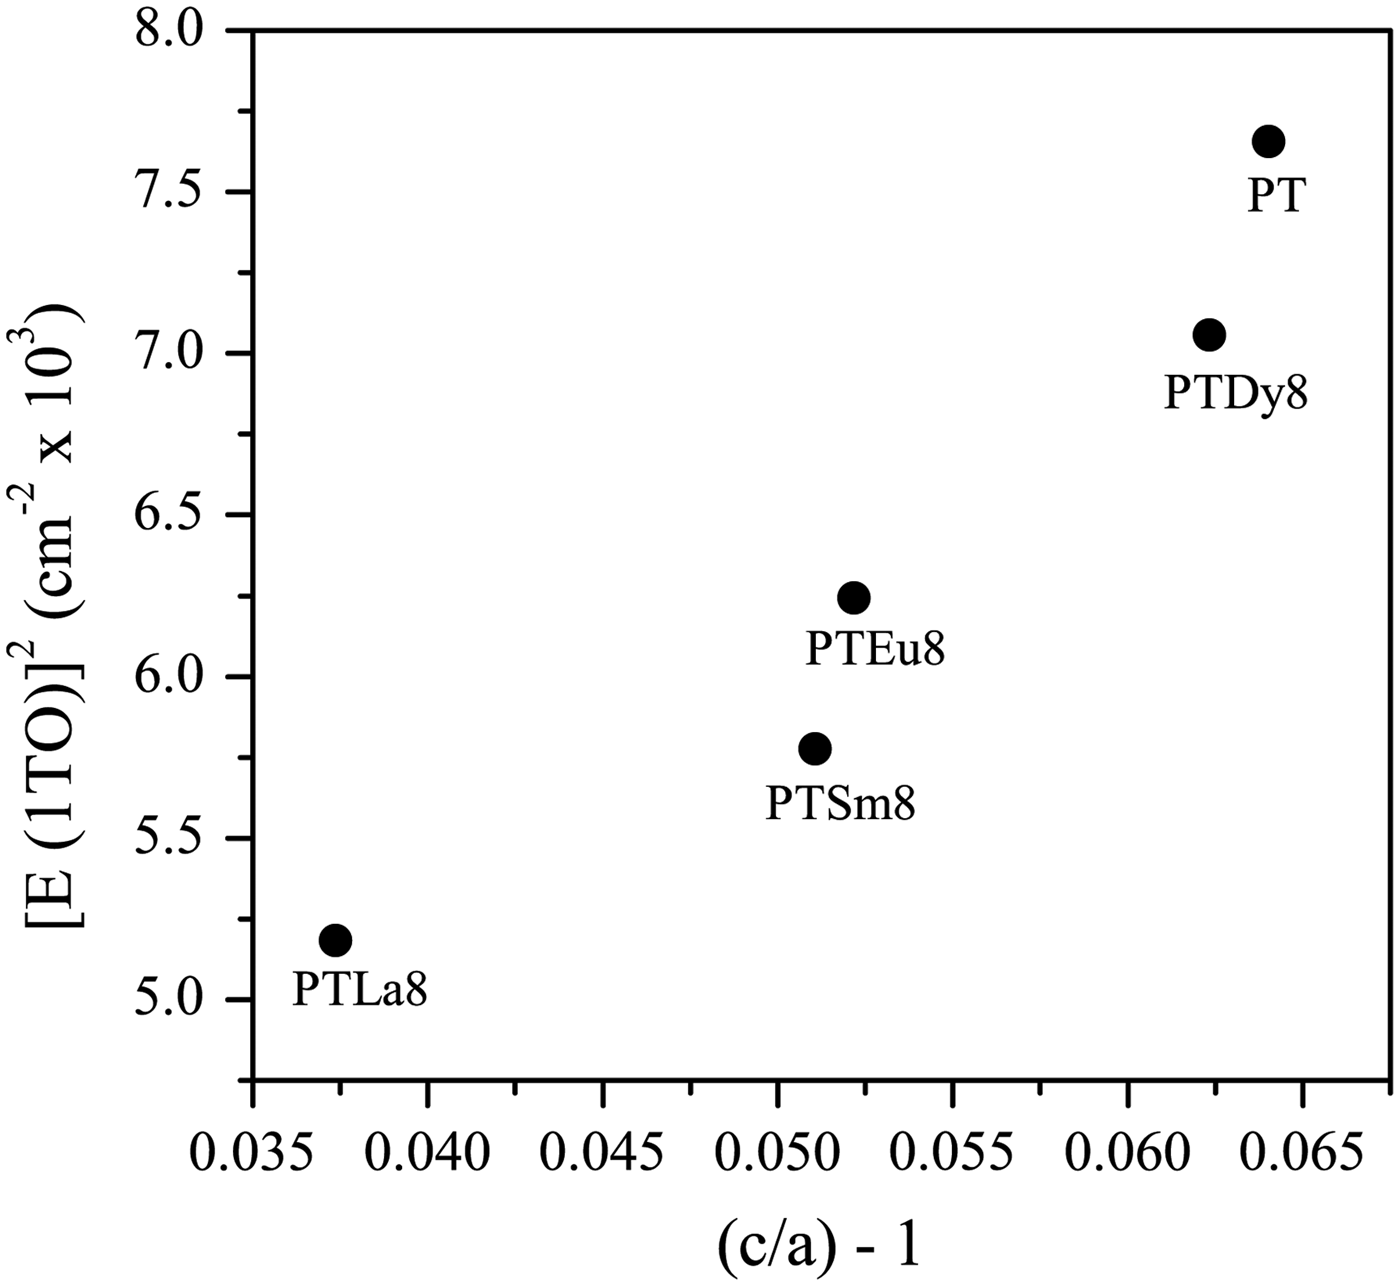
Figure 2. Squared frequency of the E (1TO) soft mode as function of [(c/a) − 1]. The data for the undoped lead titanate were taken from the previous papers (Paris et al., Reference Paris, Gurgel, Boschi, Joya, Pizani, Souza, Leite, Varela and Longo2008; Peláiz-Barranco et al., Reference Peláiz-Barranco, Mendez-González, Arnold, Saint-Grégoire and Keeble2012).
C. Rietveld refinements
The refinement of the structure for each composition was carried out using the Rietveld method, which is available in the FullProf_Suit software (Rodríguez-Carvajal, Reference Rodríguez-Carvajal1990). The initial structural model for the calculation of the diffraction patterns corresponds to the PT structure with a non-centrosymmetric space group P4mm (SPG No. 99). The structure data were taken from the “Inorganic Crystal Structure Database” (ICSD) (FIZ Karlsruhe, 2014). In the initial structural model, the experimental evidence from the Raman spectra and the results of the previous structural studies suggesting the incorporation of the lanthanide ions at both A and B sites have been considered (Mackie et al., Reference Mackie, Peláiz-Barranco and Keeble2010; Mendez-González et al., Reference Mendez-González, Peláiz-Barranco, Calderón-Piñar and Castellanos-Guzmán2010, Reference Mendez-González, Pentón-Madrigal, Peláiz-Barranco, Figueroa, de Oliveira and Concepción-Rosabal2014; Peláiz-Barranco et al., Reference Peláiz-Barranco, Mendez-González, Calderón-Piñar, Arnold, Keeble and Guerra2010, Reference Peláiz-Barranco, Mendez-González, Arnold, Saint-Grégoire and Keeble2012). The general nominal composition was Pb0.94Ln0.04Ti0.96Ln0.04O2.98 taking into account that the initial occupancy of Ln3+ at B site should be in correspondence with the calculated tolerance factor value for these compositions (Mendez-González et al., Reference Mendez-González, Peláiz-Barranco, Calderón-Piñar and Castellanos-Guzmán2010, Reference Mendez-González, Pentón-Madrigal, Peláiz-Barranco, Figueroa, de Oliveira and Concepción-Rosabal2014; Peláiz-Barranco et al., Reference Peláiz-Barranco, Mendez-González, Arnold, Saint-Grégoire and Keeble2012). The unit-cell origin was defined by fixing the Pb/Ln atoms at the (0, 0, 0) positions. The position of Ti/Ln was taken at [1/2, 1/2, z Ti/Ln], and the O(I) and O(II) positions were taken at [1/2, 1/2, z O(I)] and [1/2, 0, z O(II)], respectively.
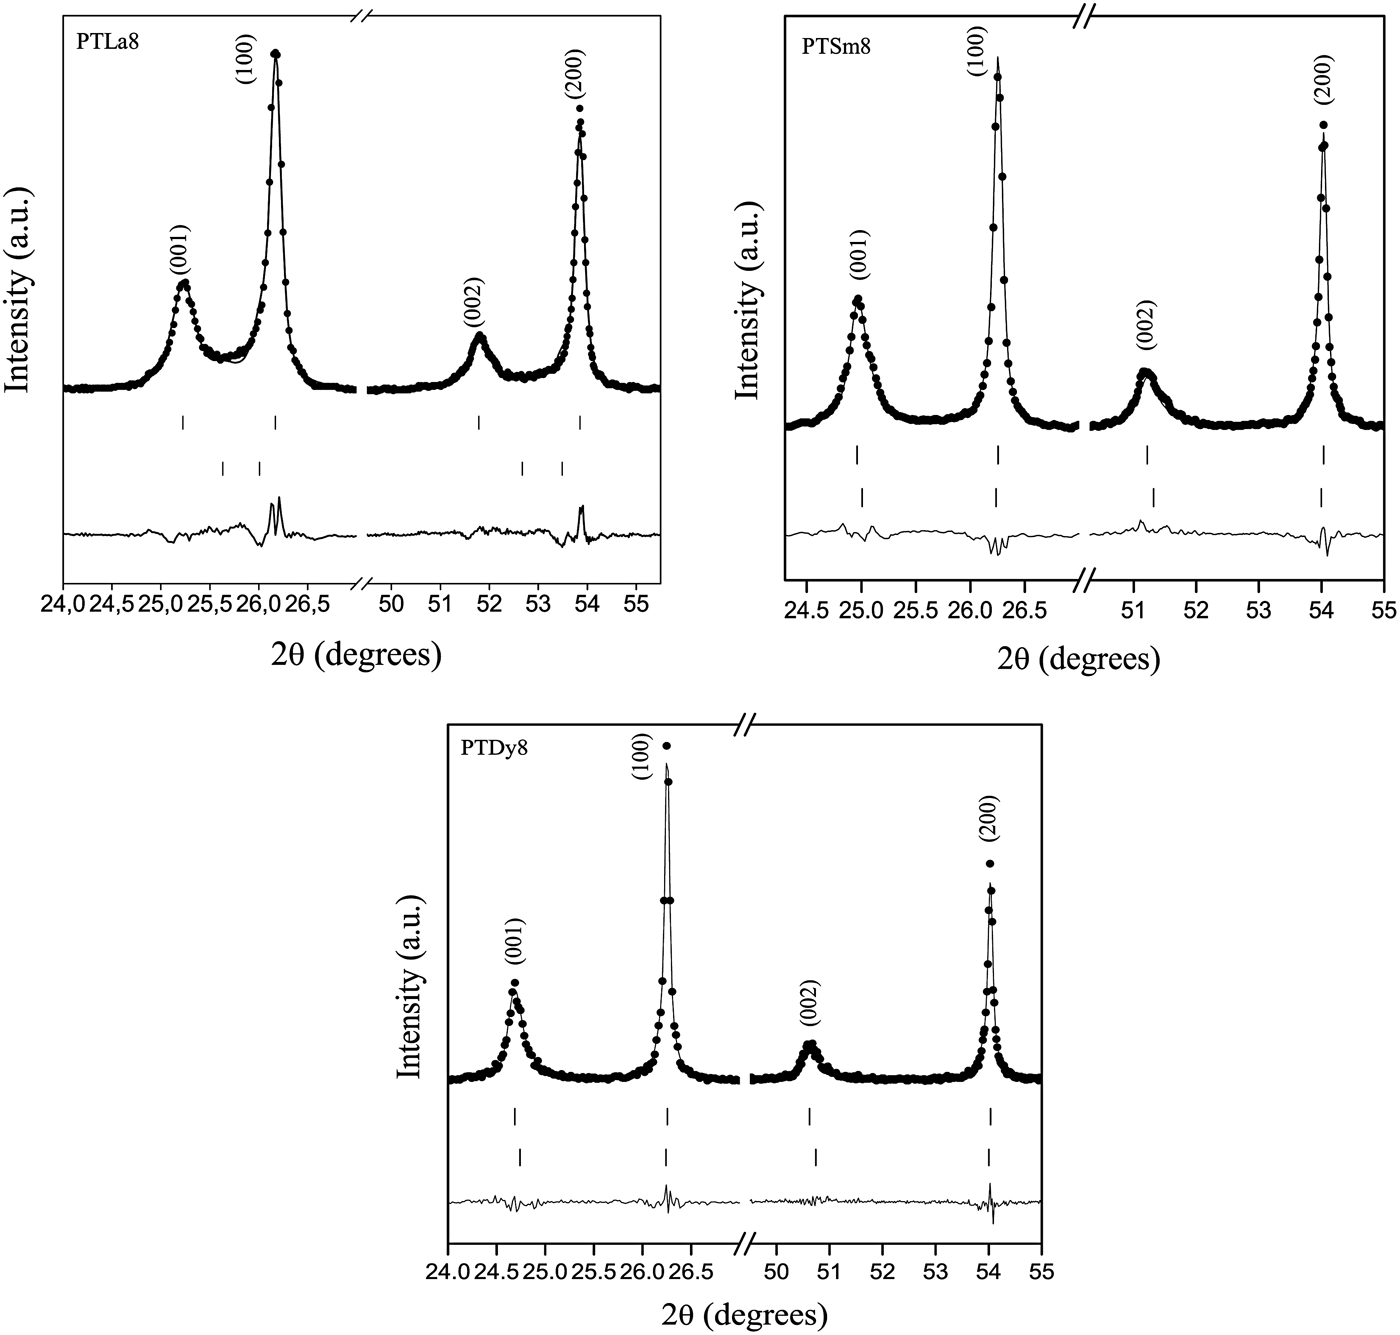
An important feature of the observed diffraction profiles, e.g. (00h) and (h00) reflections, is the particular asymmetry that they exhibit. Peaks of the form (00h) show asymmetry on their right side; (h00) peaks show it on their left side. The described asymmetry has been studied and explained by considering the formation of a ferroelectric domains microstructure (Floquet et al., Reference Floquet, Valot, Mesnier, Niepce, Normand, Thorel and Kilaas1997; Boysen, Reference Boysen2005; Daniels et al., Reference Daniels, Jones and Finlayson2006; Heywang et al., Reference Heywang, Lubitz and Wersing2008) and it is a consequence of the X-ray scattering from the distorted interplanar distance values (d) within the 90° domain walls (Boysen, Reference Boysen2005). The asymmetric effect cannot be attributed to instrumental factors because it was not observed for the reflections of the LaB6 standard sample. The reflections which are affected by this type of asymmetry do not provide satisfactory fits if an incorrect model is proposed. In our case, it has been considered a model, which assumes the occurrence of two phases for the same compound but with different unit-cell parameters (Boysen, Reference Boysen2005). One of the phases describes ferroelectric domains, whereas the second one describes domain wall regions, which are the source of the asymmetric effects on the profiles.
The (00h) diffraction peaks exhibit a strong anisotropic broadening, which is related with anisotropic microstrains as a result of the spontaneous polarization acting along the [001] crystallographic direction. This effect is described considering a phenomenological model (Stephens, Reference Stephens1999), which is implemented in the FullProf software (Rodríguez-Carvajal, Reference Rodríguez-Carvajal1990) as well. Both, the two phases’ model and the phenomenological model, have been used previously for the crystal structure refinement of the Eu3+ doping PT system (Mendez-González et al., Reference Mendez-González, Pentón-Madrigal, Peláiz-Barranco, Figueroa, de Oliveira and Concepción-Rosabal2014).
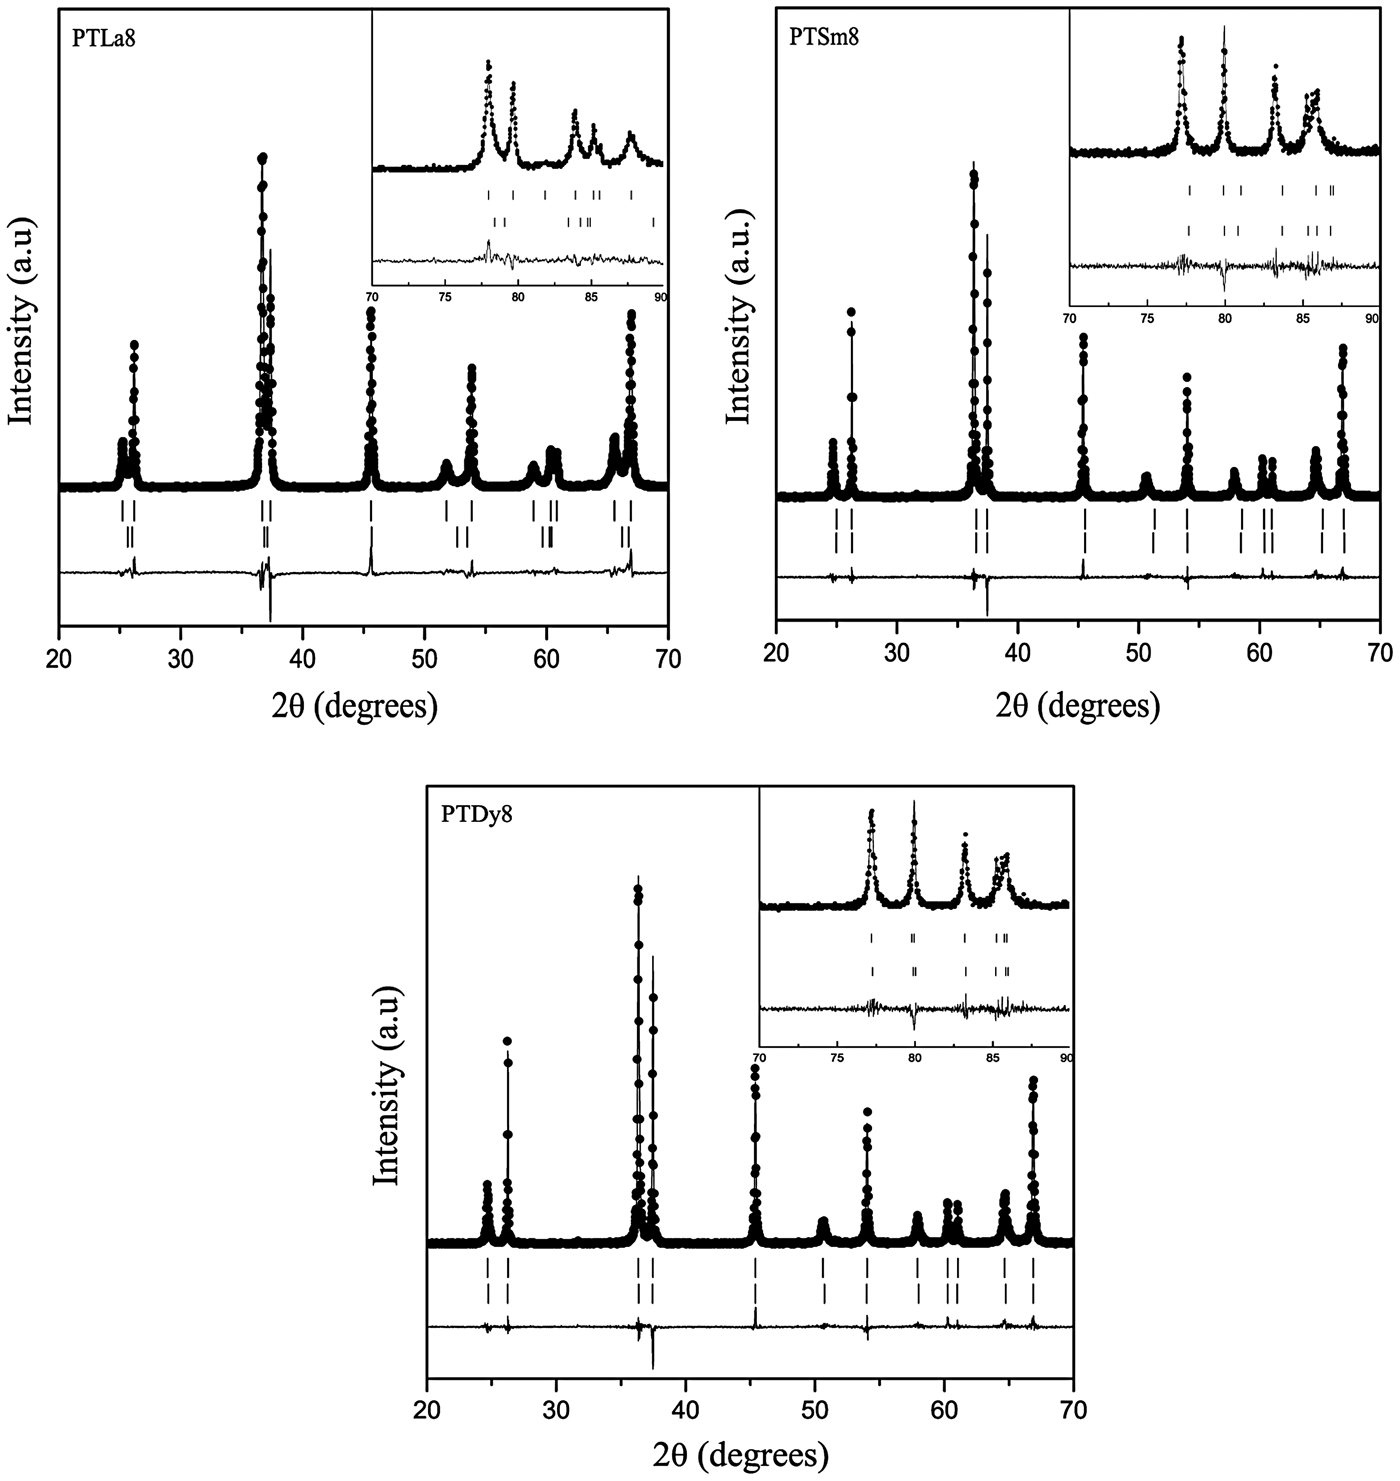
Figure 3 shows the Rietveld refinement of the X-ray powder diffraction patterns for the PTLa8, PTSm8, and PTDy8 samples taking into account the above considerations. The experimental data are represented with dots, and the corresponding calculated profiles with a continuous line. The vertical marks below the patterns correspond to the calculated Bragg reflections for both phases. The difference between the experimental and calculated patterns is also plotted at the bottom of the graphs.
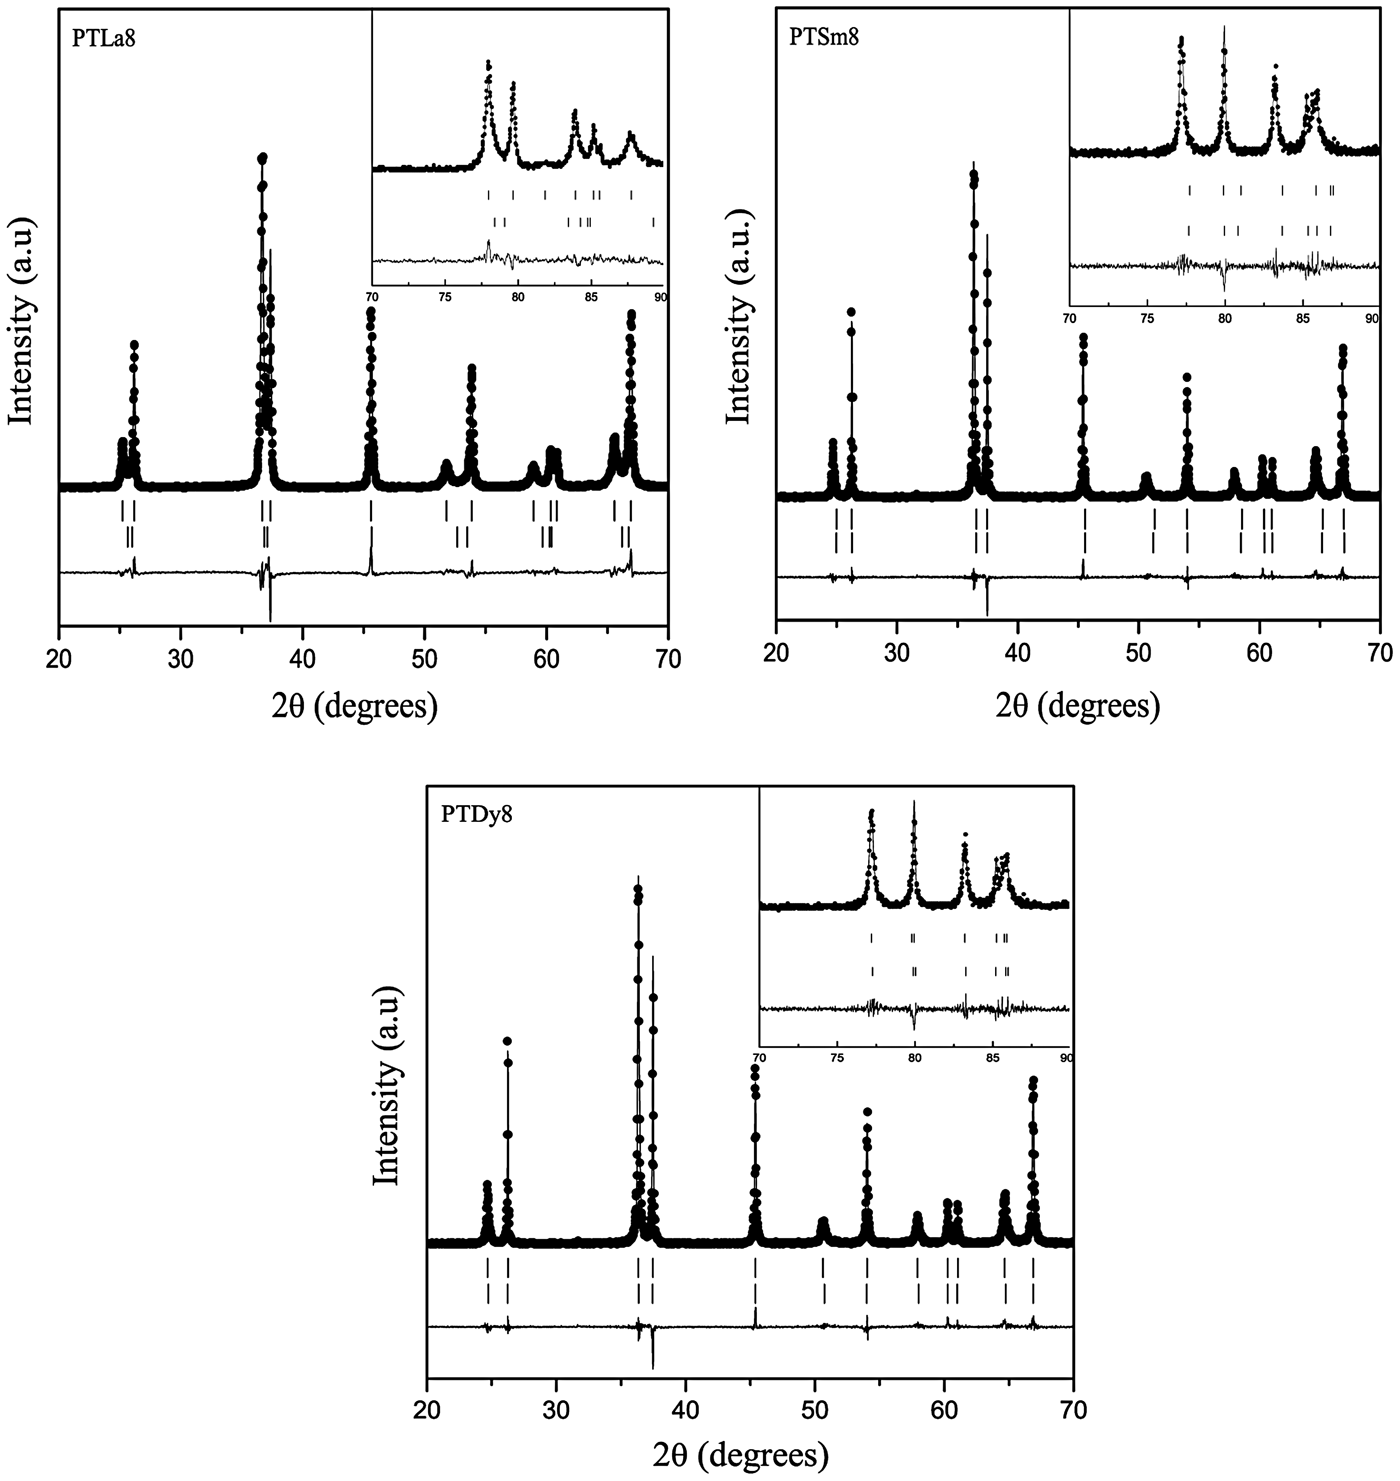
Figure 3. Rietveld refinement plots for the PTLn8 ceramics. The experimental patterns (dots), the calculated profiles (continuous line), and the difference between them (below de patterns) are shown. The calculated Bragg positions, for both phases, are also shown (vertical lines).
To illustrate how the effects of the asymmetry and the anisotropy on the diffraction profiles have been managed using the proposed models, peaks of the forms (h00) and (00h) have been represented in Figure 4. It can be seen a good agreement between the calculated and experimental patterns, supporting that the used models are consistent with the proposed physical origin of the asymmetry and the anisotropic broadening.

Figure 4. Rietveld refinement plots for (h00) and (00h) peaks of PTLn8 samples taking into account the models for the anisotropic and the asymmetric effects on diffraction profiles.
Table II shows the new nominal compositions and the goodness-of-fit parameters [R p (%) and R wp (%)] for both phases. Compositions were calculated considering the refined occupations factors for each atom (Table A1), except for oxygen, while thermal displacement parameters were not refined. The final oxygen compositions were calculated indirectly taking into account the refined occupation factors for the lanthanide ions at the B site using the equation: Pb1−3x′/2Ln x′Ti1−y Ln y O3−y/2, where x′ + y = 0.08.
Table II. Nominal compositions and goodness-of-fit parameters for PTLn8 ceramics.

a Result taken from Mendez-González et al. (Reference Mendez-González, Pentón-Madrigal, Peláiz-Barranco, Figueroa, de Oliveira and Concepción-Rosabal2014).
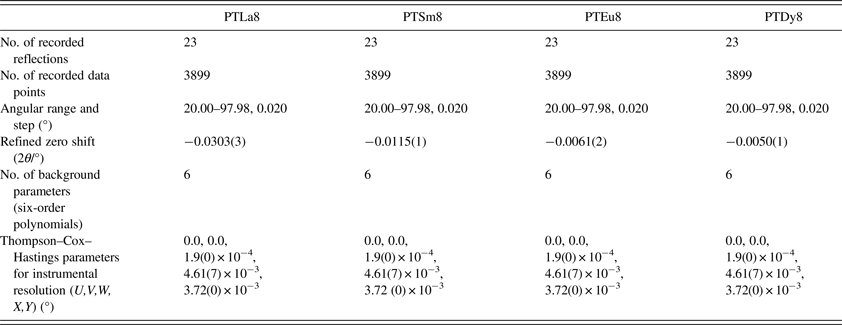
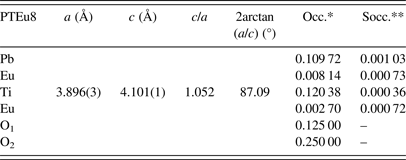
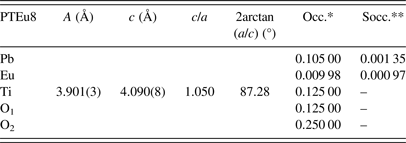
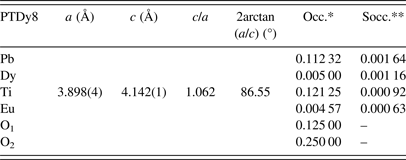
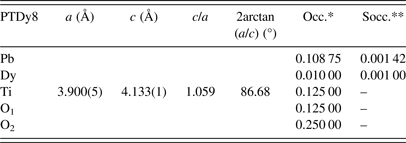
The uncertainty estimation on the refined parameters has been managed taking into account the possible contributions of systematic errors while measuring the external standard sample (Table A2). The most common contributions, which are associated with this type of error in the measured data, have been evaluated. Random errors are usually the most difficult to estimate. We have tried to minimize those ensuring good statistical experimental data, which in our case is guaranteed with the use of synchrotron radiation and measuring all samples under the same experimental conditions (Table A2). As a result, it has been assumed that the occupation factors of the lanthanides at both A and B sites of the perovskite structure are reliable if the corresponding values of the standard deviations do not exceed an equivalent value to 1 at% of the refined occupation factor parameter, in particular for the rare-earth elements (Table A1).
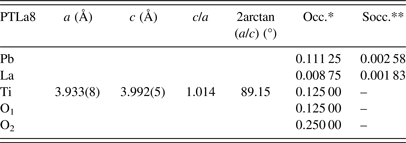
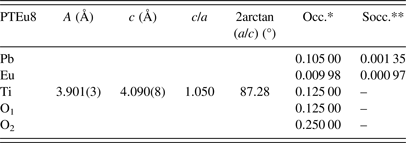
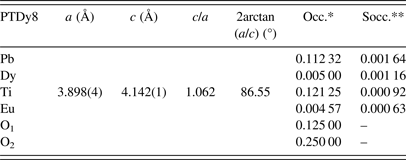
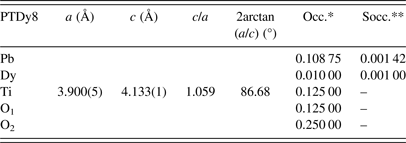
The quantitative analysis shows that Eu3+and Dy3+ ions can be incorporated at both A and B sites of the PT perovskite structure, particularly for the phase 1 of the model. For the phase 2, their B-site occupation is within the error limits of the refinement (1 at%), so it is assumed to be zero. Additionally, the contribution of the phase 2 to the integral intensity of the diffraction peaks is low, so any information should be extracted carefully. In the PTLa8 and PTSm8 samples, for phase 1, La3+and Sm3+ ions preferably substitute at the A site. A model considering the possible incorporation of both La3+ and Sm3+ ions at both sites of the perovskite structure has shown unrealistic values for the fractional occupancies.
The results have suggested a higher incorporation of Ln3+ ions at the A site concerning the B site of the ABO3 structure. Moreover, the B-site occupation increases with the decreasing of the Ln3+ ions size. The final results for the occupation factors refinement are in correspondence with the chemical stoichiometry, which has been obtained using SEM (Table I). A slightly increase of the occupation factor of the rare earths at B sites should favor an increase of the Pb2+ content at A sites as shown in Table I for the PTDy8 case.
The occupancy of the lanthanides at B sites does not exceed the tolerance factors, which were previously calculated for these samples (Mendez-González et al., Reference Mendez-González, Peláiz-Barranco, Calderón-Piñar and Castellanos-Guzmán2010; Peláiz-Barranco et al., Reference Peláiz-Barranco, Mendez-González, Arnold, Saint-Grégoire and Keeble2012). The XRD refinements have shown the existence of both lead and oxygen vacancies, which are formed in the perovskite structure to keep the charge neutrality because of the replacement of Pb2+ and Ti4+ by Ln3+ ions.
The R p(%) and R wp(%) values, in some cases, are distant of 10%. However, the refined structural parameters, e.g. fractional occupancies, can be considered a good approximation taking into account the previous theoretical and experimental studies which have been used to implement the initial structural models for each composition. In absence of a better model, which can describe more appropriately the effects of the ferroelectric domain microstructure on the diffraction profiles, it could be concluded that the present model is appropriated to obtain reliable results, once the quality of the experimental data is guaranteed.
The recovering of the [(c/a) − 1] value of the undoped PT when the Ln3+ ionic radii decreases (Figure 2, Table A1), can be related to the probability of a fraction of Ln3+ ions incorporating at the B site of the perovskite structure. The possibility of having a different structure within the domain walls as result of smaller c/a ratios compared with the corresponding ones of ferroelectric domains (Table A1), in particular for larger ionic radii, was excluded. Attempts to include a second cubic or orthorhombic phase in the model yielded no satisfactory results.
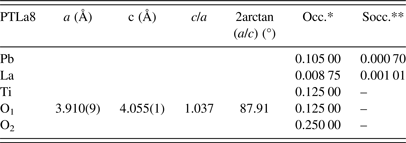
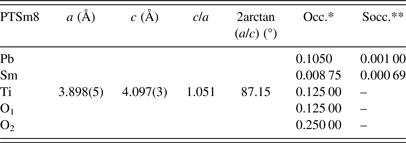
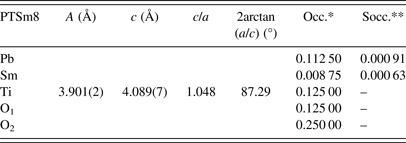
The behavior of [2arctan(a/c)], which is the angle between the polarization directions in adjacent 90° domains (Floquet et al., Reference Floquet, Valot, Mesnier, Niepce, Normand, Thorel and Kilaas1997; Heywang et al., Reference Heywang, Lubitz and Wersing2008), has been also reported in A1. This parameter decreases with the increase of the tetragonal distortion, approaching the angle of fully relaxed bulk PT. For the pure PT sample an angle of 86.4° was obtained, which is in correspondence with previously reported values (Catalan et al., Reference Catalan, Lubk, Vlooswijk, Snoeck, Magen, Janssens, Rispens, Rijnders, Blank and Noheda2011). Adjacent domains between their polarization directions angles near to 90° could favor a higher mismatch between the crystal lattices of each domain, due to disruption of the lattice periodicity, whereby the stress field in the domain wall and in areas near the domain wall should also increase. This could favor the asymmetry that has been observed in the diffraction profiles. While for the PTLa8 sample a high asymmetry is observed, it decreases for smaller Ln3+ ions (Figure 4).
The disruption of the lattice periodicity within the domain wall, in particular 90° domain walls, has been also related to the concept of domain pair analysis (Janovec, Reference Janovec1976, Reference Janovec1981). Using the space of the order parameters, the 90° domain walls could be described as a region with a structure, which varies smoothly accommodating the adjacent domains. Changes of the unit-cell parameters in adjacent domains, as a result of the Ln3+ substitution, seem to affect how the regions on both sides of the central plane (off-central layers) of the domain wall (twin) are built in order to reduce the mismatch between adjacent ferroelectric domains. For this analysis, it has been assumed that the contributions to the peak profiles owing to other types of crystal defects in the ferroelectric domain, such as vacancies or dislocations, or even 180° domain walls, are of symmetrical nature.
IV. CONCLUSIONS
The structure of Ln3+-doped lead titanate ceramics has been studied using SEM, Raman experiments, and XRD–Rietveld refinement. The squared frequency of the E (1TO) soft mode has been taken as evidence of the partial occupation of lanthanide ions at both crystallographic sites of the perovskite structure. The results of the XRD–Rietveld refinements are consistent with the A-site incorporation for La3+ and Sm3+ ions and at both A and B sites for smaller ions (Eu3+ and Dy3+). A higher incorporation of these ions at A sites concerning B sites has been obtained for all studied samples. The B-site occupation by rare earths increases with the decreasing of their ionic radii. The model, which has been used for the fit of the diffraction profiles, seems to be a suitable method to describe the asymmetric effects and the anisotropic broadening.
ACKNOWLEDGEMENTS
Dr. A. Pentón-Madrigal thanks the Program CAPES/MES (328/2011) Brazil–Cuba for partial financial support. This work was also supported by the LNLS under the proposal XPD-10026. The LNNano at CNPEM is also acknowledged for SEM experiments under proposal Inspect-14958. The authors thank to the Third World Academy of Sciences (RG/PHYS/LA Nos. 99-050, 02-225, and 05-043) and to the ICTP, Trieste-Italy, for financial support of Latin–American Network of Ferroelectric Materials (NET-43).
Appendix
A1
Refined parameters: Unit-cell parameters, c/a ratio, 2arctan(a/c), and occupation factors, with their corresponding standard deviation values, for the studied samples within the framework of the two phases’ model (*Occupations factors; **The standard deviation value: 0.00125, is equivalent to 1 at% of the refined occupation factor parameter).
Phase 1: (Pb0.84La0.07)TiO3 (ferroelectric domain)
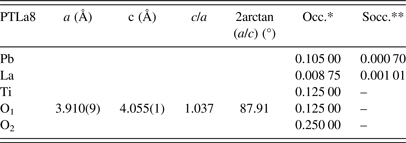
Phase 2: (Pb0.89La0.07)TiO3 (domain wall)
Phase 1: (Pb0.84Sm0.07)TiO3 (ferroelectric domain)
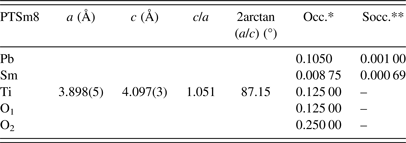
Phase 2: (Pb0.90Sm0.07)TiO3 (domain wall)
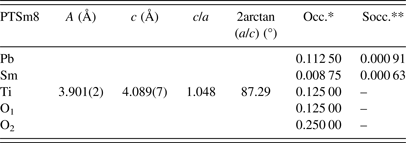
Phase 1: (Pb0.87Eu0.06)(Ti0.96Eu0.02)(O2.98) (ferroelectric domain)
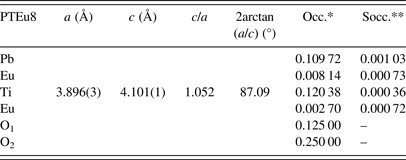
Phase 2: (Pb0.84Eu0.08)TiO3 (domain wall)
Phase 1: (Pb0.90Dy0.04)(Ti0.97Dy0.03)(O2.98) (ferroelectric domain)
Phase 2: (Pb0.87Dy0.08)TiO3 (domain wall)
A2
-
(a) Details of the XRD data and several refined parameters, which are common for the two phases of the model.

-
(b) Details of several refined parameters for both phases of the model.


