I. INTRODUCTION
The continuing demands for environmentally friendly alternative energy technologies have led to greatly increased research into energy sustainability. In recent years production of clean-burning hydrogen fuel has gained intensified attention as oil and other nonrenewable fuels become increasingly depleted and expensive. Methods such as photocatalytic water splitting are being investigated to produce hydrogen. Photocatalysis is a type of catalysis that results in the modification of the rate of a photoreaction (a chemical reaction that involves the absorption of light by one or more reacting species such as semiconductors) by adding catalysts that participate in the chemical reaction without being consumed.
Despite considerable global efforts, commercialization of photocatalysis technology, as compared to the photovoltaic technology (Paranthaman et al., Reference Paranthaman, Wong-Ng and Bhattacharya2015), has encountered setbacks due to the difficulties of obtaining efficient materials. Much current research is focusd on material improvements of semiconductors that have narrow bandgaps of about 2.5 eV, which is one of the requirements for effective photocatalysis materials in the visible light regime (Abe, Reference Abe2010; Maeda, Reference Maeda2011; Osterloh, Reference Osterloh2013; Khan et al., Reference Khan, Adil and Al-Mayouf2015; Martsinovich, Reference Martsinovich2016; King et al., Reference King, Boltersdorf, Maggard and Wong-Ng2017). Oxide materials including silicates exhibit potentials to be photocatalysis materials. In this paper, we focus our efforts on a silicate series of compounds, which is tridymite (SiO2)-related.
Alkaline earth silicates have been known to possess stable crystal structure, high physical and chemical stability and to function as effective luminescent hosts (Barry, Reference Barry1968; Jüstel et al., Reference Jüstel, Nikol and Ronda1998; Yao et. al., Reference Yao, Xue and Yan2011; Streit et al., Reference Streit, Kramer, Suta and Wickleder2013; Lin et al., Reference Lin, Niu, Han, Li, Zhou, Zhang, Yu and Lian2017 and Nagai et al., Reference Nagai, Asai, Okazaki, Terasaki and Taniguchi2015). Tridymite is a high-temperature polymorph of silica that usually occurs as white or colorless pseudo-hexagonal crystals. By partially replacing Si4+ ions with other tetrahedrally coordinated ions of lower valence ions such as Zn2+and Co2+, and by substituting the large ions, such as Ba+2 into the tetrahedral framework, the resulting compounds BaMSiO4 (M = Co and/or Zn) would maintain charge balance. Therefore, BaMSiO4 belong to a large structural family of stuffed tridymite derivatives (Taniguschi et al., Reference Taniguschi, Moriwake, Kuwabara, Okamura, Yamamoto, Okazaki, Itoh and Terasaki2014). BaCoSiO4 has been reported to have a theoretically narrow band gap of about 2 eV (Taniguschi et al., Reference Taniguschi, Moriwake, Kuwabara, Okamura, Yamamoto, Okazaki, Itoh and Terasaki2014).
There are three goals in this paper. Firstly, the structure of Ba(Co1−xZnx)SiO4 (x = 0.2, 0.4, 0.6, 0.8) compounds are investigated for the effect of Zn substitution on the Co site. The second goal is to obtain band gap values of these materials by measuring their UV-visible absorption spectra. Lastly, since X-ray diffraction is a non-destructive technique, X-ray diffraction patterns are especially important for phase characterization, therefore the third goal of this investigation was to determine experimental powder reference X-ray patterns (McMurdie et al., Reference McMurdie, Morris, Evans, Paretzkin and Wong-Ng1986a and Reference McMurdie, Morris, Evans, Paretzkin, Wong-Ng, Ettlinger and Hubbard1986b) for the Ba(Co1−xZnx)SiO4 series and to make them available through submission to the Powder Diffraction File (PDF, 2018).
II. EXPERIMENTAL
A. Sample preparation
The starting stoichiometric chemicals BaCO3, Co3O4, ZnO and SiO2 were weighed, mixed and pelletized to form Ba(Co1−xZnx)SiO4 (x = 0.2, 0.4, 0.6, 0.8). The pellets were heat-treated in a furnace at 850 °C for 24 h, 900 °C for 40 h, 1000 °C for 52 h, 1100 °C for 60 h and at 1200 °C for another 60 h. Between each heat treatment, the samples were furnace cooled, ground and re-pelletized. The heat treatment process was repeated until no further changes were detected in the powder X-ray diffraction patterns.
B. Estimation of composition using X-ray fluorescence
The estimation of composition for sample Ba(Zn0.4Co0.6)SiO4 was performed on a Bruker M4 Tornado micro X-ray fluorescence instrument. A Rh X-ray source, set to 50 kV and 300 uA, with a 20 um mono-capillary were used for excitation (S.N. 2001495). A Bruker XFlash 450 um thick, Silicon Drift Detector (S.N. 11881_0239) was used for data collection for two scans, with a live time of 300s per scan. Each spectrum used a minimum peak sum of over 100 k X-ray counts per analyzed element, eliminating counting statistics as a source of uncertainty. Analysis were performed using Bruker Quantify version 1.3.1.3327 with standard Spectrum Elements method and calibrated for our instrument (S.N. 6099).
C. X-ray rietveld refinements and reference powder X-ray diffraction patterns
Powder X-ray diffraction was used to investigate phase purity and establish phase relationships. These experiments were carried out using a Phillips X-ray powder diffractometer with Cu Kα radiation and equipped with a series of soller slits and a scintillation counter. (The purpose of identifying the equipment in this article is to specify the experimental procedure. Such identification does not imply recommendation or endorsement by the National Institute of Standards and Technology.) The 2θ scanning range was from 10° to 79°, with step intervals of 0.03°. The reference diffraction pattern of the BaCoSiO4 phase (International Centre for Diffraction Data/Powder Diffraction file (PDF4+, 2019)) was used for performing phase identification.
For structure analysis, the Ba(Co1−xZnx)SiO4 (x = 0.2, 0.4, 0.6, and 0.8) compounds were packed into 0.3 mm glass capillaries. The powder patterns were measured on a PANalytical Empyrean diffractometer equipped with an incident-beam focusing mirror and an X'Celerator detector. The patterns (1–100° 2θ, 0.0167113° steps, 4 s/step, 1/4° divergence slit, 0.02 radian Soller slits) were measured using Mo Kα radiation. The Rietveld refinement technique (Rietveld, Reference Rietveld1969) with software suite GSAS (Larson and von Dreele, Reference Larson and von Dreele2004) was used to determine the structure of Ba(Co1−xZnx)SiO4 (x = 0.2, 0.4, 0.6, and 0.8) using BaCoSiO4 (PDF4+, 4-22-3559) as an initial model for refinement. Using X-ray fluorescence method, we have performed composition determination on one sample, namely, Ba(Zn0.4Co0.6)SiO4. The ratio of Zn/Co was indeed determined to be 4/6 (discussed later). The result indicated that neither species has significantly vaporized, and no impurity phases were expected nor observed, and thus the synthesized chemistry is expected to be close to the intended chemistry. Therefore, in the refinement models of all four samples, the site occupancy factors were fixed to be exactly as synthesized.
Reference powder X-ray diffraction patterns were obtained with a Rietveld pattern decomposition technique. Using this technique, the reported peaks were derived from the extracted integrated intensities, and positions calculated from the lattice parameters. When peaks are not resolved at the resolution function, the intensities are summed, and an intensity-weighted d-spacing is reported.
D. Band gap measurements
The optical properties of the synthesized Ba(Co1−xZnx)SiO4 (x = 0, 0.2, 0.8, and 1.0) compounds were investigated by measuring the UV-visible absorption spectra. The synthesized pellets were ground and suspended in deionized-water for UV-visible measurements. The UV-visible optical absorption spectra of the suspensions were measured for one minute using a DU 640 spectrophotometer with wavelength range of 200 to 1100 nm.
E. Bond Valence Sum (BVS) calculations
Bond valence sum (BVS) values for the Ba, Co, Zn, and Si sites were calculated using the Brown-Altermatt empirical expression (Brown and Altermatt, Reference Brown and Altermatt1985; and Brese and O'Keeffe, Reference Brese and O'Keeffe1991). The BVS of an atom i is defined as the sum of the bond valences v ij of all the bonds from atoms i to atoms j. The most commonly adopted empirical expression for the bond valence v ij as a function of the interatomic distance d ij is v ij = exp[(R 0 – d ij)/B]. The parameter, B, is commonly taken to be a “universal” constant equal to 0.37 Å. The values used for the reference distance R 0 for Ba2+-O, Zn2+-O, Co2+-O, Si4+-O are 2.29, 1.920, 1.911, 1.624 Å, respectively (Brown and Altermatt, Reference Brown and Altermatt1985; and Brese and O'Keeffe, Reference Brese and O'Keeffe1991). When more than one atom types occupy the same site, the resulting BVS is the weighted sum of each site occupancy.
III. RESULTS AND DISCUSSION
A. Structure characterization
The Rietveld refinement results including the refinement R values and goodness of fit for each sample of the Ba(Co1−xZnx)SiO4 (x = 0.2, 0.4, 0.6, and 0.8) series are given in Table I. Figure 1 illustrates the observed (crosses), calculated (solid line), and difference XRD patterns (bottom) for Ba(Co1−xZnx)SiO4. The difference pattern is plotted at the same scale as the other patterns. Above 50° 2θ, the vertical scale has been magnified five times. The row of tick marks indicates the calculated peak positions.
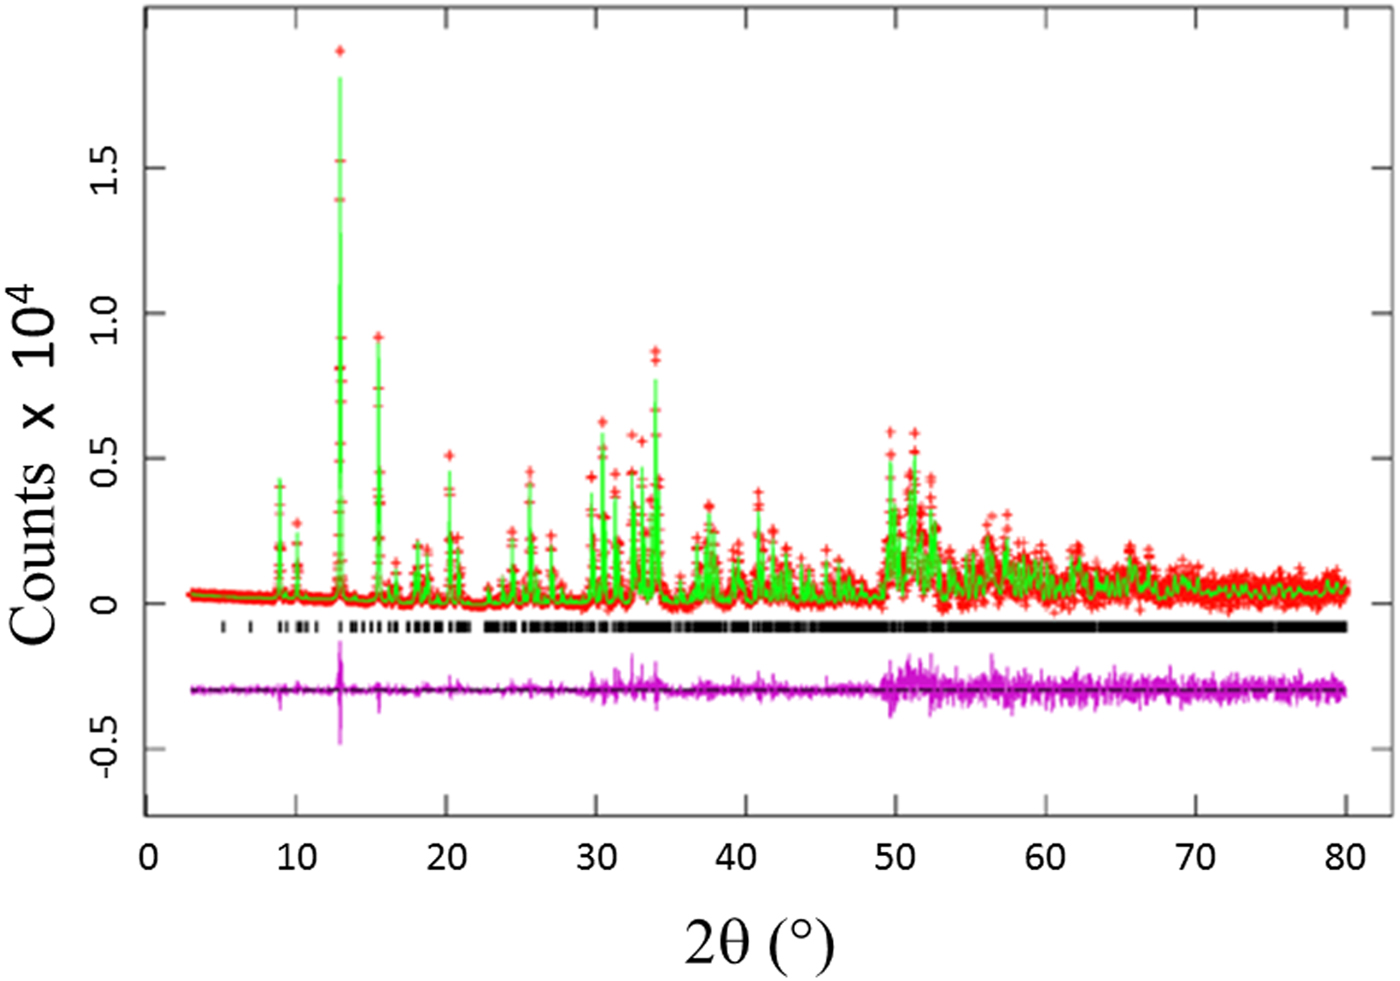
Figure 1. (Colour online) Observed (crosses), calculated (solid line), and difference XRD pattern (bottom) for Ba(Co0.6Zn0.4)SiO4 by Rietveld analysis technique. The difference pattern is plotted at the same scale as the other calculated peak positions up to 50° 2θ. At higher angles, the scale has been magnified five times.
Table I. Rietveld refinement residuals for Ba(Co1−xZnx)SiO4 (P6 3 (No. 173), Z = 6).
Table II lists the lattice parameters for Ba(Co1−xZnx)SiO4 (x = 0, 0.2, 0.4, 0.6, and 0.8). This series of compounds, having the hexagonal space group of P6 3, are isostructural. Lattice parameters of Liu and Barbier (Reference Liu and Barbier1993) were used for comparison (Table II). As the Shannon ionic radii for Co2+ (C.N. of 4) and Zn2+ are close to each other (0.58 vs. 0.6 Å) (Shannon, Reference Shannon1976), one does not expect the unit cell volumes of the Ba(Co1−xZnx)SiO4 members to differ significantly from each other. In Figure 2, it is interesting to see the length of the a axis decreases from Ba(Co0.8Zn0.2)SiO4 to Ba(Co0.2Zn0.8)SiO4 (from 9.126 (2) to 9.10374(6) Å), respectively, but the c-axis increases from Ba(Co0.8Zn0.2)SiO4 to Ba(Co0.2Zn0.8)SiO4 (from 8.69477(12) Å to 8.72200(10) Å), resulting in rather similar unit cell volume in the series (unit cell volume varies between 626.3 Å3 and 626.0 Å3). There is also a trend of increasing density as the x value increases.
Table II. Cell parameters for Ba(Co1−xZnx)SiO4 (x = 0 to 1), space group P6 3 (No. 173), Z = 6, and d cal represents calculated density.

Figure 2. Plot of unit cell parameter, a and c of Ba(Co1−xZnx)SiO4 vs. x. A monotonic increase of a and decrease of c are observed.
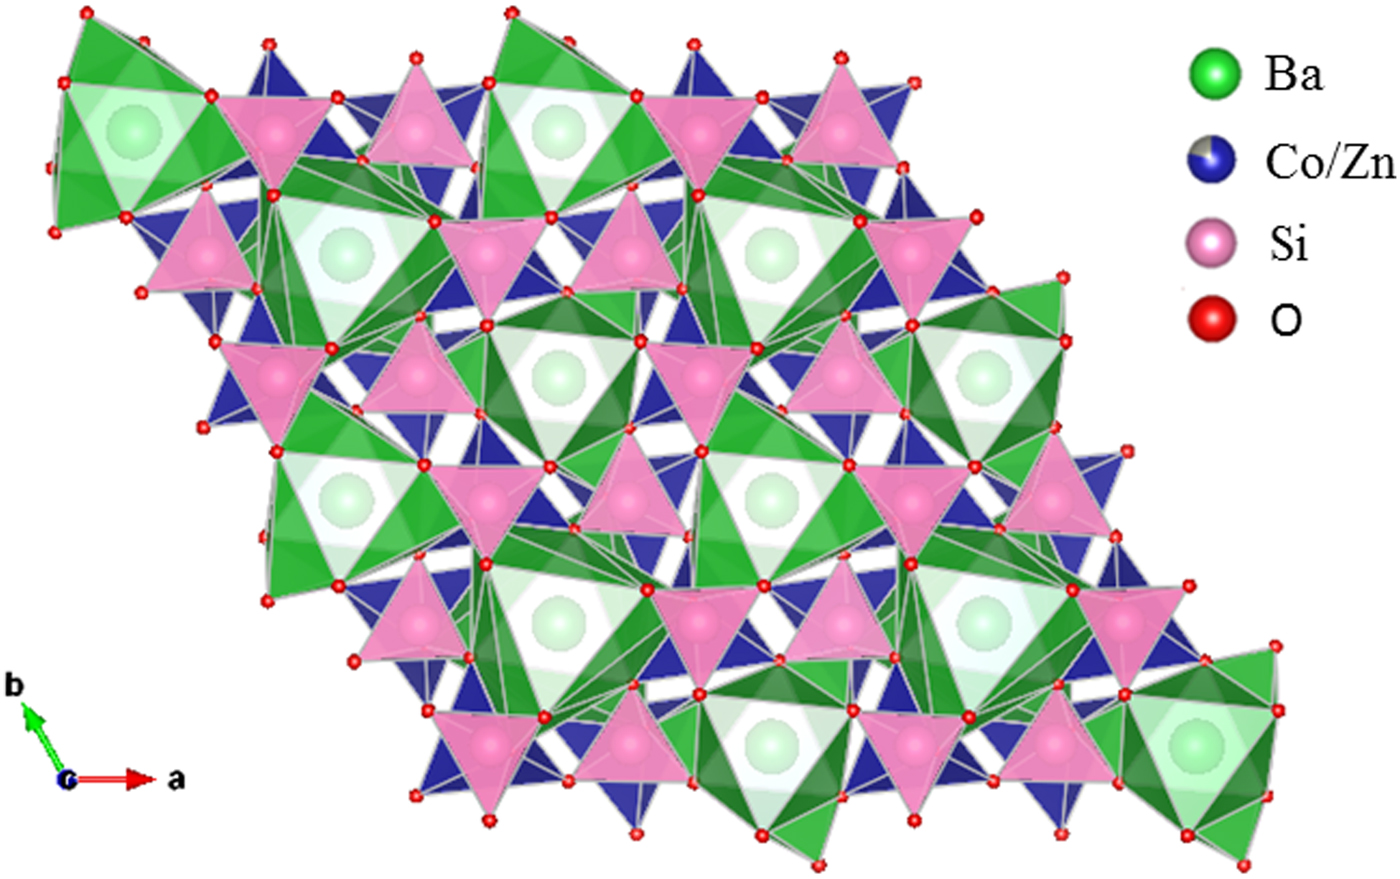
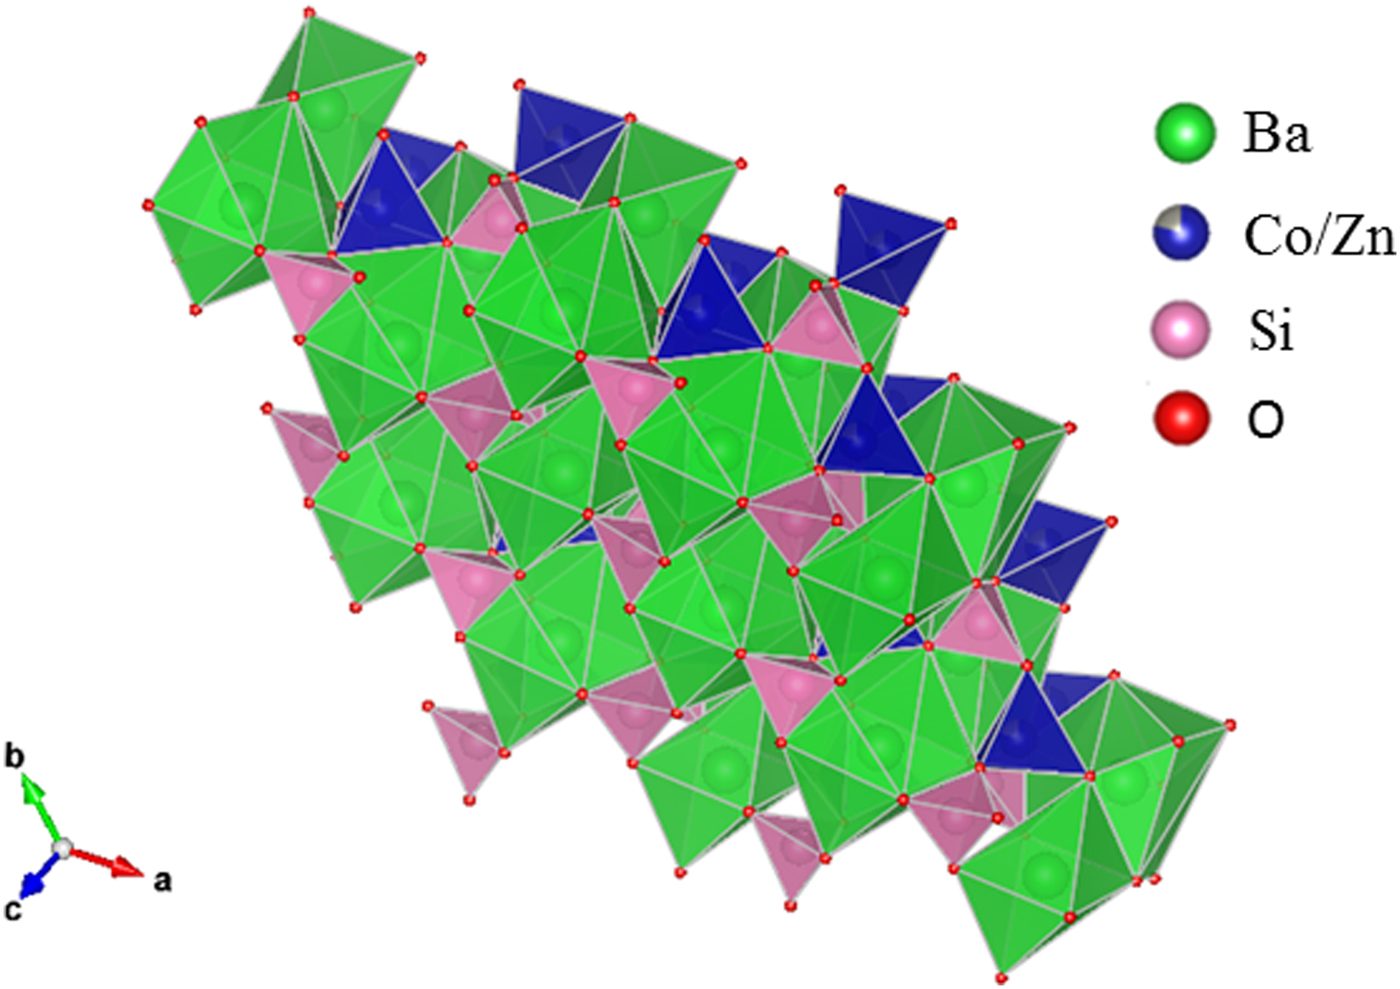
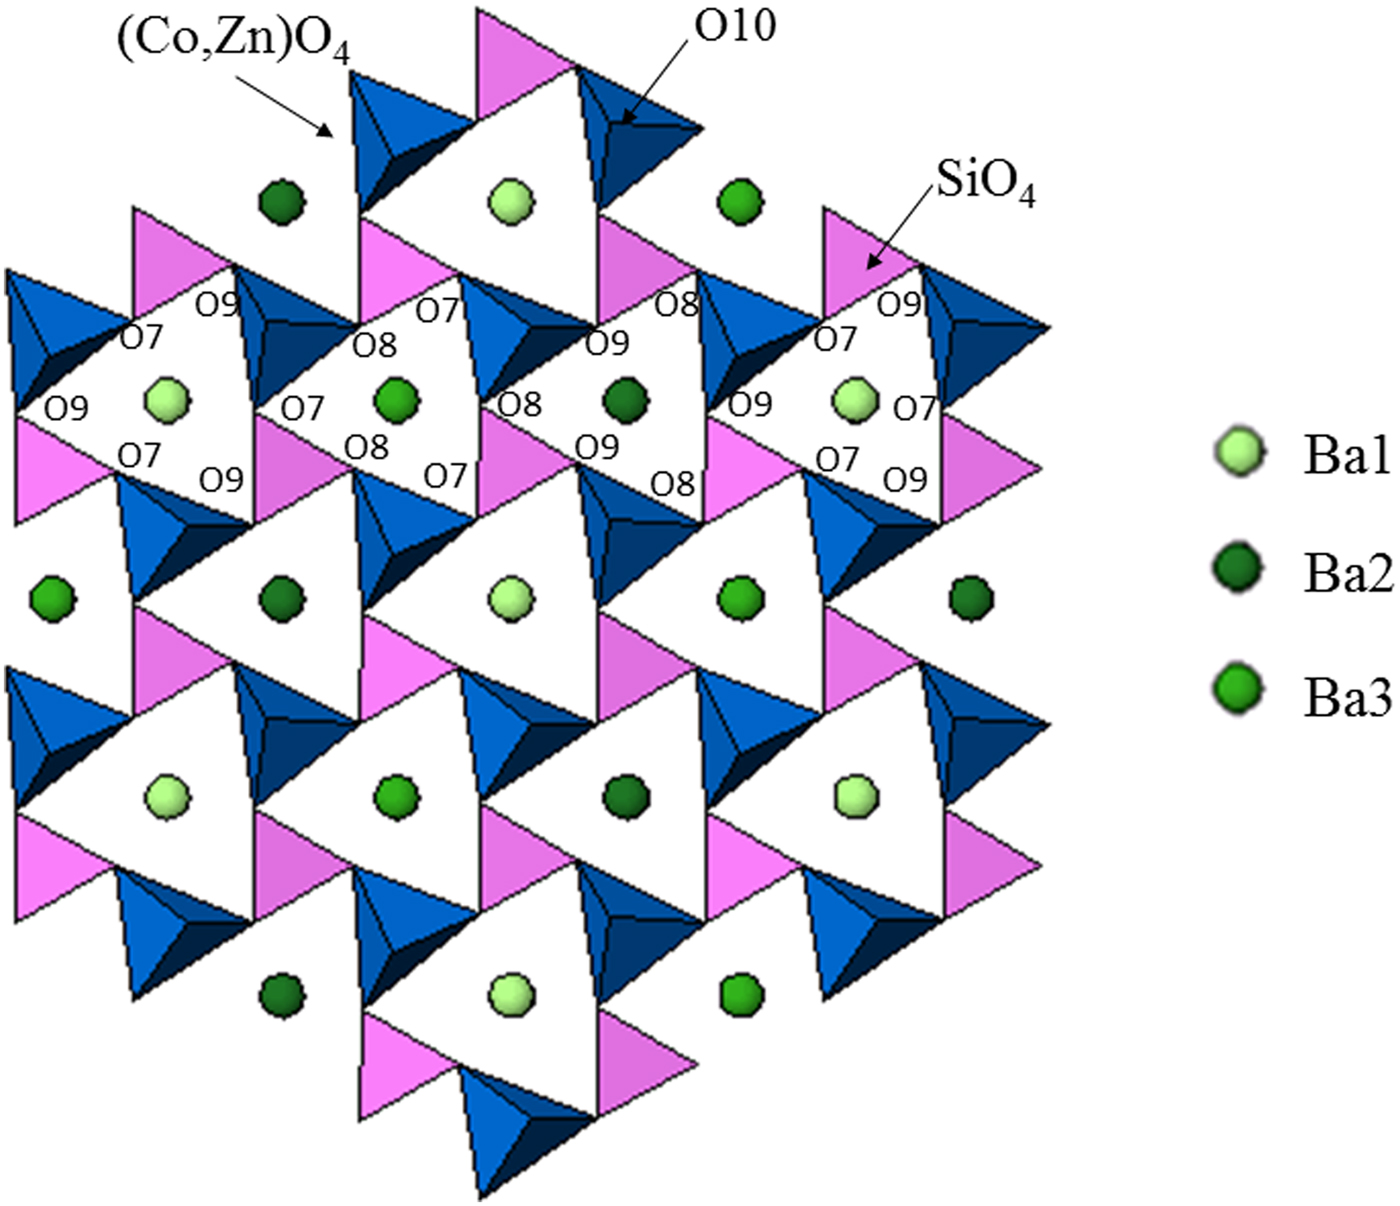
Table III gives the coordinates of the atomic sites of Ba(Co1−xZnx)SiO4. The structure is confirmed to be that of a Ba-stuffed tetrahedral tridymite framework. The structure consists of alternating 6-membered rings of corner-shared SiO4 and the relatively larger (Co/Zn)O4 tetrahedra. Six of these tetrahedra enclose six-fold channels along the c-direction. All rings are similar with an almost triangular shape and are stacked along the c-direction, joined via the O10 sites in a staggered manner. The Co/Zn and Si sites are ordered, with the larger (Co/Zn)O4 tetrahedra pointing upward and smaller SiO4 pointing downward. The ordered structure is likely due to the large differences in the formal ionic valences of (Co/Zn)2+ vs. Si4+ and in bond lengths (1.86(3) Å to 2.06(4) Å for (Co/Zn)-O and 1.53(3) Å to 1.67 Å for Si-O). Figures 3 and 4 show corner-shared SiO4 and the larger (Co/Zn)O4 tetrahedra along the ab plane. Figure 5 illustrates the Ba polyhedra. Figure 6 shows the 6-membered rings with Ba atoms in the channels viewed along the c-axis, and it also gives the atomic labeling.
Table III. Atomic coordinates and displacement factors for compounds for Ba(Co1−xZnx)SiO4 P6 3 (No. 173), Z = 6.
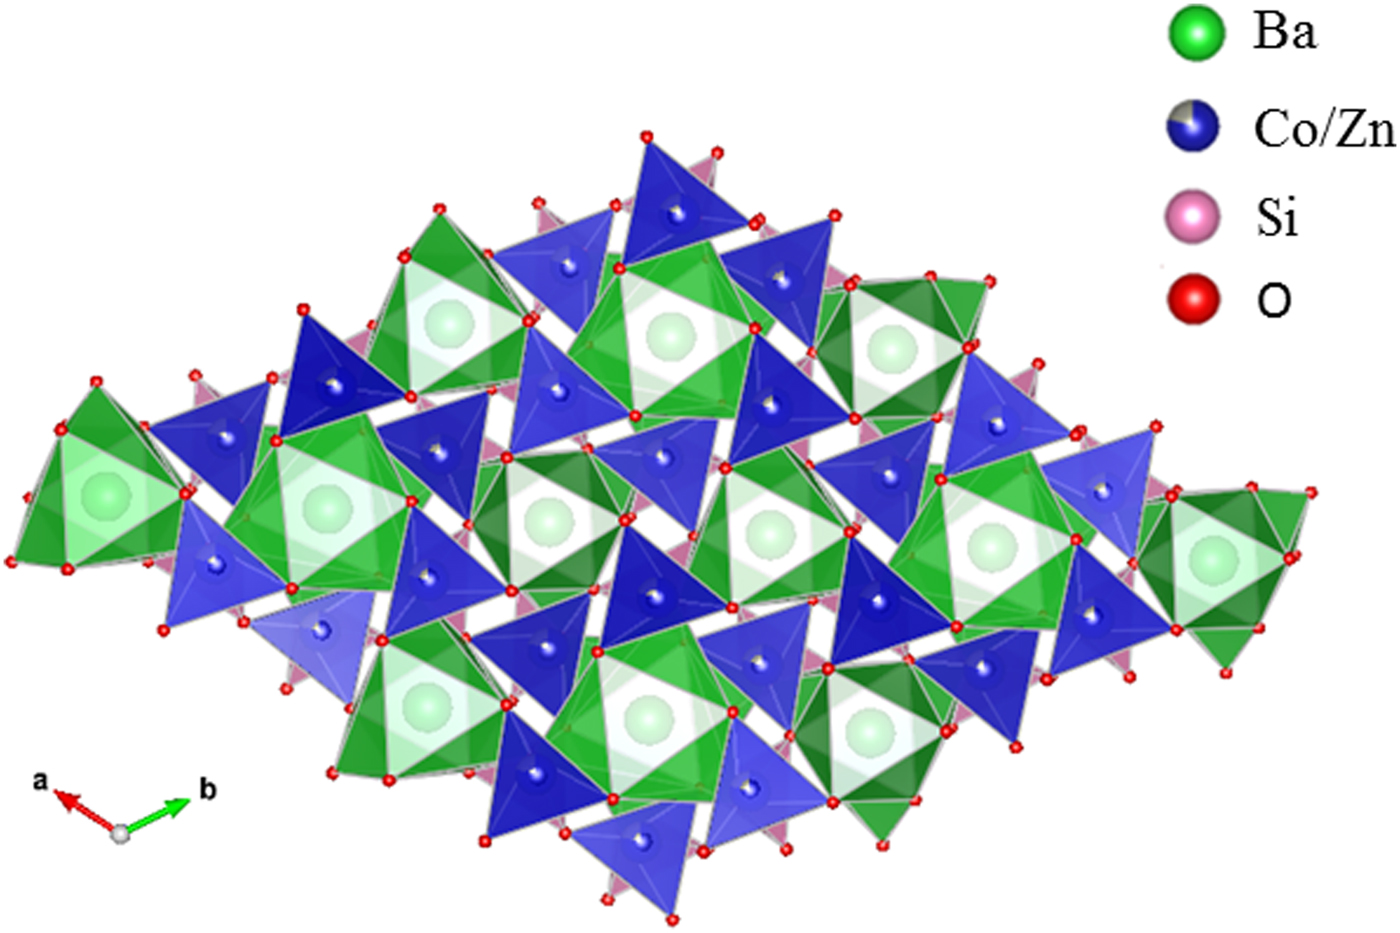
Figure 3. (Colour online) Crystal structure of Ba(Co1−xZnx)SiO4 showing corner-shared Co/ZnO4 tetrahedra along c-axis.

Figure 4. (Colour online) Crystal structure of Ba(Co1−xZnx)SiO4 showing corner-shared SiO4 and the staggering larger Co/ZnO4 tetrahedra along c-axis.

Figure 5. (Colour online) Crystal structure of Ba(Co1−xZnx)SiO4 showing the Ba polyhedra.

Figure 6. (Colour online) Crystal structure of Ba(Co1−xZnx)SiO4 showing the 6-membered rings with Ba atoms in the channels and the atomic labeling.
There are three crystallographically different six-fold channels filled with Ba atoms (Ba1, Ba2, and Ba3). These three Ba sites are all located on threefold axes, however, with different coordination characteristics. As shown in Table IV, while Ba1 and Ba2 sites are both 9-fold coordinated (six short Ba-O7 plus three long Ba-O10 bonds (3.04 Å) for Ba1, three short Ba-O8 and three short Ba-O10 plus three long Ba-O9 bonds (3.01 Å) for Ba2), Ba3 is only 6-fold coordinated (three short Ba-O8 and three short Ba-O9 bonds). The smaller coordination number for Ba3 is because O10 site is displaced significantly from Ba3, giving rise to the Ba3-O separation of >3.5 Å. Because of this large separation, we would expect the displacement factor for Ba3 to be larger as compare to those of Ba1 and Ba2.
Table IV. Bond distances and Bond Valence Sum (BVS) values for Ba(Co1−xZnx)SiO4, P6 3 (No. 173), Z = 6.

The ideal BVS values are 2.0 (Ba site), 2.0 (mixed Co/Zn site), and 4.0 (Si site), respectively. The values for the reference distance R 0 for Ba-O, Zn2+-O, Co2+-O, Si4+-O are 2.29, 1.704, 1.692, 1.624, respectively (Brown and Altermatt, Reference Brown and Altermatt1985; and Brese and O'Keeffe, Reference Brese and O'Keeffe1991).
Judging from the average (Co, Zn)-O distances in these compounds, there is a small decrease from 1.98 to 1.95 Å from x = 0.2 to 0.8, which is the probable cause of the decreasing a-axis cell parameters, whereas the slightly increasing Ba-O distances in the series resulted in the increasing trend of the c-axis. The displacement of the O10 site corresponds to the collapse of the tetrahedral framework around the Ba atoms, involving the tilting of (Co/Zn)O4 and SiO4 tetrahedra around horizontal axes that is approximately parallel to the [110] direction (Liu and Barbier, Reference Liu and Barbier1993). Taking Ba1 as the center in Figure 3 (coordinate 0, 0, z), the degree of framework tilt can be estimated approximately from the difference (Δz) between the z coordinates of the surrounding O7 and O9 sites. The greater the Δz values, the larger the tetrahedral tilt. The Δz value was estimated to be 0.075, 0.070, 0.068, 0.072, 0.069, and 0.064 for x = 0, 0.2, 0.4, 0.6, 0.8 and 1.0 in Ba(Co1−xZnx)SiO4, respectively, indicating a general decrease of tetrahedral tilting. For comparison, Table V gives the values of x, lattice parameter c, Δz, and angle M-O(10)-Si in Ba(Co1−xZnx)SiO4. There is an apparent correlation between the trend of c parameter and the tetrahedral angle distortion (M-O(10)-Si) (deviation from the ideal angle of 109.5 °). That is, the shorter the c axis, the more pronounced the tetrahedral distortion.
Table V. Values of x, c, Δz and angle M-O(10)-Si in Ba(Co1−xZnx)SiO4, where M represents the mixed sites of Co/Zn. Δz represents the difference between the z-coordinate of O7 and O9.
In Table IV, the bond valence sum values around the Ba atoms in all the Ba(Co1−xZnx)SiO4 compounds are lower than the ideal value of 2.0, indicating that the Ba-O bonds are stretched, or the Ba atoms are too small relative to the size of the framework cavities. On the other hand, the SiO4 tetrahedra are under compressive stress as their BVS values are greater than the ideal value of 4.0 (decreasing from 4.66 to 4.25 as the x value increases). The (Co/Zn)O4 tetrahedra show a slight change of stress from tensile to compressive as the Zn concentration increases, parallel to the trend of decreasing average Co/Zn-O bond distances from 1.98 to 1.95 Å.
From X-ray fluorescence measurements, the atomic concentrations for Ba, Zn, Co and Si were found to be 1.00 (Normalized), 0.42 ± 0.04, 0.63 ± 0.04, and 0.76 ± 0.07, respectively. These results confirm the ratio of the concentration of Zn/Co to be of 4/6, agreeing with the chemical formula of Ba(Zn0.4Co0.6)SiO4 that we synthesized. These uncertainty estimates from our X-ray fluorescence measurements only represent the statistical, type A expanded values. This instrument will have type B expanded uncertainties of 10 to 20%, without known standards used in the quantitative measurement algorithm (No standards were used for this measurement). Si composition suffers interference with source and detector window attenuation, due to the low energy nature of its fluorescence line, which increases atomic concentration uncertainties by 20 to 30%. This could explain Si deviations from expected atomic percentages.
B. Optical properties of Ba(Co1−xZnx)SiO4
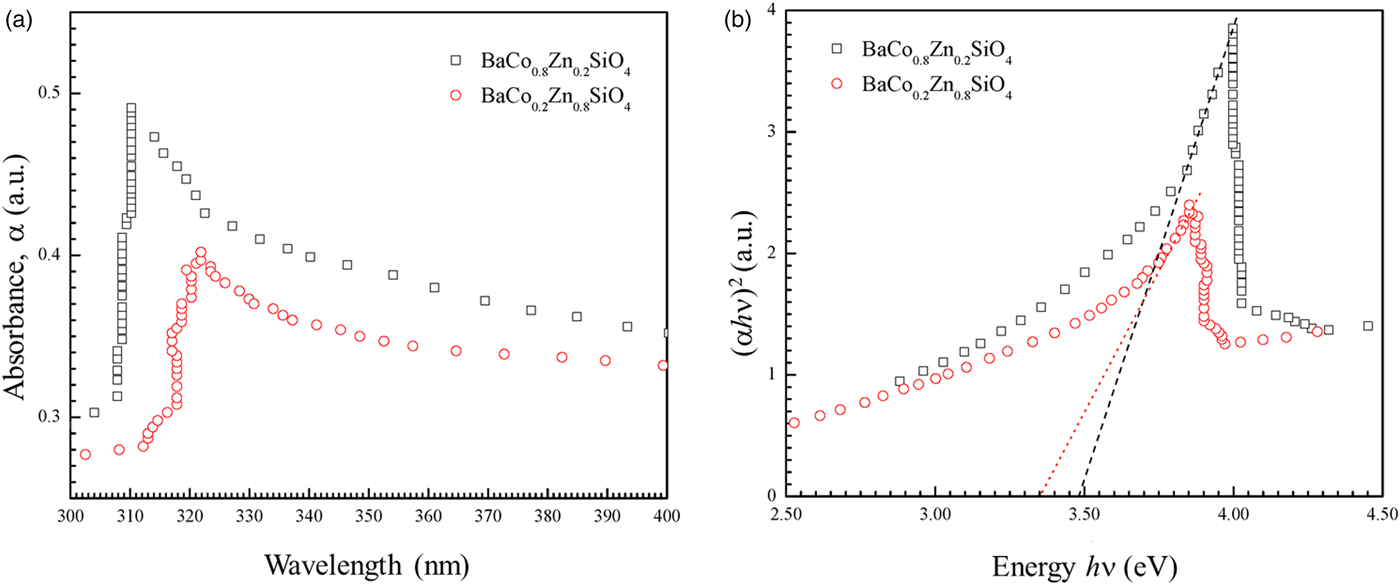
Figure 7 shows the UV-visible absorption spectra of two as-synthesized Ba(Co1−xZnx)SiO4 (x = 0.2 and 0.8) compounds. There is a strong absorption peak around 310 nm for BaCo0.8Zn0.2SiO4 and 320 nm for BaCo0.2Zn0.8SiO4. The absorption edge red-shifts with the changes of Zn content x.

Figure 7. (Colour online) (a) UV-visible absorption spectra of the as-synthesized Ba(Co0.8Zn0.2)SiO4 and Ba(Co0.2Zn0.8)SiO4 suspending in water. (b) Tauc plot for calculating band gaps Eg of Ba(Co0.8Zn0.2)SiO4 and Ba(Co0.2Zn0.8)SiO4 by extrapolation of the linear portion of the plots of (αhν)2 vs. hν.
The optical band gaps E g can be estimated from the absorption coefficient (α) using the Tauc relation (Tauc, Reference Tauc, Grigorovici and Vancu1966),
 $$\alpha h\nu = A(h\nu -Eg)^n$$
where A is a constant that depends on the transition probability, hν is the energy of incident photons, n is an index that characterizes the optical absorption process. The values of n = 2, 1/2, 3, and 3/2 correspond to allowed indirect, allowed direct, forbidden indirect and forbidden direct band-gap, respectively (Qasrawi, Reference Qasrawi2005). The UV-visible spectra shown in Figure 7(a) were fitted with n = 1/2, 2, 3, and 3/2. The value of n = ½ was employed in our work to calculate the band gaps. It was reported that Ba2SiO4 (Bispo et al., Reference Bispo, Ceccato, Lima and Pires2017) and Zn2SiO4 (Karazhanov et al., Reference Karazhanov, Ravindran, Fjellvåg and Svensson2009) have direct transitions, in agreement with n = 1/2. A linear fit near the absorption edge can be achieved in the (αhν)1/2 vs. hν plot to calculate the allowed direct band-gap of the semiconductor material. The band gaps Eg of Ba(Co1−xZnx)SiO4 (x = 0.2 and 0.8) were obtained by extrapolating the linear portion of the plot to (αhν)2 = 0, as shown in Figure 7(b). The band gap values (allowed direct electronic transitions) are 3.47 eV for Ba(Co0.8Zn0.2)SiO4 and 3.35 eV for Ba(Co0.2Zn0.8)SiO4. The Co/Zn ratio clearly affects the band-gap value.
Theoretical calculation indicated that the band gap of BaZnSiO4 to be 3.587 eV (Figure S1 in Supporting Information), close to the measured values for those in the Ba(Co,Zn)SiO4 solid solution members. However, the theoretical band gap is only about 2 eV for BaCoSiO4 (Taniguchi et al., Reference Taniguschi, Moriwake, Kuwabara, Okamura, Yamamoto, Okazaki, Itoh and Terasaki2014). It appears that even with a small amount of Zn-doping, the band gap of Ba(Co,Zn)SiO4 increases by a relatively large amount from 2 to 3.47 eV.
From the simulation and experimental measurements, it is clear that the Ba(Co1−xZnx)SiO4 (x = 0.2–0.8) have wide band gaps over 3.3 eV, and only absorb UV portion of the solar radiation. Therefore, the Ba(Co1−xZnx)SiO4 (x = 0.2–0.8) materials are potential UV photocatalysts. In order to obtain photocatalytic Ba(Co1−xZnx)SiO4 materials which absorb visible light, the Zn content should be lower.
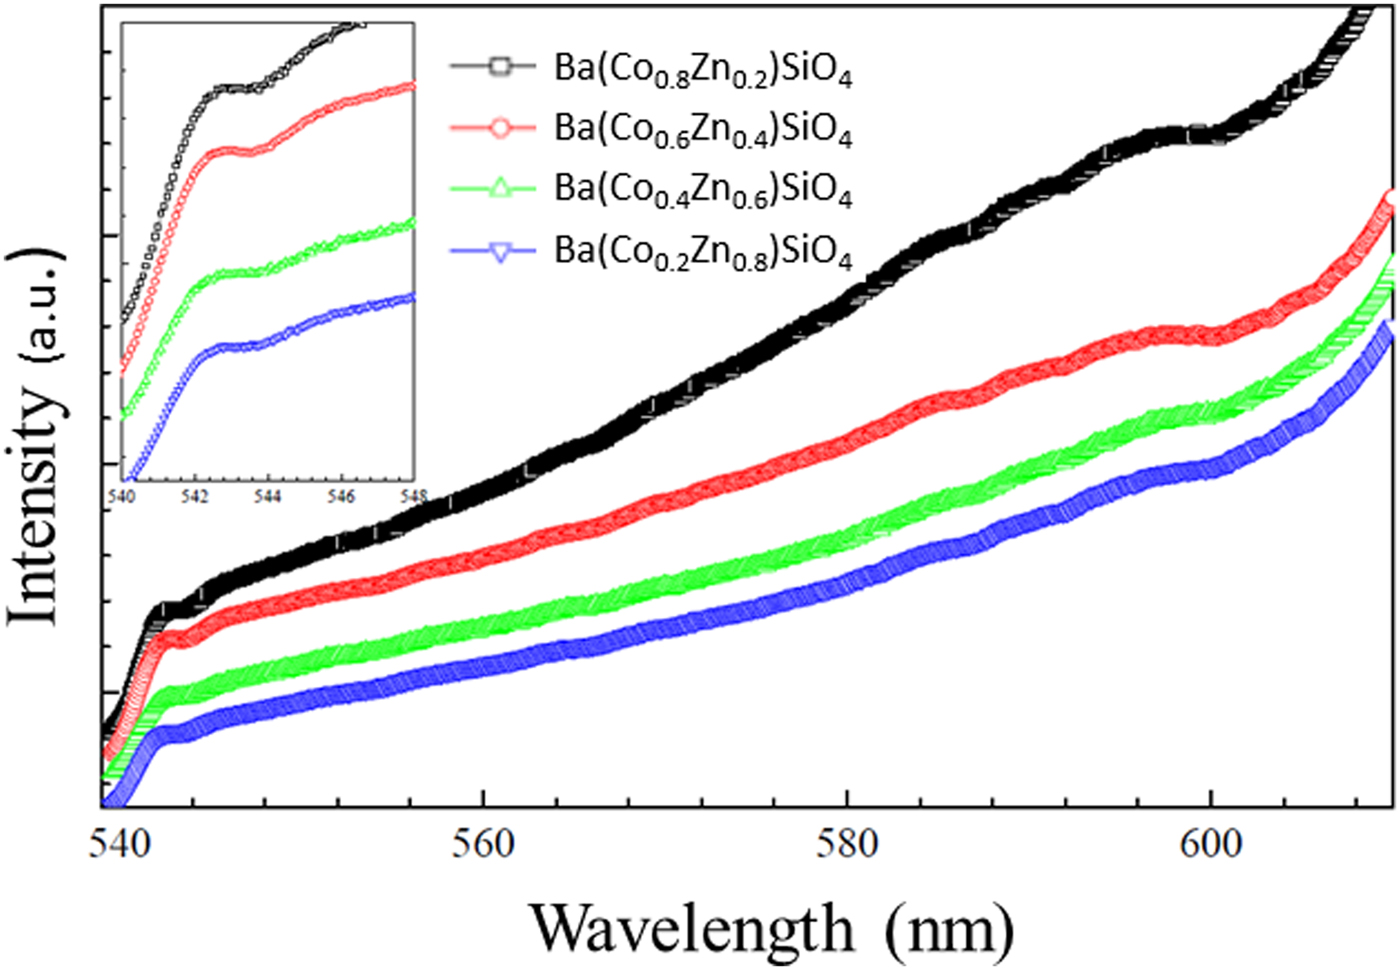
The photoluminescence (PL) emission spectra of Ba(Co1−xZnx)SiO4 are shown in Figure 8. The spectra show broad and intense emission extending to the IR range. Similar to Ba2SiO4 with a wide band gap (Zhang et al., Reference Zhang, Wang, Zhang, Ding and Su2007; Bispo et al., Reference Bispo, Ceccato, Lima and Pires2017), the materials are expected to be suitable for a color converter and solid-state lighting using UV light as an excitation source. It should be noted that the Co/Zn ratio does not affect the main emission peak at 543 nm significantly.

Figure 8. (Colour online) Photoluminescence (PL) emission spectra of Ba(Co1−xZnx)SiO4 under 502 nm excitation. Inset: Zoomed spectrum from 540 to 548 nm for details.
C. Reference powder X-ray diffraction patterns
Reference patterns for Ba(Co1−xZnx)SiO4 (x = 0.2, 0.4, 0.6, 0.8) have been prepared and submitted for inclusion in the PDF. An example of the pattern Ba(Co0.6Zn0.4)SiO4 is given in Table VI. In this pattern, the symbols “M” and “+” refer to peaks containing contributions from two and more than two reflections, respectively. The particular peak that has the strongest intensity in the entire pattern is assigned an intensity of 999 and other lines are scaled relative to this value. In general, the d-spacing values are calculated values from refined lattice parameters. The intensity values reported are integrated intensities (rather than peak heights). For resolved overlapped peaks, intensity-weighted calculated d-spacing, along with the observed integrated intensity and the hkl indices of both peaks (for “M”), or the hkl indices of the strongest peak (for “+”) are used. For peaks that are not resolved at the instrumental resolution, the intensity-weighted average d-spacing and the summed integrated intensity value are used. In the case of a cluster, unconstrained profile fits often reveal the presence of multiple peaks, even when they are closer than the instrumental resolution. In this situation, both d-spacing and intensity values are reported independently.
Table VI. X-ray powder pattern for Ba(Co0.6Zn0.4)SiO4 (P6 3 (No. 173), Z = 6, 9.11386(8) Å, c = 8.70614(13) Å, V = 626.269(11) Å3, D x = 4.628 g.cm−3).

The symbols “M” and “+” refer to peaks containing contributions from two and more than two reflections, respectively. The particular peak that has the strongest intensity in the entire pattern is assigned an intensity of 999 and other lines are scaled relative to this value. The d-spacing values are calculated values from refined lattice parameters, and “I” represents integrated intensity values.
IV. SUMMARY
Ba(Co1−xZnx)SiO4 belong to the large structural family of stuffed-tridymite (SiO2). Crystal structure and reference patterns of the Ba(Co1−xZnx)SiO4 (x = 0.2, 0.4, 0.6, 0.8) series of compounds have been determined. From powder X-ray diffraction studies, Ba(Co1−xZnx)SiO4 adopts a simple hexagonal structure with P6 3 space group (No. 173), with Z = 6. There are three crystallographically independent Ba sites; two nine-fold coordinated and one six-fold sites. The ionic radii of Zn2+ and Co2+ are very similar, resulting in the similarity of the unit cell volume of the solid solution members. The structure consists of fully ordered corner-shared SiO4 and (Co/Zn)O4 tetrahedra. Band gap measurements using UV-visible absorption spectroscopy confirm the band gaps of Ba(Co1−xZnx)SiO4 materials to be too wide to be useful as photocatalysis materials in the visible light range, but as potential UV photocatalysts. Powder X-ray diffraction patterns of these compounds have been submitted to be included in the Powder Diffraction File (PDF).
SUPPLEMENTARY MATERIAL
To view supplementary material for this article, please visit https://doi.org/10.1017/S0885715619000447
Acknowledgement
ICDD is acknowledged for the grants-in-Aid assistance for the project.