


I. INTRODUCTION
In recent years, there has been much renewed interest in silicate materials for photocatalyst applications. Silicate ceramics are versatile materials which have a variety of industrial applications. Besides electrical engineering/electronics, automotive engineering, hot air technology, and telecommunication applications, they can also be used for lighting and optical technology (Paranthaman et al., Reference Paranthaman, Wong-Ng and Bhattacharya2015) and are potential photocatalytic materials. Neatu et al. (Reference Neatu, Puche, Fornes and Garcia2014) have used three different cobalt-containing silicates with different structures to evaluate their photocatalytic activities under different conditions, either for the overall water splitting under UV irradiation in the absence of sacrificial electron donor or for hydrogen generation under simulated sunlight illumination in the presence of methanol. Based on the report that Ag6Si2O7 was found to be a silicate photocatalyst for the visible region (Lou et al., Reference Lou, Huang, Wang, Ma, Zhang, Zhang, Qin, Dai and Whangbo2014), we have recently studied the Ba(Zn,Co)SiO4 series (Anike et al., Reference Anike, Derbushi, Wong-Ng, Liu, King, Wang, Kaduk and Lan2019) and found that all solid solution members except for BaCoSiO4 all have a bandgap of >3.0 eV, rendering them to be potentially suitable in the UV light region.
The demands for optics and optoelectronics for fiber and waveguide materials with nonlinear optical properties have promoted much research interest for glass-ceramic oxide materials that are capable of producing optical second-harmonic generation. For example, the structural dependence of the luminescence of niobite silicate compound, K2(NbO)2Si4O12, has been studied by Blasse (Reference Blasse1980) and Blasse et al. (Reference Blasse, Dirksen, Hazenkamp, Verbaere and Oyetloa1989, Reference Blasse, Dirksen, Crosnier and Pitfard1991, Reference Blasse, Dirksen, Crosnier and Pitfard1992) and by Crosnier et al. (Reference Crosnier, Guyomard, Verbaere, Pitffard and Tournoux1992). Especially interesting has been silicates with efficient luminescence where niobite groups with one short Nb–O distance occur. The importance of this short Nb–O distance and its importance for the luminescence has been explained by the molecular orbital (MO) calculations by Hazenkamp and Blasse (Reference Hazenkamp and Blasse1993) and Hazenkamp et al. (Reference Hazenkamp, van Duijneveldt and Blasse1993). The compound K3(NbO2)3Si2O7, which is built with covalent networks of SiO4 tetrahedra and MO6 octahedra, has been studied extensively by Choisnet et al. (Reference Choisnet, Nguyen, Groult and Raveau1976) and Launay et al. (Reference Launay, Mahé and Quarton1974). Shannon and Katz (Reference Shannon and Katz1970) and Choisnet et al. (Reference Choisnet, Nguyen, Groult and Raveau1976) further investigated the structure of A 3(NbO2)6Si4O14 and A 3(TaO2)6Si4O14 (A = Ba, Sr) for the nonlinear optical, fast alkali-ion mobility, ion-exchange, and potential photocatalysis applications.
The main goal of this study is to determine the detailed structures of the silicate solid solution of Ba3((Nb,Ta)O2)6Si4O14 to provide an accurate basis for bandgap computation. The second goal is to measure and validate with calculations their bandgaps in order to determine whether the materials have the potential applications in the visible light range or ultra-violet light range. Furthermore, since X-ray diffraction (XRD) is a nondestructive technique for phase identification (McMurdie et al., Reference McMurdie, Morris, Evans, Paretzkin, Wong-Ng, Ettlinger and Hubbard1986), X-ray diffraction reference patterns are critical for phase characterization; therefore, another goal of this investigation is to determine the experimental patterns for Ba3(Nb6−xTax)Si4O26 (x = 0.6, 1.8, 3.0, 4.2, 5.4) and to make them widely available through submission to the Powder Diffraction File (PDF) (2019).
II. EXPERIMENTAL
A. Sample preparation
The white powders were prepared from stoichiometric amounts of BaCO3, Nb2O5, Ta2O5, and SiO2 using solid-state high-temperature techniques. The starting samples were mixed, pelletized, and heat treated in the air at 800 °C for 10 h and subsequently annealed at 1100 °C for 12 h, 1200 °C for 36 h with intermediate grindings, and 1300 °C for another 15 h with intermediate grindings. During each heat treatment in air, the samples were furnace cooled. The heat treatment process was repeated until no further changes were detected in the powder X-ray diffraction patterns.
B. Estimation of composition using X-ray fluorescence
The estimation of composition for samples of Ba3(Nb6–xTax)Si4O26 (x = 0.6, 1.8, 3.0, 4.2, 5.4) were performed on a Bruker M4 Tornado micro X-ray fluorescence instrument. A Rh X-ray source, set to 50 kV and 300 μA, with a 20 μm mono-capillary were used for excitation (S.N. 2001495). A Bruker XFlash 450 μm thick, Silicon Drift Detector (S.N. 11881_0239) was used for data collection for the scans. Each spectrum used a minimum peak sum of over 40,000 X-ray counts per analyzed element, reducing counting statistics as a source of uncertainty below all other contributions. Analysis were performed using Bruker Quantify version 1.3.1.3327 with standard Spectrum Elements method and calibrated for our instrument (S.N. 6099). For each sample, 18 independent, 60 second live time measurements were performed, and the variance of the composition derived from these measurements were used for error analysis.
C. X-ray Rietveld refinements and powder reference patterns
The pressed wafers of Ba3(Nb6−xTax)Si4O26 (x = 0.6, 1.8, 3.0, 4.2, 5.4) were mounted in modeling clay, or (where the wafers were not available) as acetone slurries on zero-background cells. The X-ray powder patterns were measured (5–130° 2θ, 0.020 214 4° steps, 1 s step−1, CuKα radiation at 300 K) on a Bruker D2 Phaser diffractometer equipped with a LynxEye detector. (The purpose of identifying the equipment and computer software in this article is to specify the experimental procedure. Such an identification does not imply recommendation or endorsement by the National Institute of Standards and Technology.)
The Rietveld refinement technique (Rietveld, Reference Rietveld1969) with the software suite GSAS (Larson and von Dreele, Reference Larson and von Dreele2004) was used to determine the structure of the Ba3(Nb6−xTax)Si4O26 (x = 0.6, 1.8, 3.0, 4.2, 5.4) series. The structure of Ba3Ta6Si4O26 (PDF 04-011-0699) was used as the starting model for the refinements. Reference patterns were obtained with a Rietveld pattern decomposition technique. Using this technique, the reported peak intensities were derived from the extracted integrated intensities and positions calculated from the lattice parameters. The pseudo-Voight function (profile function #4) was used for the refinement of both series of compounds (Thompson et al., Reference Finger, Cox and Jephcoat1987; Finger et al., Reference Stephens1994); Stephens, Reference Thompson, Cox and Hastings1999). When peaks are not resolved at the resolution function, the intensities are summed, and an intensity-weighted d-spacing is reported. In summary, these patterns represent ideal specimen patterns.
D. Bond valence sum calculations
The bond valence sum values, BVS, for Ba, Ta, Nb, and Si sites were calculated using the Brown–Altermatt empirical expression (Brown and Altermatt, Reference Brese and O'Keeffe1985; Brese and O’Keeffe, Reference Brown and Altermatt1991). The BVS of an atom i is defined as the sum of the bond valences v ij of all the bonds from atoms i to atoms j. The most commonly adopted empirical expression for the bond valence v ij as a function of the interatomic distance d ij is v ij = exp[(R 0− d ij)/B]. The parameter, B, is commonly taken to be a “universal” constant equal to 0.37 Å. The values for the reference distance R 0 for Ba–O, Nb–O, Ta–O, and Si–O are 2.29, 1.911, 1.92, and 1.624, respectively (Brown and Altermatt, Reference Brese and O'Keeffe1985; Brese and O’Keeffe, Reference Brown and Altermatt1991). In the sites, where there are more than two different types of atoms, the BVS value is the weighted sum of the fraction of occupancy.
E. Bandgap measurements and calculations
The optical properties of the Ba3(Nb6−xTax)Si4O26 (x = 0.6, 1.8, 3.0, 4.2, 5.4) compounds were investigated by measuring the UV–visible absorption spectra by using a Shimadzu UV-3600 UV-VIS-NIR spectrophotometer.
Bandgap calculations were conducted using the density functional theory (DFT) approach. We use the linearized augmented plane wave (LAPW) method for the computation of the electronic structure. The calculations were performed using the Elk package (2019). The generalized gradient approximation (GGA) was used for the correlation and exchange potentials (Perdew et al., Reference Perdew, Burke and Ernzerhof1996). The atomic sphere radii that we used were 2.5 a.u. for Ba, 1.91 a.u. for Nb and Ta, and 1.39 and 1.62 a.u. for Si and O, respectively (Blaha et al., Reference Blaha, Schwarz, Sorantin and Trickey1990). The RK max parameter was set to be 5.5. Self-interaction corrections for d electrons are introduced by an on-site Coulomb and exchange interactions, namely the Hubbard and exchange parameter U and J, with U = 0.187, J = 0.039 Ry for Nb, U = 0.173 and J = 0.036 Ry for Ta, according to the report by Solovyev et al. (Reference Solovyev, Dederichs and Anisimov1994). The energy convergence criteria are 10−5 Ry, and the charge convergence criteria are 10−3.
III. RESULTS AND DISCUSSION
During the atomic Nb/Ta concentration ratio calculations for Ba3(Nb6–xTax)Si4O26 (x = 0.6,1.8 3.0, 4.2, 5.4) using the X-ray fluorescence technique, the Ba concentration was assumed to be 3. Our results confirm the ratio of the concentration of Nb/Ta to be in reasonable agreement with the intended compositions within 1.5 σ (standard deviations), namely, 6.57(0.72)/0.533(0.058) for Ba3(Nb5.4Ta0.6)Si4O26, 6.08(1.72)/1.91(0.54) for Ba3(Nb4.2Ta1.8)Si4O26, 3.34(0.46)/3.03(0.41) for Ba3(Nb3Ta3)Si4O26, 1.96(0.2)/4.24(0.44) for Ba3(Nb1.8Ta4.2)Si4O26, and 0.65(0.84)/5.37(0.69) for Ba3(Nb0.6Ta5.4)Si4O26.The numbers inside the brackets represent 1 σ.
A. Structure of Ba3(Nb6−xTax)Si4O26
Figure 1 gives the plots of Rietveld refinements for Ba3(Nb3Ta3)Si4O26, as an example, where observed (crosses), calculated (solid line), and difference XRD patterns (bottom) are shown. The tick marks indicate the calculated peak positions, and the difference pattern is plotted on the same scale as other patterns. The refinement results are shown in Table I. A small amount of impurity phases has been found with a few of the phases. For example, 2.6% of Ba1.31O15.63 Ta5.63 was found to coexist with Ba3(Nb1.8Ta4.2)Si4O26. The atomic coordinates and displacement parameters of Ba3(Nb6−xTax)Si4O26 (x = 0.6, 1.8, 3.0, 4.2, 5.4) are given in Supplementary Table SI. Tables II and III summarize the lattice parameters, bond distances, and BVS values. Selected bond angles concerning the (Nb/Ta)O6 octahedra and the SiO4 tetrahedra are given in Supplementary Table SII.
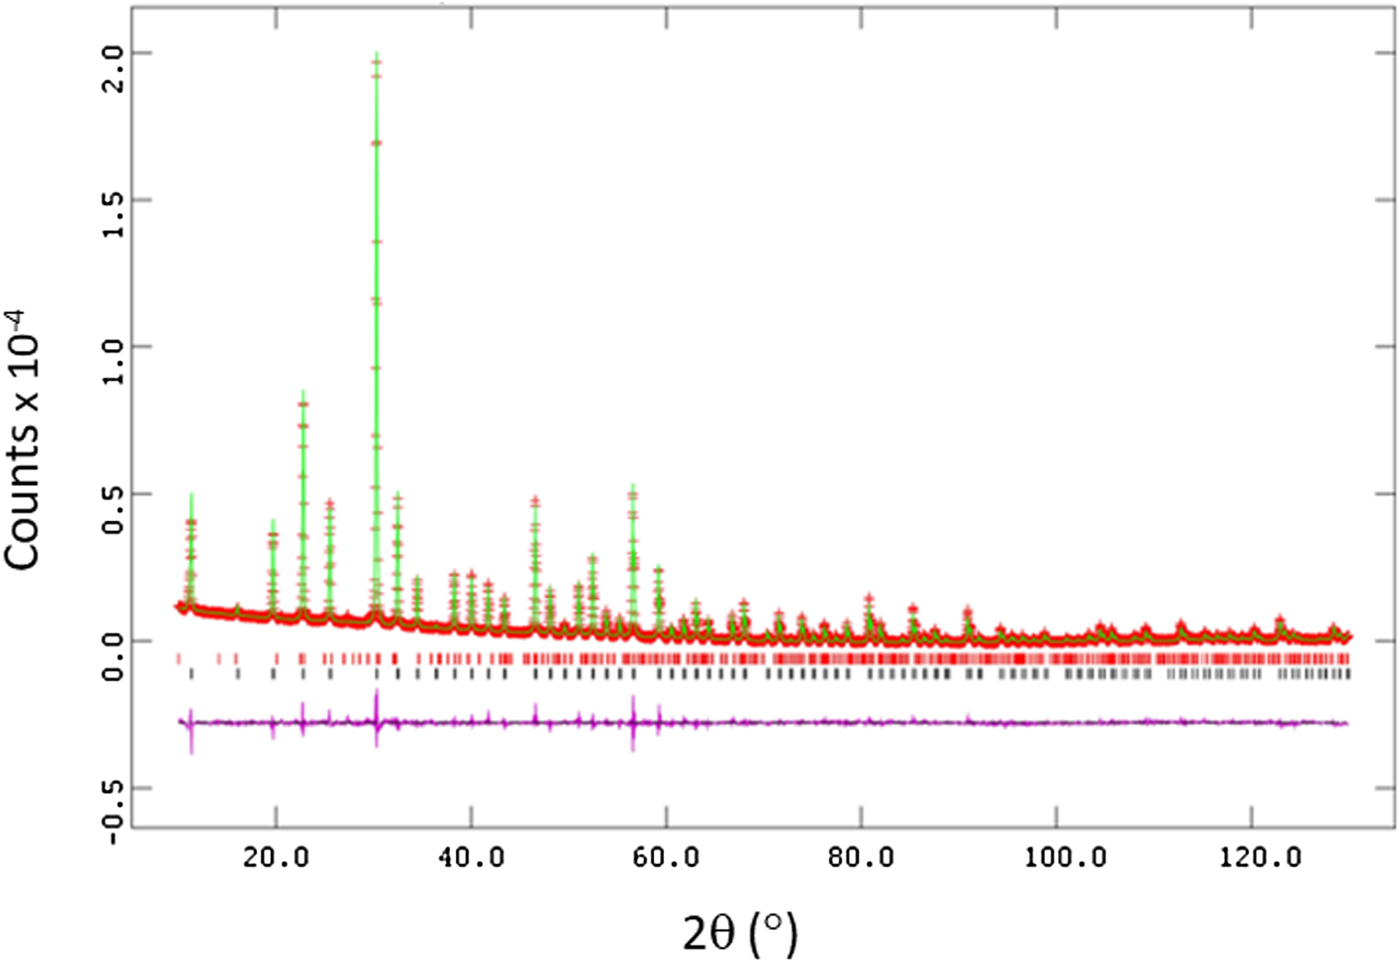
Figure 1. Observed (crosses), calculated (solid line), and difference XRD patterns (bottom) for Ba3(Ta3Nb3)Si4O26 by a Rietveld analysis technique. The difference pattern is plotted at the same scale as the other calculated peak positions. The small peak in the 2θ around the 28° region is the Kβ peak of the 110 reflection. Its presence does not interfere with the refinement.
TABLE I. Rietveld refinement residuals for Ba3(Nb6−xTax)Si4O26 [P-62m (No. 189), Z = 1].

TABLE II. Cell parameters for Ba3(Nb6−xTax)Si4O26 (x = 0.6–5.4), space group P-62m (No. 189), Z = 1., and D cal represents calculated density
D cal represents calculated density.
TABLE III. Bond distances and BVS values for Ba3(Nb3Ta3)Si4O26, P-62m (No. 189), Z = 1.

The ideal BVS values are 2.0 (Ba site), 5.0 (mixed Nb/Ta site), and 4.0 (Si site), respectively. The values for the reference distance R 0 for Ba–O, Nb–O, Ta–O, and Si–O are 2.29, 1.911, 1.92, and 1.624, respectively (Brown and Altermatt, Reference Brese and O'Keeffe1985; Brese and O’Keeffe, Reference Brown and Altermatt1991).
The materials crystallize in the space group of P-62m (No. 189), Z = 1. Lattice parameters and calculated density D x are reported in Table II. It is seen that as the Ta content increases from x = 0.6–5.4, the lattice parameter a increases from a = 8.988 04(8) to 9.005 65(9) Å, while c decreases from 7.837 21(10) to 7.752 12(12) Å, giving rise to a slight decrease in the cell volume from 548.304(11) to 544.479(14) Å3. As expected, the D x values increase from 4.70 to 6.02 g cm−3 as the size of ionic radius, r(R 3+) (Shannon, Reference Shannon1976) decreases. Compositional dependence of the unit cell volume, V, for Ba3(Nb6−xTax)Si4O26 is given in Figure 2, and a monotonic decrease of V is observed.
Figure 2. Compositional dependence of the unit cell volume, V, for Ba3(Nb6−xTax)Si4O26. A monotonic decrease of V is observed.
The structure of Ba3(Nb6−xTax)Si4O26 viewed along the c-axis and a-axis is shown in Figures 3 and 4. The atomic labeling schemes are shown in Supplementary Figures S1 and S2. The structure consists of corner-shared distorted SiO4 tetrahedra and (Nb/Ta)O6 octahedra. In Figure 4, it is seen that the rings of three cornered-linked (Nb,Ta)O6 octahedra are linked to form continuous chains, and these chains, in turn, are held together by Si2O7 groups (or two corner-shared SiO4 tetrahedral units). The Si and Nb/Ta sites all have distorted environments (Table III). The Si–O distances exhibit a narrow spread from 1.600(3) to 1.612(2) Å. In the distorted (Nb/Ta)O6 octahedral environment, one of the Nb–O distances is particularly short (1.922(2)–1.939(2) Å) as compared with the rest (1.972(2)–2.028(2) Å). This observation agrees with that reported in K2(NbO)2Si4O12 (Blasse et al., Reference Blasse, Dirksen, Crosnier and Pitfard1992) as one of the prerequisites to be an efficient luminescence material.
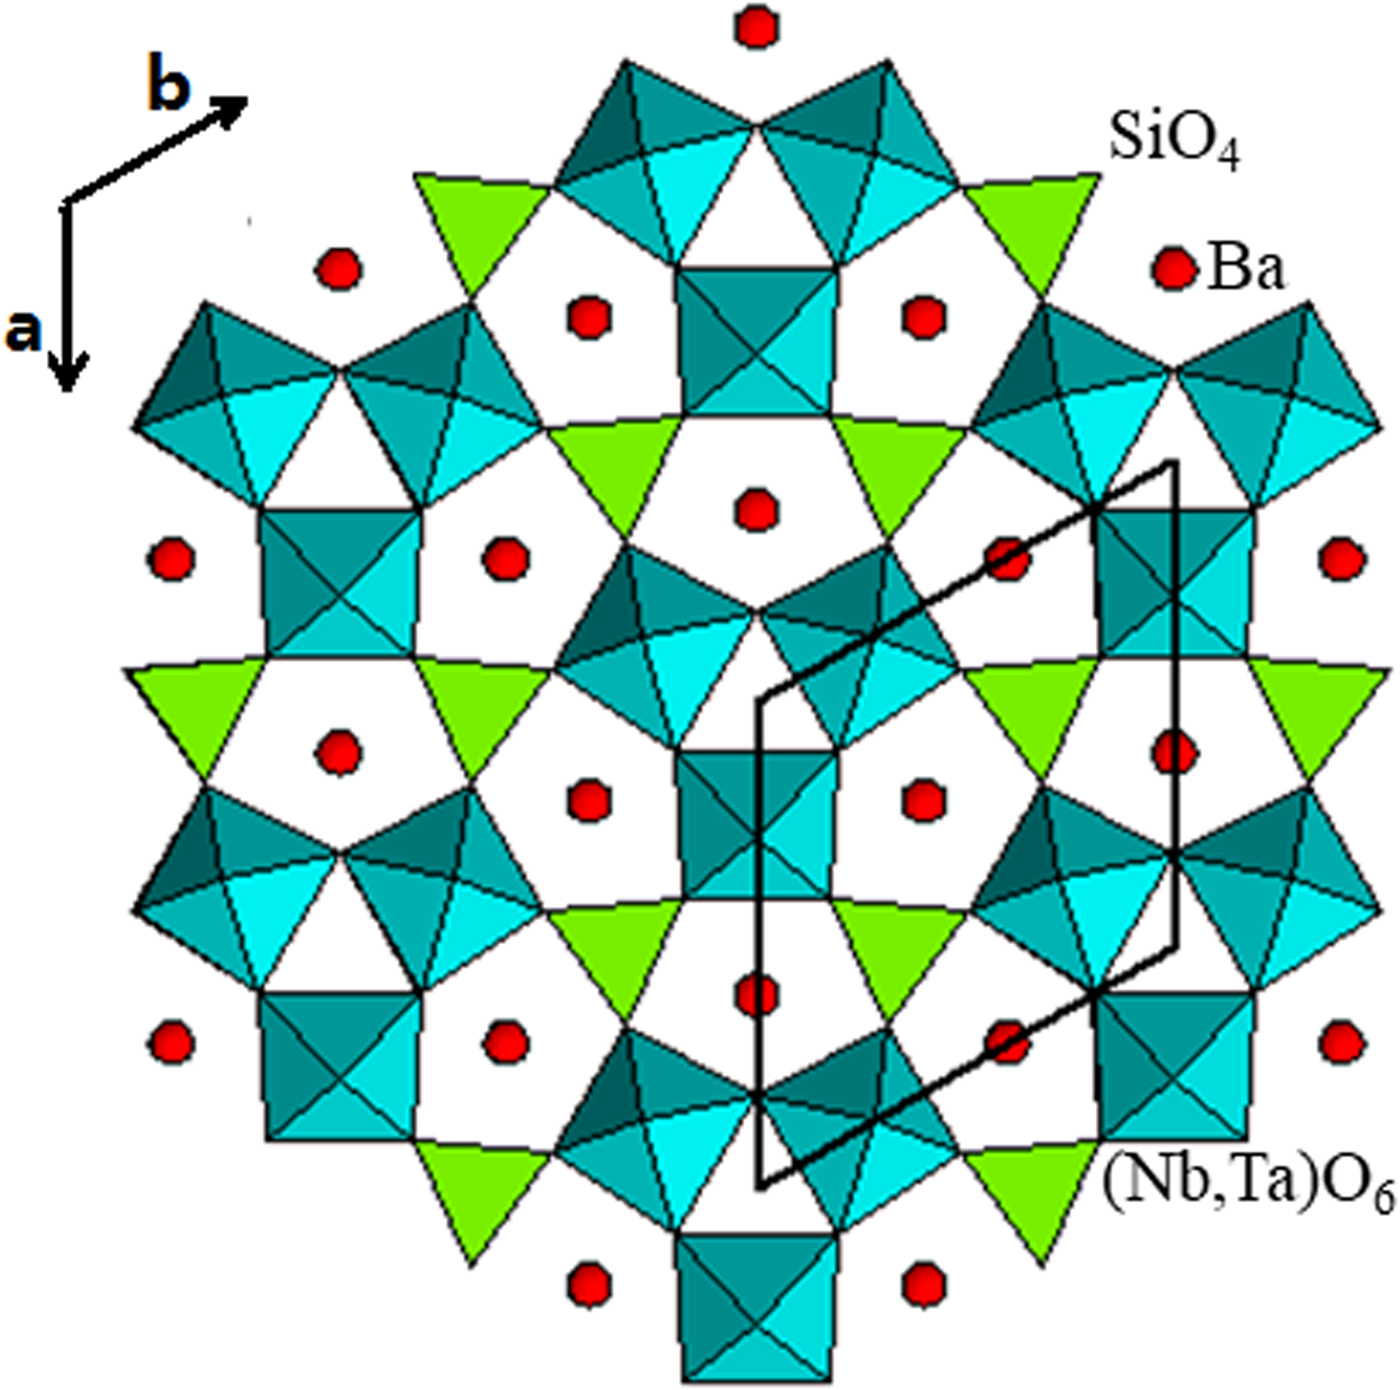
Figure 3. [001] Projection of the crystal structure of Ba3(Nb6−xTax)Si4O26 showing the Ba-filled distorted fivefold coordination channels.
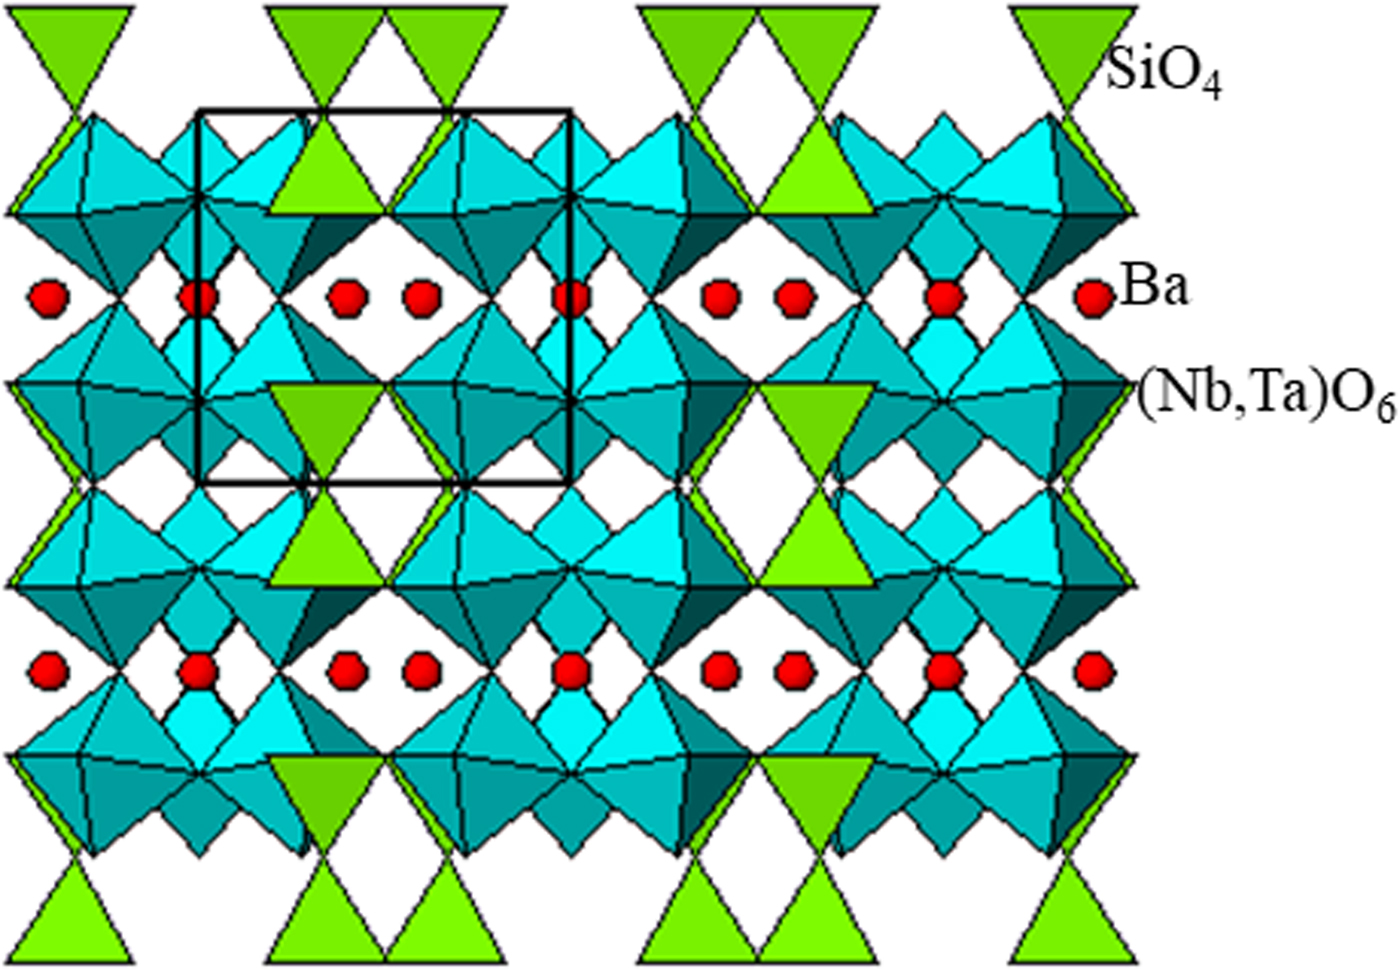
Figure 4. [100] Projection of the crystal structure of Ba3(Nb6−xTax)Si4O26 derived from the X-ray powder data, showing cornered-shared (Ta,Nb)O6 octahedra and SiO4 tetrahedra.
The coordination number (C.N.) for all Ba sites is 13 for the five Ba3(Nb6−xTax)Si4O26 compounds, and the environment of each Ba site is a distorted pentagonal prism. In Figure 3, Ba atoms are situated inside a distorted pentagonal channel. Among the 13 Ba–O distances, 10 of them range from 2.812(8) to 3.089(6) Å, while the other three are longer, ranging from 3.110(2) to 3.512(11) Å.
Another structure feature of the Ba3(Nb6−xTax)Si4O26 series is the linearity of the Si–O–Si groups. Apparently, there have been disputes in literature about the reality of this angle. For example, Liebau considered the reported linearity was due to a wrong symmetry assignment. A number of other authors also reported the observed linear Si–O–Si groups (Zoltai and Buerger, Reference Cruickshank, Lynton and Barclay1959; Cruickshank, Reference Cruickshank1961; Cruickshank et al., Reference Launay, Mahé and Quarton1962; Launay et al., Reference Zoltai and Buerger1974). In our compounds, the Si–O5–Si angles are all 180° (Supplementary Table SII). Apparently, the Si–O–Si angles are very flexible in silicate-type of compounds. The Si–O–Si bond angles in low-pressure crystalline structures vary from 134° to 150°, with some extremes near 160°. In α-quartz and α-cristobalite, the Si–O–Si bond angles are around 144°, with average Si–O bond lengths of 1.61 Å (Yuan and Cormack, Reference Yuan and Cormack2003).
The BVS values of the Ba site were found to increase when the x value increases (Table III). For example, when x = 0.6, 1.8, 3.0, 4.2, 5.4, the BVS values increase from 2.090, 2.105, 2.115, 2.155 to 2.200. All these values are somewhat greater than the ideal value of 2.0, indicating over-bonding situation, or the cage size is too small. The BVS values for the Si sites are all similar and are all slightly greater than the ideal value of 4.0 (ranging from 4.16 to 4.19), indicating over-bonding situation. For the Nb/Ta sites, all BVS values are slightly less than 5.0, suggesting under-bonding (cage too large).
B. Optical properties of Ba3(Nb6−xTax)Si4O26
Figure 5 and Supplementary Figures S3–S6 provide the UV–visible absorption spectra of the five Ba3(Nb6−xTax)Si4O26 (x = 0.6, 1.8, 3.0, 4.2, 5.4) compounds. There is a strong absorption peak around 300 nm for all these samples. The optical bandgaps E g corresponding to the energy separation can be estimated via the direct allowed inter-band transition (Qasrawi, Reference Qasrawi2005) between the maxima of the valence band and the minima of conduction band using the Tauc's law (Tauc et al., Reference Tauc, Grigorovici and Vancu1966):
 $$\alpha h\nu = A\lpar {h\nu -E_{\rm g}} \rpar ^n$$
where A is a constant that depends on the transition probability, hν is the energy of incident photons, and n is an index that characterizes the optical absorption process. The values of n = 2, 1/2, 3, and 3/2 correspond to allowed indirect, allowed direct, forbidden indirect, and forbidden direct bandgap, respectively. The value of n = ½ was employed in our work to calculate the bandgaps.
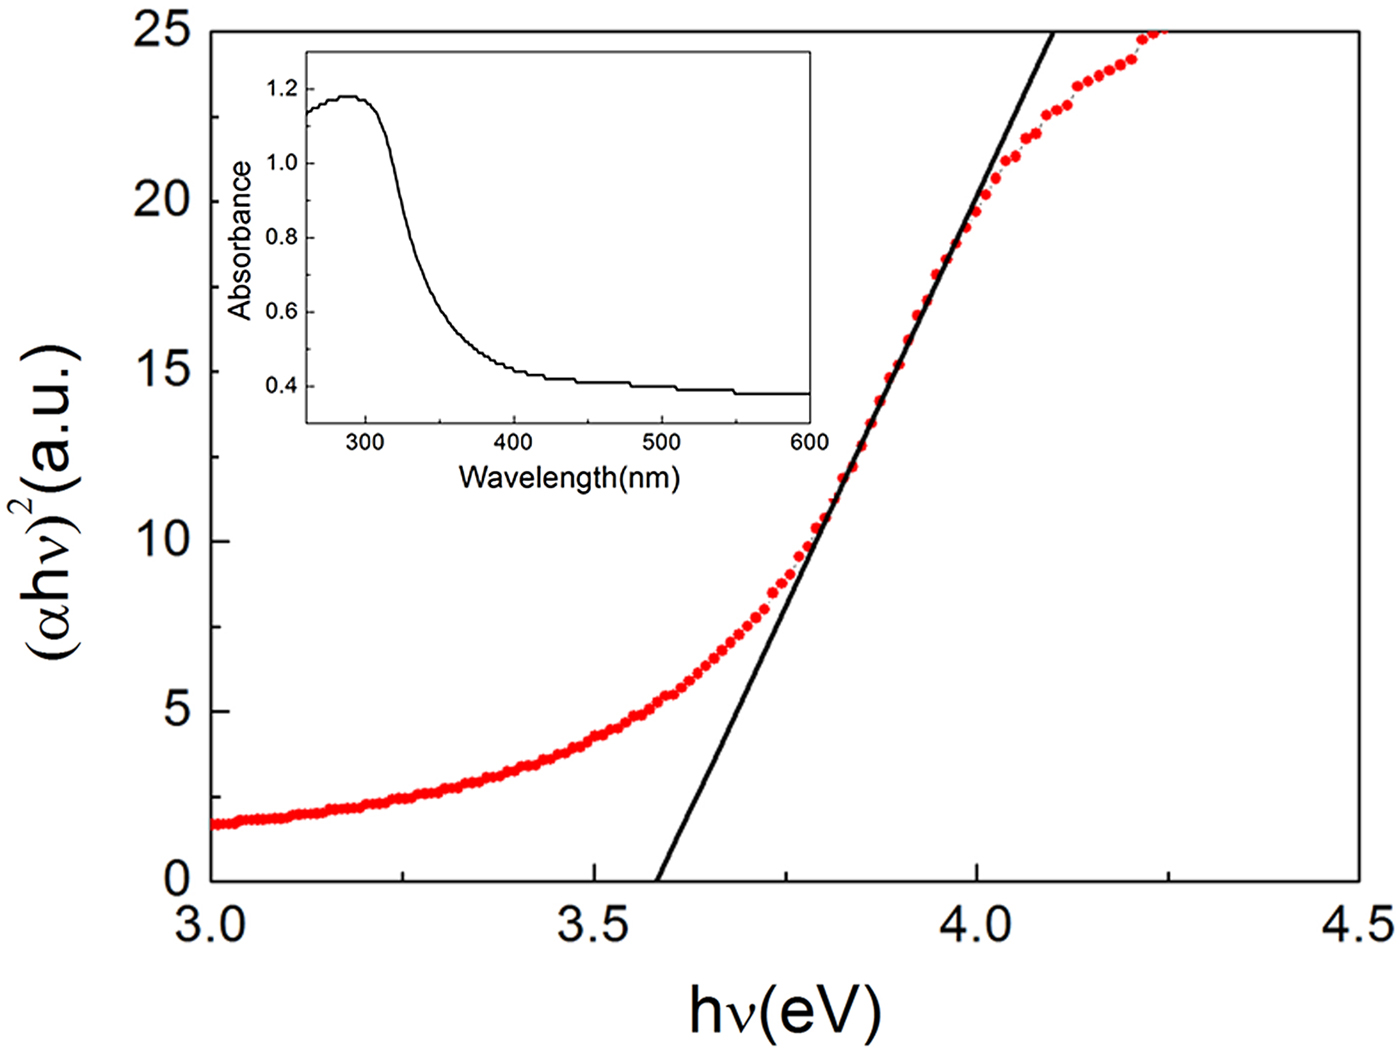
Figure 5. UV–visible absorption spectra of the as-synthesized Ba3(Nb3Ta3)Si4O26, and Tauc plot for calculating bandgaps E g by extrapolation of the linear portion of the plots of (αhν)2 vs. hν. Insert is the corresponding absorbance curve.
The bandgaps E g of Ba3(Nb6−xTax)Si4O26 (x = 0.6, 1.8, 3.0, 4.2, 5.4) were obtained by extrapolating the linear portion of the plot to (αhν)2 = 0. An example of x = 3.0 is shown in Figure 5. The plots for samples with x = 0.6, 1.8, 4.2, 5.4 are shown in Supplementary Figures S1–S4. The bandgap values, E g, are between 3.39 and 3.59 eV, and they increase slightly with x. The Nb/Ta ratio appears to affect the bandgap value insignificantly. From these values, it is clear that the Ba3(Nb6−xTax)Si4O26 phases (x = 0.6, 1.8, 3.0, 4.2, 5.4) have wide bandgaps over 3.0 eV and will only absorb near-ultraviolet portion (300–400 nm or 3.10–4.13 eV) of the solar radiation. Therefore, the Ba3(Nb6−xTax)Si4O26 materials are potential candidates for UV photocatalysts. Substitution of Nb by Ta does not have a significant effect on the E g values.
Figure 6 gives the structural model for the DFT calculation for Ba3(Nb3Ta3) Si4O26. The density of states vs. E−E F plots for Ba3(Nb3Ta3)Si4O26 using GGA and GGA + U approaches are shown in Figures 7(a) and 7(b). After including the Coulomb and exchange interactions, the bandgaps have slightly increased from an E g value of 2.85 eV to a value of 3.07 eV. This value, while lower than the experimental value of about 3.58 eV, could be considered as acceptable. According to Perdew (Reference Perdew1986), using the DFT approach, the bandgap values of transition metal and rare-earth containing compounds were often calculated to be lower than the experimental values (Perdew, Reference Perdew1986). With an orbital-dependent on-site Coulomb interaction (U) and exchange interaction (J), one can somewhat improve the results. However, it is still notable that for compounds with partially-occupied d- or f-orbitals, the calculated bandgaps are still underestimated using local density approximation or GGA techniques.
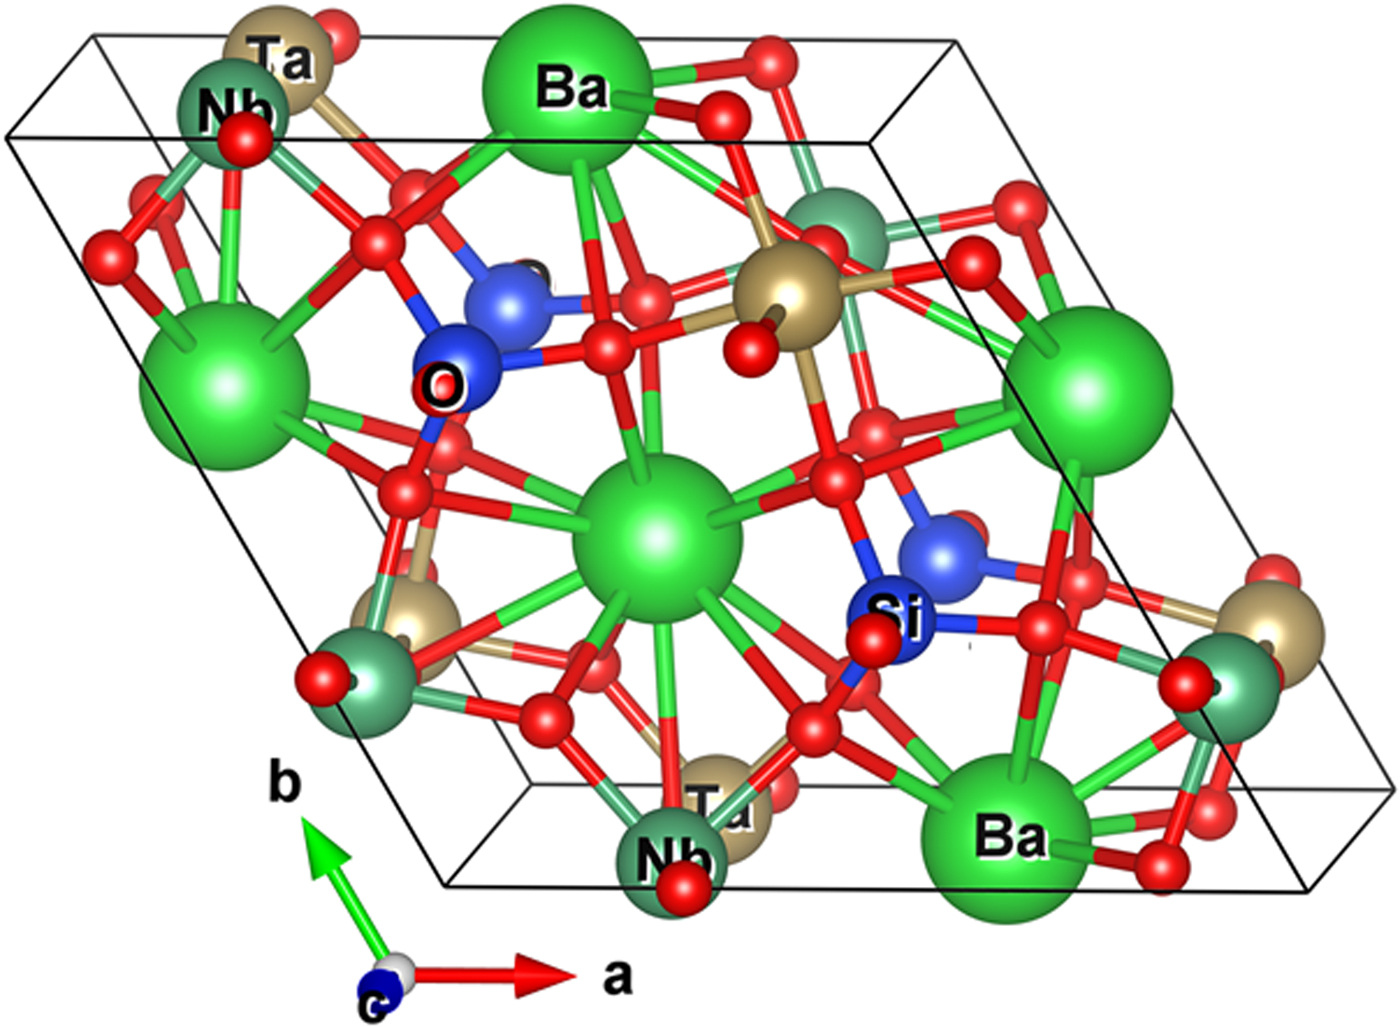
Figure 6. Structural model used for the DFT calculations for the sample Ba3(Nb3Ta3) Si4O26.
Figure 7. Density of states vs. E−E F plot for Ba3(Nb3Ta3)Si4O26: (a) With GGA and (b) with GGA + U approaches. E F stands for the Fermi energy level.
C. Reference X-ray diffraction pattern
Reference Blasse, Dirksen, Hazenkamp, Verbaere and Oyetloa1989 gives the reference pattern for Ba3(Ta3Nb3)Si4O26. In this pattern, the symbols “M” and “+” refer to peaks containing contributions from two and more than two reflections, respectively. The particular peak that has the strongest intensity in the entire pattern is assigned an intensity of 999, and other lines are scaled relative to this value. In general, the d-spacing values are calculated values from refined lattice parameters. The intensity values reported are integrated intensities (rather than peak heights) based on the corresponding profile parameters as reported in Table IV. For resolved, overlapped peaks, intensity-weighted calculated d-spacing, along with the observed integrated intensity and the hkl indices of both peaks (for “M”), or the hkl indices of the strongest peak (for “+”) are used. For peaks that are not resolved at the instrumental resolution, the intensity-weighted average d-spacing and the summed integrated intensity value are used. In the case of a cluster, unconstrained profile fits often reveal the presence of multiple peaks, even when they are closer than the instrumental resolution. In this situation, both d-spacing and intensity values are reported independently. All patterns have been submitted for inclusion in the PDF.
TABLE IV. X-ray reference powder diffraction pattern of Ba3(Nb3Ta3)Si4O26 [P-62m (No. 189), a = 8.998 61(10) Å, c = 7.7902(2) Å, V = 546.295(11) Å3, and D x = 5.36 g cm−3].

The symbols “M” and “+” refer to peaks containing contributions from two and more than two reflections, respectively. The particular peak that has the strongest intensity in the entire pattern is assigned an intensity of 999, and other lines are scaled relative to this value. The d-spacing values are the calculated values from refined lattice parameters, and “I” represents integrated intensity values.
D. Summary
A solid solution of the series Ba3(Nb6−xTax)Si4O26 (x = 0.6, 1.8, 3.0, 4.2, 5.4) has been prepared successfully, and their crystal structures have been determined. Ba3(Nb6−xTax)Si4O26 crystallizes in the hexagonal symmetry with the space group of P-62m (No. 189), with Z = 1. The structure consists of rings of three cornered-linked (Nb,Ta)O6 octahedra linked to form continuous chains along the c-axis, the chains, in turn, are held together by Si2O7 groups. Another structure feature is the linear Si–O–Si chains found among the Si2O7 groups. The bandgap values (allowed direct electronic transitions) were between 3.39 and 3.59 eV. The Nb/Ta ratio affect the bandgap value only slightly. These Ba3(Nb6−xTax)Si4O26 materials are potential candidates for UV photocatalysts. The X-ray powder diffraction patterns of the Ba3(Nb6−xTax)Si4O26 (x = 0.6, 1.8, 3.0, 4.2, 5.4) series have been submitted to be included in the PDF.
SUPPLEMENTARY MATERIAL
The supplementary material for this article can be found at https://doi.org/10.1017/S0885715619000745
ACKNOWLEDGEMENT
ICDD is acknowledged for the Grant-in-Aid assistance for the project (Grant No. 09-03).


