I. INTRODUCTION
Superelasticity (or pseudoelasticity) is a property of NiTi shape memory alloys (SMAs), which is of pronounced technological interest. The effect derives from the reversible stress-induced austenite (BCC)-to-martensite (monoclinic) (A–M) phase transformation (Funakubo, Reference Funakubo1986). When NiTi SMAs are tensilely (or compressively) loaded above the austenite finish temperature (A f), after a linear elastic deformation stage, an apparently plastic deformation occurs, often at its initiation accompanied by a decrease in the stress. This region of apparent plastic deformation, during which the A–M transformation occurs via the propagation of transformation fronts, is characterized by a plateau-type part of the stress–strain curve (“the transformation plateau”) (Sittner et al., Reference Sittner, Liu and Novak2005), that is almost completely recovered upon unloading (Otsuka and Shimizu, Reference Otsuka and Shimizu1986); strain recovering of up to 10% occurs (Otsuka and Ren, Reference Otsuka and Ren2005). The so-called thermal or mechanical fatigue behavior (exhibited by material undergoing multiple thermally or strain-induced transformation cycles) is of significant technological interest, as such fatigue can cause degradation of the material's behavior (Melton and Mercier, Reference Melton and Mercier1979; Lagoudas, Reference Lagoudas2008). Fatigue studies have been performed extensively in the past and thus changes induced by load-cycling, such as decrease of the Young's modulus, the critical stress for the A–M transformation and the stress–strain hysteresis (Miyazaki et al., Reference Miyazaki, Imai, Igo and Otsuka1986b; Strnadel et al., Reference Strnadel, Ohashi, Ohtsuka, Ishihara and Miyazaki1995; Tobushi et al., Reference Tobushi, Ikai, Yamada, Tanaka and Lexcellent1996; Liu et al., Reference Liu, Houver, Xiang, Bataillard and Miyazaki1999; Brinson et al., Reference Brinson, Schmidt and Lammering2004; Nemat-Nasser and Guo, Reference Nemat-Nasser and Guo2006; Nayan et al., Reference Nayan, Roy, Buravalla and Ramamurty2008; Kang et al., Reference Kang, Kan, Qian and Liu2009) and by thermally cycling such as decrease of martensite finish (Mf), austenite start (As), and austenite finish (Af) temperatures, increase of dislocation density and appearance of the R phase (Miyazaki et al., Reference Miyazaki, Igo and Otsuka1986a; McCormick and Liu, Reference McCormick and Liu1994; Hammersley, Reference Hammersley1997; Matsumoto, Reference Matsumoto2003; Liu et al., Reference Liu, Laeng, Chin and Nam2006; Pelton et al., Reference Pelton, Huang, Moine and Sinclair2012), have been documented. However, these previous studies generally do not expose the A–M transformation mechanism in association with the type of loading. Knowledge of the evolution of the martensite fraction upon repeated transformation cycles is important not only for understanding the nature of the A–M transformation, but it also is of obvious practical importance.
Diffraction techniques have been employed in several studies to examine the A–M (or M–A) transformation kinetics and mechanisms in strain-induced transformations (Bourke et al., Reference Bourke, Vaidyanathan and Dunand1996; Vaidyanathan et al., Reference Vaidyanathan, Bourke and Dunand1999b, Reference Vaidyanathan, Bourke and Dunand2001; Sittner et al., Reference Sittner, Lukáš, Novák, Daymond and Swallowe2004; Raghunathan et al., Reference Raghunathan, Azeem, Collins and Dye2008) or temperature-induced transformations (Eggeler et al., Reference Eggeler, Khalil-Allafi, Gollerthan, Somsen, Schmahl and Sheptyakov2005; Khalil-Allafi et al., Reference Khalil-Allafi, Eggeler, Schmahl and Sheptyakov2006; Koker et al., Reference Koker, Schaab, Zotov and Mittemeijer2013) by either employing in situ X-ray or neutron diffraction. These studies were focused on characterizing overall phase fractions, thereby overlooking that the A–M transformation may be of macroscopically heterogeneous character. Thus the A–M transformation has been classified as to be of Lüders-type by Miyazaki et al. (Reference Miyazaki, Imai, Otsuka and Suzuki1981). Within this context, it is noted that some austenite may be retained within the martensite (Bourke et al., Reference Bourke, Vaidyanathan and Dunand1996; Khalil-Allafi et al., Reference Khalil-Allafi, Hasse, Klönne, Wagner, Pirling, Predki and Schmahl2004; Young et al., Reference Young, Wagner, Frenzel, Schmahl and Eggeler2010). This retained austenite is, in some cases, transformed to martensite after the phenomenological end of the “transformation plateau”, during the elastic straining of the overall martensitic specimen (Tan et al., Reference Tan, Liu, Sittner and Saunders2004).
The present work involves a quantitative study of the reversible A–M transformation in thermally cycled (TC) NiTi SMAs, on the basis of in situ X-ray diffraction (XRD) (laboratory and synchrotron) techniques and presents a spatial analysis of the progress of the A–M transformation, that is, as a function of the position along the specimen and the applied strain. Additional characterization of the martensite fraction within the transformation bands, the overall austenite and martensite lattice strain, crystallite size, and microstrain have been performed as well.
II. EXPERIMENTAL
A. Specimen preparation
NiTi SMAs in sheet form were acquired from Memry GmbH (Germany). The Ni content was 50.3 at.% Ni (as determined by ICP-OES in the present study). The sheets were cut in “dog-bone” shape specimens, with the long axis of the specimens being parallel to the long direction of the original sheets. Thermal cycling was conducted by dipping the specimens in boiling water and liquid nitrogen, each for 3 min, for 100 cycles.
B. In situ laboratory and synchrotron XRD
In situ laboratory XRD studies were undertaken at room temperature (RT) on a Bruker D8 diffractometer using CuKα radiation (X-ray generator settings were 40 kV and 30 mA) and a SOLIX detector, as shown in Figure 1(a). A Kammrath & Weiss (Germany) Tensile/Compression Module equipped with a 10 kN loading shell was mounted on the diffractometer. Polycapillary optics in the incident beam (spot-size of approximately 1 × 6 mm2) and Soller slits in the diffracted beam were employed. The specimen was loaded along a complete superelastic cycle in displacement-control mode with 1 μm s−1 displacement speed. The XRD measurement was performed upon stopping the tensile test at specific strains during loading/unloading of the specimens. The evolution of the A–M transformation was studied by following the variation of the maximum intensity of the (110) reflection of the austenite phase along the specimen's strain gauge (the central region of the dog-bone specimen where the width is constant) with a step size of 0.5 mm and a counting time of 3 s per step. The martensite fraction was calculated by Eq. (1):
 $$\xi _{\rm M} = 1 - \displaystyle{{I{\rm ^{\prime}}} \over {I_0 }}$$
where I′ is the maximum intensity of the (110) austenite reflection at a given strain and I 0 is the maximum intensity of the (110) austenite reflection in the unstrained state along the strain gauge. It should be noted that by determining (for selected specimens) the martensite fraction, according to Eq. (1), not from the maximum intensity of the (110) austenite reflection but from the integrated intensity, similar results were obtained.

Figure 1. (Color online) Experimental setup for in situ tensile measurements (a) on a conventional X-ray diffractometer in the laboratory (Bruker D8) and (b) on the diffractometer at the MPI beamline at ANKA, Karlsruhe, Germany.
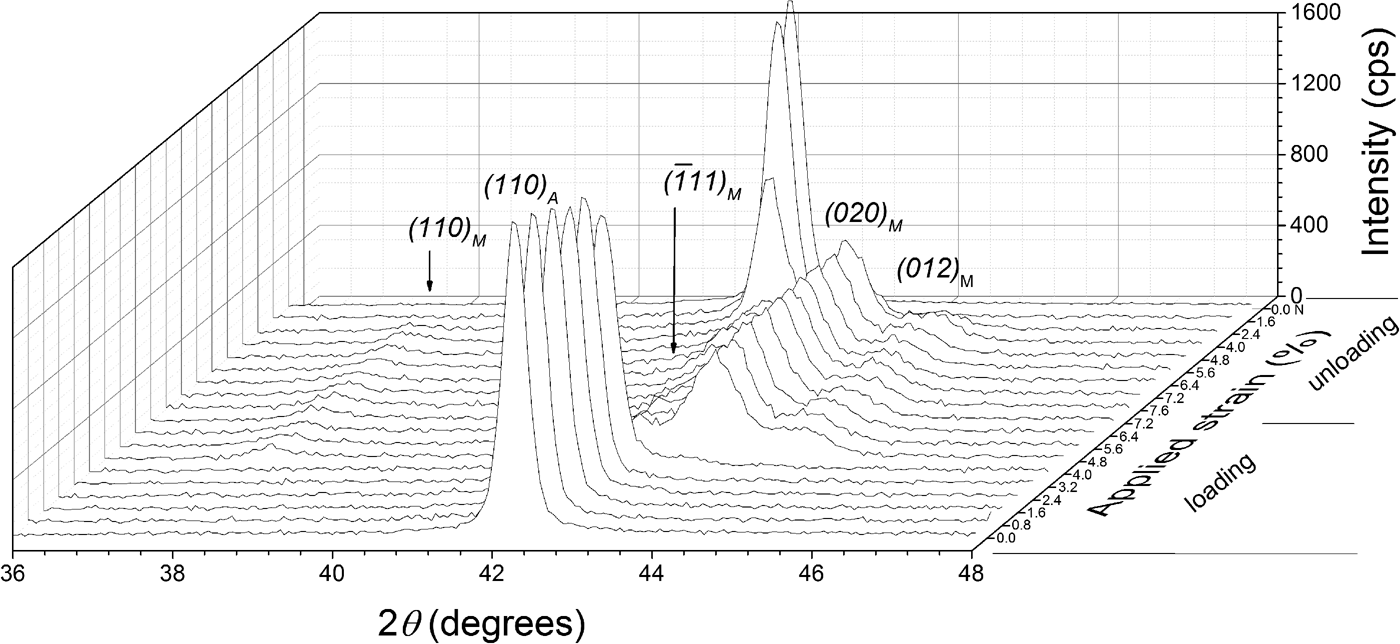
Additionally, diffraction patterns were collected at the center of the specimen in a 2θ range of 36°–46°, with a stepsize of 0.04° 2θ and a counting time of 3 s per step. The diffraction-line profiles were fitted with pseudo-Voigt functions using the software package WinPLOTR (Roisnel and Rodríguez-Carvajal, Reference Roisnel and Rodríguez-Carvajal2000). A characteristic stack of diffraction patterns is shown in Figure 2, as recorded from the center of the TC specimen along one superelastic cycle, showing the relatively abrupt formation of the martensite phase upon loading and the similarly abrupt reverse transformation upon unloading. This relatively abrupt nature of the transformation reflects the passage of the transformation front at the center of the specimen. It is important to note that no retained martensite was observed in the TC specimen after complete unloading.

Figure 2. XRD patterns obtained at the center of the specimen's strain gauge of the thermally cycled (TC) material at different strain values.
The synchrotron XRD measurements were performed in situ on the MPI beamline at ANKA, Karlsruhe Germany [Figure 1(b)]. A DEBEN leadscrew tensile rig (UK) equipped with a 5 kN loading shell was mounted on the diffractometer. The beam energy was 12 keV (corresponding wavelength of 1.033 Å) and the spot-size was 1 × 1 mm2 approximately. A NaI scintillation point detector was used. Monochromatization and horizontal focusing of the white X-ray beam originating from a 1.5 T magnet was achieved using a Si (111) double-crystal monochromator. An Rh-coated X-ray mirror focused the beam vertically.
A TC specimen was tensilely loaded with 5 μm s−1 displacement speed at RT. At the measured strain of 4.75%, a martensite nucleation event was apparent by a drop in the stress–strain curve (see Section I). Scanning of the maximum intensity of the (110) austenite reflection at this strain, along the strain gauge, indicated the nucleation of a martensite transformation band at one side of the specimen, as evident by a decrease of the intensity of the (110) austenite reflection. Therefore, grid diffraction measurements were performed, at this strain, to characterize the material in both the transformation band and its surrounding region. The grid measurements, covering an area of approximately 8.75 mm2, were undertaken with a step size of 0.25 mm along and perpendicular to the long axis of the strain gauge. Diffraction patterns were collected at each grid position in a 2θ range from 24° to 32° with a 0.01° stepsize and a 1 s counting time per step.
After completion of the grid measurements, the specimen was further loaded along a superelastic cycle (with 5 μm s−1 displacement speed) and additional measurements were performed, upon stopping the tensile test at specific strains, at the center of the specimen using a MarCCD 2D detector. Diffraction images were collected which included the 2θ range of 24°–32° with 60 s counting time per diffraction image. The diffraction images were processed and integrated using the software package FIT2D (Hammersley, Reference Hammersley1997). Profile fitting was performed as described above (Section II.B.) for the laboratory XRD measurements.
Phase fraction analysis was conducted using the integrated intensities of austenite and martensite reflections Eq. (2):
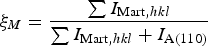 $$\xi _M = \displaystyle{{\sum {I_{{\rm Mart}\comma hkl} } } \over {\sum {I_{{\rm Mart}\comma hkl} } + I_{{\rm A}\lpar 110\rpar } }} $$
where I
A(110) is the integrated intensity of the (110) reflection of the austenite phase and I
Mart,hkl
is the integrated intensity of a (hkl) reflection of the martensite phase, at a given strain, at every measurement point of the grid. Equation (2) is an application of the relationship for quantitative phase analysis of allotropic/polymorphic forms of a substance (by assuming that the mass absorption is the same for both phases) given by Klug and Alexander (Reference Klug and Alexander1974). The intensities of the four strongest martensite reflections (110),
 ${\rm \lpar \overline{1}11\rpar }$
, (020), and (012) “PDF 03-065-0145 (ICDD, 1970)” were used for determining the martensite phase fraction, which in the diffraction pattern are close to the strongest austenite reflection (110) (see Figure 2). Summing the integrated intensities of these martensite reflections reduces the possible effect of texture on calculating the martensite phase fraction (Cullity and Stock, Reference Cullity and Stock2001). The initial sheet material exhibited a strong preferred orientation of austenite with the {110} lattice planes parallel to the surface. However, texture measurements at selected strains showed that the austenite texture does not change upon loading. That is why, the martensite fractions calculated by Eq. (1) or Eq. (2) are not affected by a change of austenite texture of the specimens.
${\rm \lpar \overline{1}11\rpar }$
, (020), and (012) “PDF 03-065-0145 (ICDD, 1970)” were used for determining the martensite phase fraction, which in the diffraction pattern are close to the strongest austenite reflection (110) (see Figure 2). Summing the integrated intensities of these martensite reflections reduces the possible effect of texture on calculating the martensite phase fraction (Cullity and Stock, Reference Cullity and Stock2001). The initial sheet material exhibited a strong preferred orientation of austenite with the {110} lattice planes parallel to the surface. However, texture measurements at selected strains showed that the austenite texture does not change upon loading. That is why, the martensite fractions calculated by Eq. (1) or Eq. (2) are not affected by a change of austenite texture of the specimens.
C. Size/strain line-broadening analysis
Single-line crystallite size/microstrain analysis was performed for the austenite phase using the (110) austenite reflection, as recorded in situ at the center of the specimen, for different values of applied strain. The crystallite size D 110 and the microstrain ε 110 along the normal to the specimen surface were determined following the method given by de Keijser et al. (Reference de Keijser, Langford, Mittemeijer and Vogels1982) and Delhez et al. (Reference Delhez, de Keijser and Mittemeijer1982). Corrections for the contribution to the integral breadth by the instrumental broadening were made using a LaB6 reference material (No. 660, National Institute of Standards and Technology, USA) (Mittemeijer and Welzel, Reference Mittemeijer and Welzel2012).
III. RESULTS AND DISCUSSION
A. Laboratory XRD results
The stress–strain curve and the evolution of martensite fraction (as a function of the position along the specimen's strain gauge, see Section II.A.) are shown in Figure 3. The TC material showed localized A–M transformation, that is, on both loading and unloading transformed bands appeared with their fronts propagating along the specimen. A single martensite transformation band formed, upon loading, at one side of the specimen, at approximately 2% tensile strain, that is, after an elastic straining region of the austenitic specimen where no martensite could be detected. With increasing the applied strain, no increase of the applied stress was observed (i.e., the “transformation plateau”) and the front of the transformation band propagated (the speed of propagation is approximately equal to the displacement speed, i.e., 1 μm s−1), without new bands nucleating. At approximately 7.5% tensile strain, the transformation had covered the whole strain gauge (Figure 3). During unloading the reverse transformation initiated at about 5.5% tensile strain at the edges of the specimen and (now) two transformation bands developed with fronts propagating toward the center of the specimen. Owing to poor spatial resolution, the lateral width of the specimen was completely embedded by the incident beam, an inclination of the transformation front (see Section II.B.) could not be observed and thus the fronts have been indicated perpendicular to the specimen-length axis in Figure 3.

Figure 3. (Color online) Stress–strain curve and evolution of martensite fraction in the thermally cycled (TC) specimen. The bars on the right-hand side of the graph represent graphically the results of the phase analysis along the specimen's strain gauge (see Section II.B.).
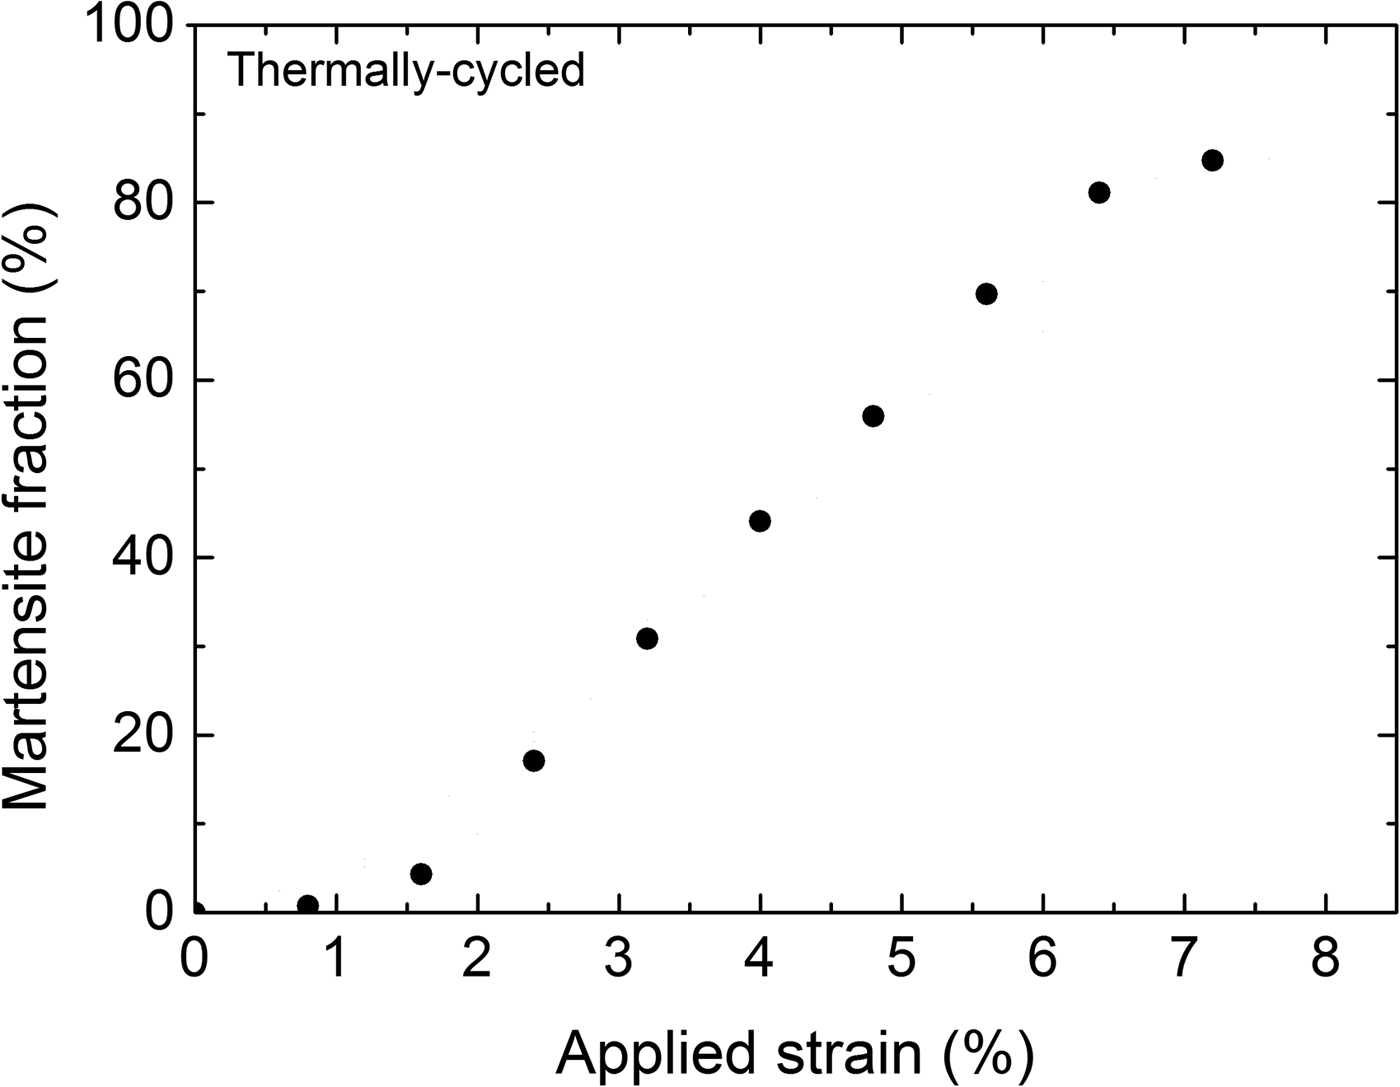
The evolution of the overall martensite fraction as a function of applied strain during loading of the TC specimen, calculated from Eq. (1), is shown in Figure 4. Evidently the dependence of the overall martensite fraction on the applied strain is approximately linear (in the range of 2–6% strain).

Figure 4. Evolution of the overall martensite fraction for the thermally cycled (TC) specimen upon loading.
In many phenomenological models for pseudoelasticity of SMAs, it has been postulated that the martensite fraction depends linearly on the transformation strain (e.g., Bouvet et al., Reference Bouvet, Calloch and Lexcellent2004; Taillard et al., Reference Taillard, Chirani, Calloch and Lexcellent2008). The present experimental result (Figure 4) provides conclusive support for such an assertion, whereas previous experimental studies are less convincing because the experiments were performed on powders (instead of bulk material) in compression (Vaidyanathan et al., Reference Vaidyanathan, Bourke and Dunand1999a, Reference Vaidyanathan, Bourke and Dunandb) or digital image correlation was used for the phase-transformation analysis which is an indirect method where phase fractions are inferred from strain values (Kim and Daly, Reference Kim and Daly2011).
Lattice strains (ε = [d − d R]/d R) in the direction perpendicular to the surface of the specimen for the austenite and martensite phases in Figure 5 were determined from the positions of the diffraction lines measured at the center of the strain gauge with respect to the reference lattice spacing (d R). The reference lattice spacings (d R) were determined as follows: for the austenite phase the reference lattice spacing was determined from the (110) reflection of the undeformed austenite, that is, as recorded before applying a load; for the martensite phase, the reference lattice spacing was determined for the (020) reflection as was recorded upon its first detection upon loading: d R(110) A = 2.1486 Å and d R(020) M = 2.0858 Å, respectively. Thus the obtained results are shown in Figure 5, incorporating the results obtained from both laboratory and synchrotron measurements. It follows that both austenite and martensite are subjected to compressive strain along the direction normal to the specimen surface, which is expected for uniaxial tensile loading. An abrupt change in the austenite strain of the TC specimen was observed when the transformation front reached the center of the specimen (at approximately 4.8% tensile strain). It is noted that the compressive lattice strain of the martensite formed in the TC specimen (Figure 5) does not change significantly with increasing the applied strain.
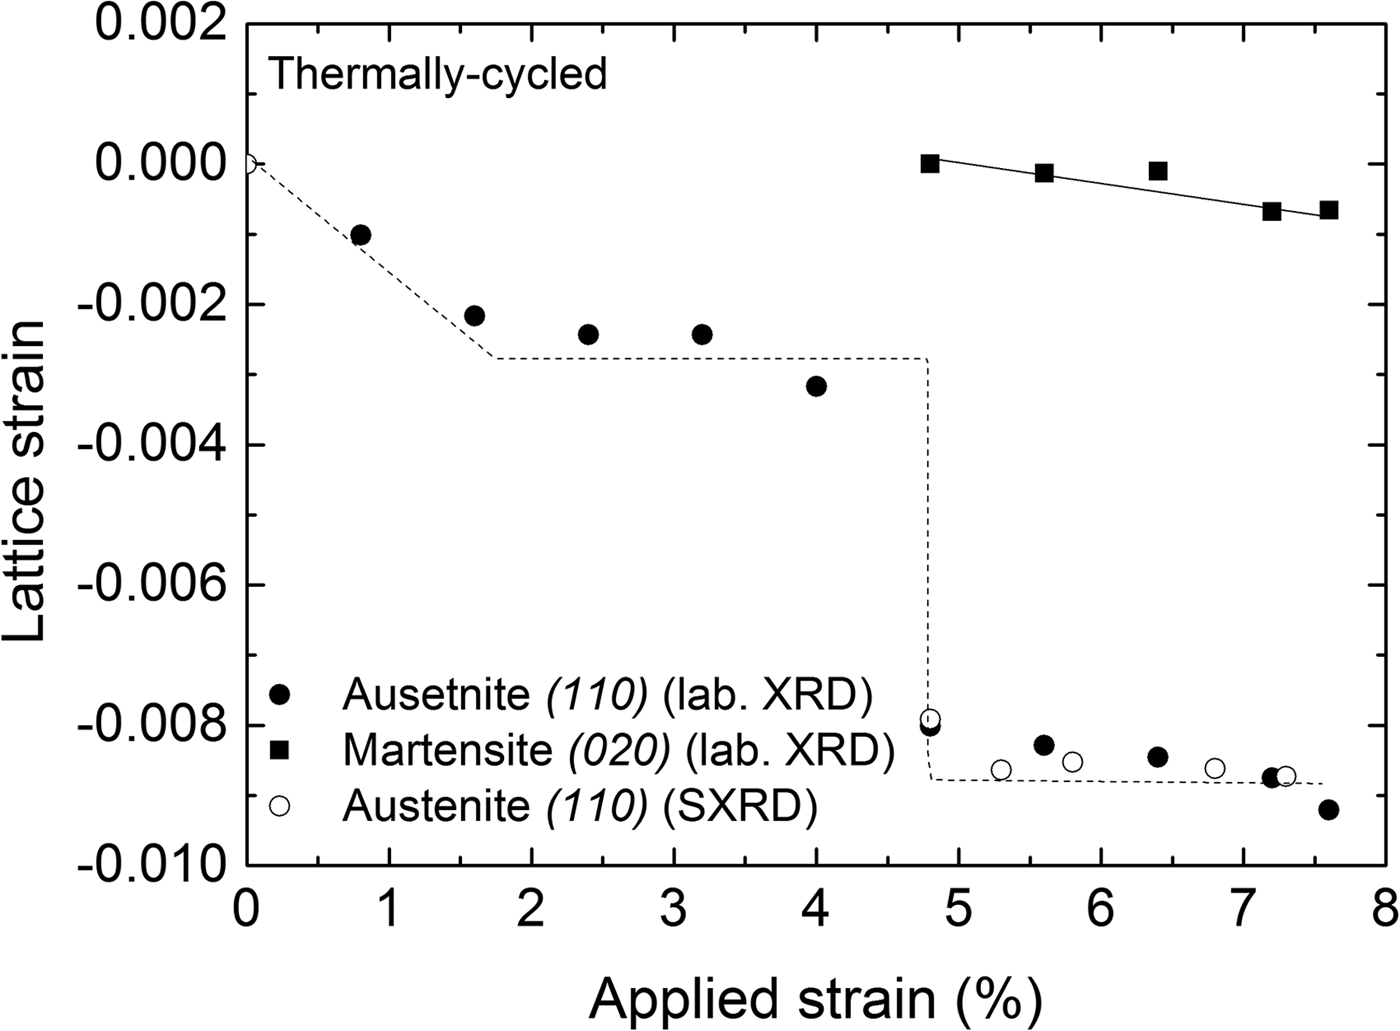
Figure 5. Lattice strain perpendicular to the specimen surface calculated from the (110)A and (020)M reflections recorded at the center of the specimen as a function of applied strain during loading of the thermally cycled (TC) material (laboratory XRD measurements); results for the austenite-lattice strain as obtained from synchrotron measurements have been included. The lines drawn are meant as guides for the eye.
B. Synchrotron XRD results
The relatively small beam-size of the MPI beamline at ANKA (1 × 1 mm2) allows a much higher spatial resolution than the laboratory XRD instrument. As a consequence, an inclination of the transformation band could be detected. Contour plots of the martensite fraction, austenite-lattice strains (perpendicular to the specimen surface) and full-width at half-maximum (FWHM) of the (110) austenite reflection, obtained from the grid measurements on the transformation band of the TC specimen, are shown in Figure 6. The inclination of the band in these plots, with respect to the length axis (tensile loading axis) of the specimen, is approximately 59°. This value of inclination angle is similar to a previously observed one (55°; by Shaw and Kyriakides, Reference Shaw and Kyriakides1997). Evidently, the transformation front is not sharp, but there is a gradual transition from the untransformed region to the maximum martensite fraction in the middle of the band. Such a gradual transition is also apparent from the FWHM and strain plots determined from the austenite (110) reflection [Figures 6(b) and 6(c)]. For the austenite-lattice strain calculation, the reference (110) austenite lattice spacing d R = 2.1263 Å was determined similarly to the method described in Section III.A., for the laboratory XRD measurements. The austenite lattice strain plot in Figure 6(b) shows that inside the transformation band the (retained) austenite phase is subjected to compressive strain in the direction perpendicular to the specimen surface, as expected for uniaxial tensile loading (see Section III.A.). It is therefore interesting to note that in the region adjacent to the transformation band, the lattice strain of the austenite in the direction perpendicular to specimen surface is tensile. Contrary to this observation, in other work (Schmahl et al., Reference Schmahl, Khalil-Allafi, Hasse, Wagner, Heckmann and Somsen2004) the untransformed austenite, adjacent to the transformation band, was observed to be subjected to compressive strain (perpendicular to the loading axis) of similar magnitude as the lattice strain of the retained austenite. A higher value of tensile lattice strain (parallel to the loading axis) of the austenite lying adjacent to the transformation front, as compared to the untransformed austenite away from the transformation front, was observed by Young et al. (Reference Young, Wagner, Frenzel, Schmahl and Eggeler2010) by use of neutron diffraction. The presence of highly strained austenite, adjacent to the transformation front, has been suggested to facilitate the A–M transformation (by reducing, locally, the critical stress for transformation) and thus to promote the propagation of transformation fronts over the nucleation of new transformation bands (Young et al., Reference Young, Wagner, Frenzel, Schmahl and Eggeler2010). Evidently, the present state of knowledge does not allow a detailed description of the state of strain in the (retained) austenite and its relation to the transformation mechanism.

Figure 6. (Color online) Martensite fraction, lattice macrostrain perpendicular to the specimen surface, and FWHM of the (110) austenite reflection recorded at and adjacent to a transformation band, shortly after its nucleation, at applied strain of 4.75%, in a thermally cycled (TC) material.
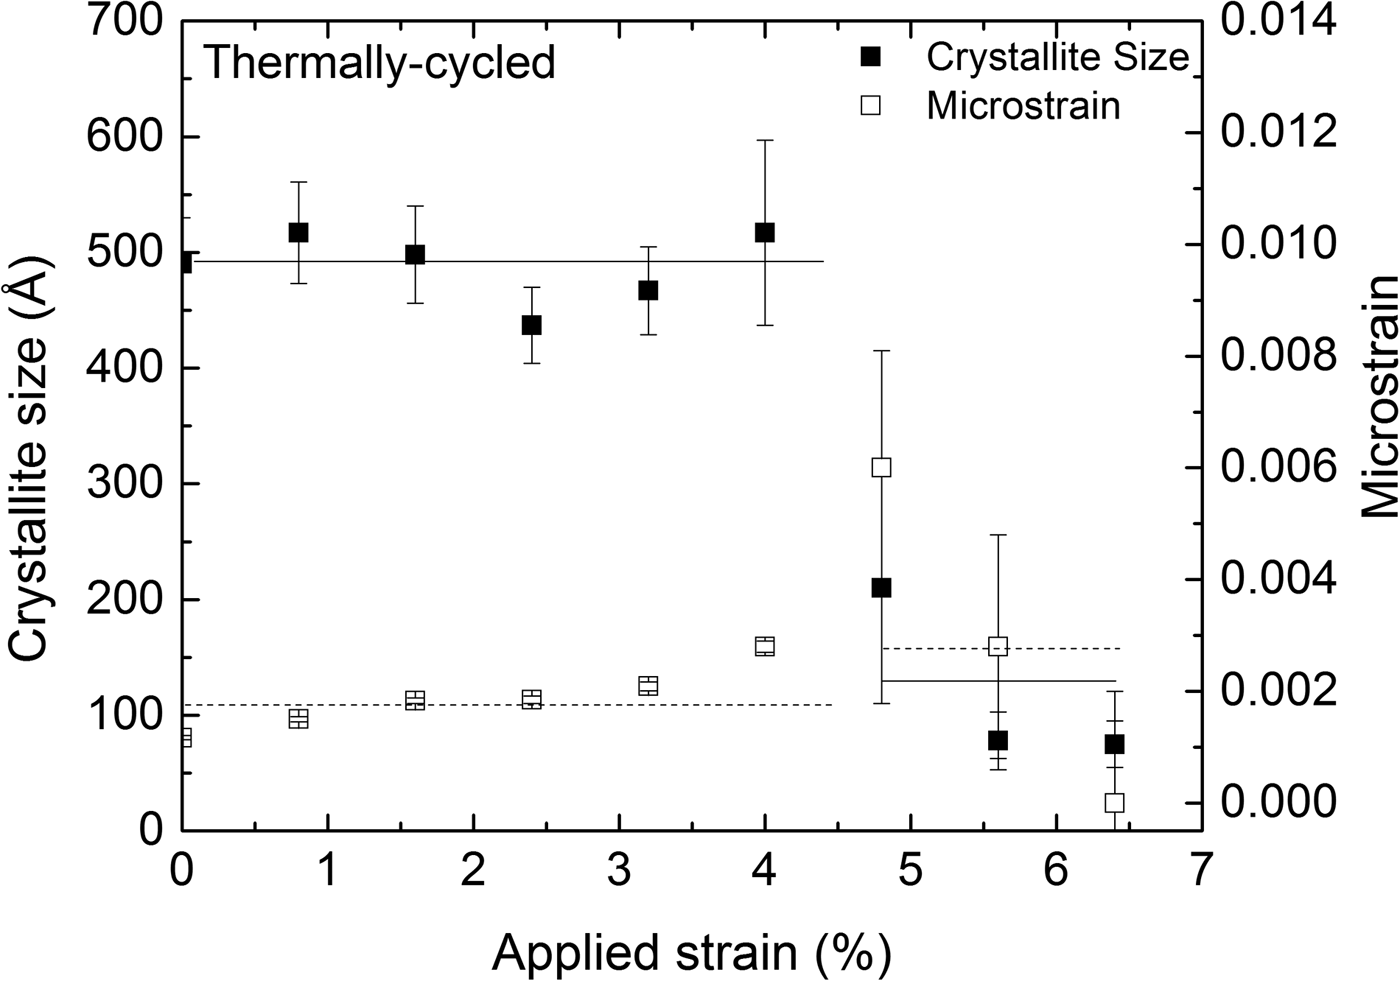
C. Crystallite size–microstrain analysis
The austenite (110) reflection originating from the retained austenite within the transformation band was significantly broader than the austenite (110) reflection obtained from the surrounding, as yet untransformed, material. This may be attributed to the combined effects of crystallite size and microstrain broadening for the retained austenite. The results of the corresponding size–strain analysis are shown in Figure 7, representing data obtained at the center of the strain gauge at different values of applied strain during loading. The transformation front reached the measurement position of the TC specimen at approximately 4.8% tensile strain. The retained austenite, within the transformation band, has significantly lower crystallite size and higher microstrain, compared to the untransformed austenite.

Figure 7. Crystallite size (solid squares) and microstrain (hollow squares), as determined from the (110) austenite reflection, at the center of the specimen's strain gauge as a function of applied strain for the thermally cycled (TC) specimen. The lines drawn are meant as guides for the eye.
IV. CONCLUSION
The TC NiTi SMAs exhibit localized transformation (Lüders-type transformation), as described in a quantitative way (Figure 3).
The overall martensite fraction depends linearly on the applied strain (Figure 4).
The martensite fraction decays, gradually going from within the transformation band toward the untransformed adjacent regions, indicating that the transformation front is not sharp. Relatively large strain gradients (from compressive to tensile nature) occur for the austenite grains across the transformation bands (Figure 6).
The retained austenite within the transformation band is in a highly deformed state, in contrast to the original state, as exhibited by crystallite and microstrain values (Figure 7).
ACKNOWLEDGMENTS
The authors acknowledge the beamtime granted on the MPI beamline at the Synchrotron Light Source ANKA, Karlsruhe Germany; Dr. P. Wochner (MPI-FKF) for his help in setting up the synchrotron experiment and Mr. Werner (MPI-IS) for performing the ICP-OES analysis.