


I. INTRODUCTION
With the advent of additive manufacturing (AM) technologies (Frazier, Reference Frazier2014), also known as three-dimensional printing, which is regarded as a cost- and time-effective manufacturing approach for producing parts with complicated shapes for automobiles, aerospace, medical tools, etc., a re-evaluation of the mechanical properties of AM-processed new materials is required. Stainless steel, which shows superior corrosion resistance and is applicable to various fields, would be a common material manufactured by a metal-based AM process. In particular, austenitic stainless steels such as 304 stainless steel, which have superior formability in spite of their high-alloy chemical composition, have again attracted singular attention from engineers and researchers. Their superior formability is attributed to the strain-induced martensitic transformation, where metastable austenite is transformed to the martensitic phase in order to accommodate plastic deformation (Godet and Jacques Reference Godet and Jacques2015; Shen et al., Reference Shen, Qiu, Sun, Zuo, Liawc and Raabe2015).
Previous research on strain-induced martensitic transformation in 304 stainless steel has often shown the existence of the ε phase (Olson and Cohen, Reference Olson and Cohen1975; Murr et al., Reference Murr, Staudhammer and Hecker1982; Spencer et al., Reference Spencer, Embury, Conlon, Veron and Brechet2004; Mertinger et al., Reference Mertinger, Nagy and Tranta2008). In 1961, J. A. Venables confirmed through a transmission electron microscope technique that the crystallographic relationships among the face-centered cubic (f.c.c.) γ phase, hexagonal close-packed (h.c.p.) ε phase, and body-centered cubic (b.c.c.) α martensitic phase were explainable by the Kurdjumov–Sachs mechanism and Burgers mechanism. He suggested that the ε phase was an intermediate phase between the α and γ phases and α martensite was nucleated from the ε phase (Venables, Reference Venables1962). Recently, Li et al. (Reference Li, Wang, Liu, An, Liu, Sua, Li and Liaw2014) and Hatano et al. (Reference Hatano, Kubota, Shobu and Mori2016) investigated deformed conventional 304 stainless steel by synchrotron X-ray analysis and clearly observed the diffraction peaks for the ε phase. Their work supported the idea that the ε phase plays the role of an intermediate state between the γ and α phases.
However, in order to capture the bulk microstructure, such as the volume fractions and texture, over several millimeters or centimeters, the previous approach, even with synchrotron X-ray analysis, is insufficient, especially for materials with coarse grains. As determined by the mean-linear-intercept method, the AM processed 304L stainless steel used in this study has an average grain size of 168 µm in the build direction, which is too large compared with the typical X-ray diffraction gauge volume of 1 mm3 for analysis of bulk properties. On the other hand, as the gauge volume in the neutron diffraction method is up to 1000 times larger, this approach is considered to be the better method for characterizing the bulk microstructure (Wenk, Reference Wenk1991).
In this study, we report the characterization of a cylinder-shaped AM processed 304 stainless steel projectile which was compressively deformed by the Taylor Anvil Gas Gun Test, leading to a huge strain gradient along the axis of the deformed cylinder (hereinafter referred to simply as the “cylinder axis” for convenience). Spatially resolved neutron diffraction measurements with Rietveld and single peak analysis were used to quantitatively evaluate the volume fractions of each of the phases along the cylinder axis as well as the residual strain and the crystallographic texture. Those techniques were complemented by electron back scatter diffraction (EBSD) analysis, thus providing a complete picture of the bulk microstructural evolution as a function of distance from the impact surface.
II. EXPERIMENTAL
A. Material preparation
Rod-shaped 304L austenitic stainless steels with a length of 38.1 mm and caliber of 7.62 mm were prepared by a laser-based AM process using a DMG Mori LASERTEC-65-3D. A laser beam with a wavelength of 1030 nm, spot diameter of 3 mm, and output of 2.0 kW was used to melt and fuse the powder raw material. Table I shows the chemical composition of the samples. One of the samples was then compressively deformed by a Taylor impact test. The as-built sample was accelerated to 235 m/s at room temperature inside a vacuum chamber (~10 torr) using the Taylor Anvil Gas Gun Facility at Los Alamos National Laboratory, and impacted an AF1410 high-strength steel anvil, causing a huge strain gradient inside the sample (Maudlin et al., Reference Maudlin, Bingert and Gray2003; Furmanski et al., Reference Furmanski, Trujillo, Martinez, Gray and Brown2012). The sample was deformed to a truncated-cone shape with a length of 30.6 mm (~20% reduction in length, Figure 1), and was confirmed not to be broken or cracked by visual inspection and microstructural observation using scanning electron microscope (SEM).
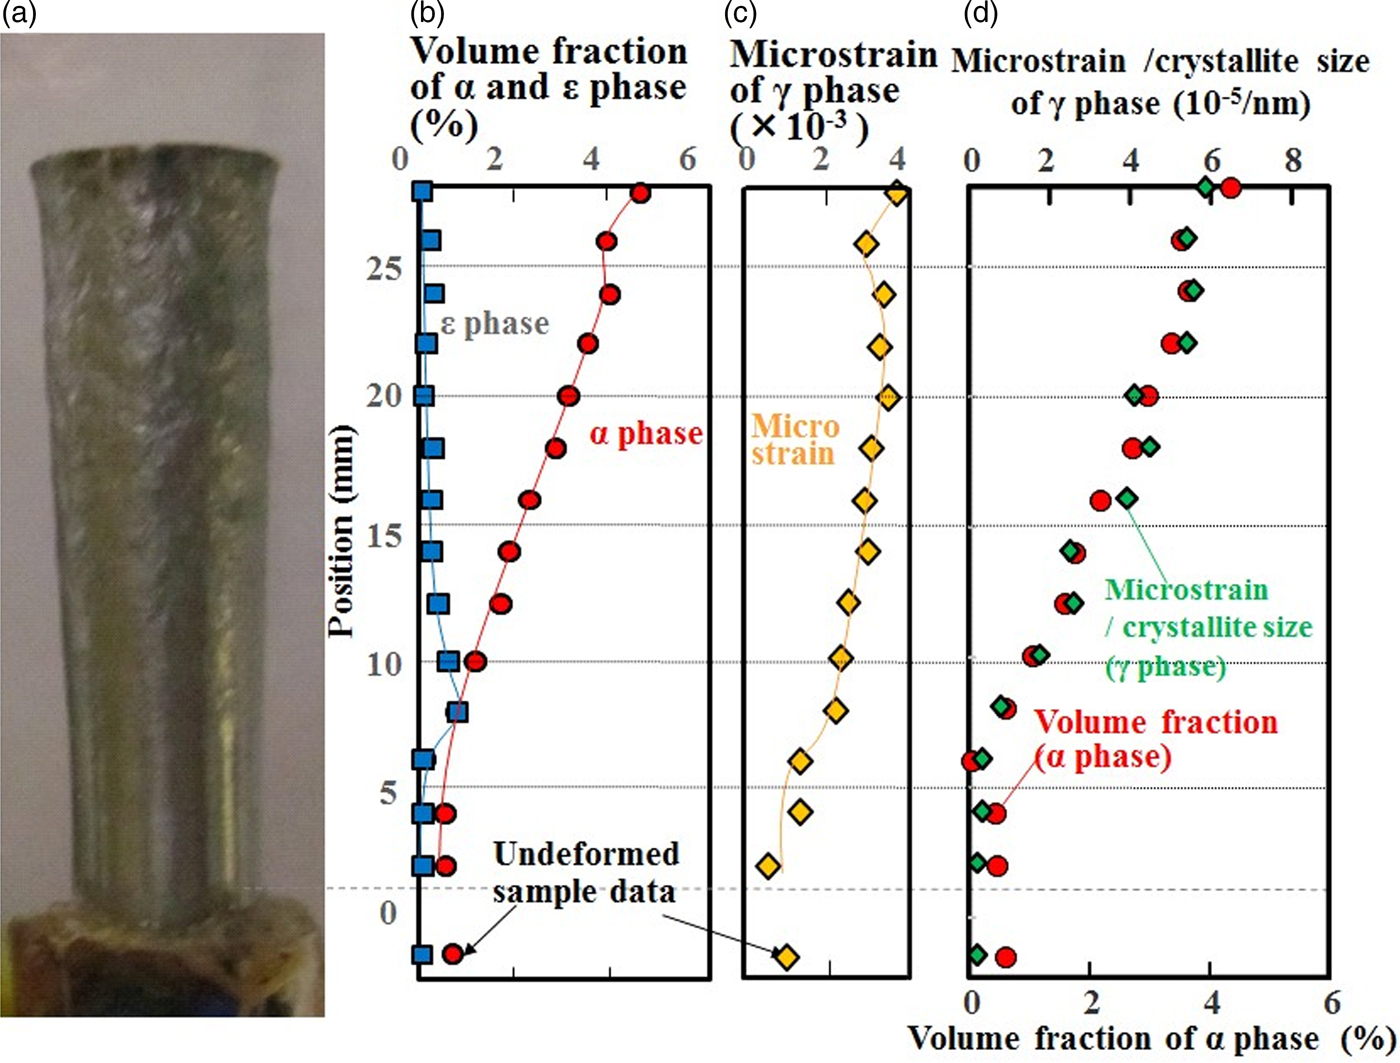
Figure 1. (Colour online) (a) Photograph of the deformed sample, (b) volume fractions of the α and ε phases, (c) microstrain of the γ phase, (d) volume fraction of the α phase and microstrain divided by crystallite size.
Table I. Composition of the specimen (mass %).

B. Neutron diffraction
Spatially resolved neutron diffraction spectra from an undeformed rod-shaped sample, i.e. an as-built sample, and the deformed truncated-cone-shaped sample were measured using HIgh Pressure Preferred Orientation time-of-flight diffractometer (HIPPO) (Wenk et al., Reference Wenk, Lutterotti and Vogel2003; Vogel et al., Reference Vogel, Hartig, Lutterotti, Von Dreele, Wenk and Williams2004) at the pulsed Los Alamos Neutron Science CEnter (LANSCE) neutron source. A schematic diagram of HIPPO is shown in Figure 2(a). The 10 mm diameter neutron beam spot at HIPPO was collimated by a 2 mm high slit (in the vertical direction) made from neutron-absorbing cadmium positioned ~5 cm from the sample. The 45 detector panels were arranged on five rings around the incident beam direction with diffraction angles of 40°, 60°, 90°, 120°, and 144°. Using these numerous detector panels and pulsed white neutron beams with a wide energy range, 1264 (hkl) diffraction peaks were measured simultaneously to determine the orientation distribution function. The diffraction data were obtained in the d-spacing range between 0.6 and 2.3 Å. To increase the pole figure (PF) coverage, measurements were performed with different sample orientations by rotating the sample around the vertical axis by 0°, 67.5°, and 90°.
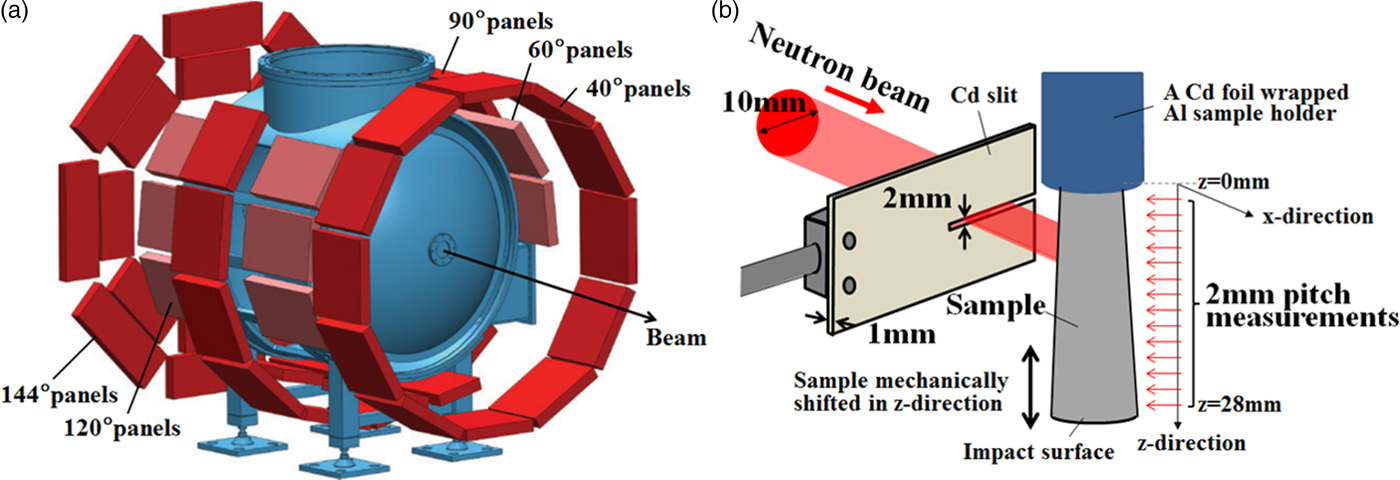
Figure 2. (Colour online) Schematic diagram of (a) HIPPO and (b) setup for neutron diffraction on HIPPO.
Figure 2(b) shows a schematic diagram of the neutron diffraction setup. Here the x-direction was set to correspond to the incident neutron beam direction and the z-direction is parallel to the cylinder axis. The z-value was set to 0 at the undeformed side of the sample.
The sample was moved along the cylinder axis in the vertical direction behind the slit with a robotic sample changer (Losko et al., Reference Losko, Vogel, Reiche and Nakotte2014). Thus, with the deformed sample, the neutron beam scanned the sample in 2 mm slices within the z range from 0 to 28 mm. With the undeformed sample, the z positions of 7, 19, and 31 mm were probed.
To investigate the in-plane (radial) strain distribution of the deformed sample, neutron diffraction spectra were measured using Spectrometer for Materials Research at Temperature and Stress diffractometer (SMARTS) (Bourke et al., Reference Bourke, Dunand and Ustundag2002) at LANSCE with a beam collimated to 2 × 2 mm2 and radial collimators, thus defining a ~2 × 2 × 2 mm3 gauge volume inside the sample. Three detector panels were used, these being located at +90°, −90°, and 155° from the incident beam.
Refinement of the measured spectra was performed by Rietveld (Reference Rietveld1969) analysis using the MAUD software (Lutterotti et al., Reference Lutterotti, Matthies and Wenk1997) and standard analysis procedures (Wenk et al., Reference Wenk, Lutterotti and Vogel2010). The best possible fit for the measured diffraction data was calculated from the adjusted texture, lattice parameters, phase scales and thermal motion parameters, background, instrumental profile parameters, etc. A root-mean-squared microstrain (hereinafter referred to as microstrain) analysis was also performed to describe peak broadening. Root-mean-squared microstrain is considered to be related to dislocation density (Williamson and Smallman, Reference Williamson and Smallman1956; Hordon and Averbach, Reference Hordon and Averbach1961) and was calculated from the peak width in MAUD using an isotropic size-strain model and the Delft line-broadening model (Berkum et al., Reference Berkum, Deles, de Keijser and Mittemeijer1996).
The Orientation Imaging Microscopy (OIM) analysis using the SEM (Philips XL-30) and EBSD patterns (TSL–OIM system) methods was performed following the neutron diffraction measurements, requiring destruction of the sample. A 20 kV electron beam was scanned with step sizes of <0.8 µm on the cut-and-polished material surface normal to the deformation axis. The crystallographic phase data for α and γ iron were cited from the TSL database, and that for the ε phase was estimated from the Rietveld refinement results of the neutron diffraction measurement. Although a material with a high content of carbon would display the body-centered tetragonal (b.c.t.) phase, the martensitic α phase was not distinguished from the b.c.c. α phase in this study.
III. RESULTS AND DISCUSSION
Figure 3 shows the analyzed volume fractions of the α phase, the microstrain of the γ phase, and the PFs of the γ phase of the undeformed sample. A small volume fraction of the α phase of about 1% was detected at all three measured points. Microstrain was almost the same along the build direction, although some materials manufactured by the laser melting-based AM method showed a large residual strain distribution along the material build direction (Brown et al., Reference Brown, Bernardin, Carpenter, Clausen, Spernjak and Thopmpson2016). A strong preference for the (200) poles along the build direction, with a pole density of around three multiples of the random distribution, was found in the undeformed material.

Figure 3. (Colour online) (a) Photograph of the undeformed sample, (b) volume fraction of the α phase and microstrain of the γ phase, (c) pole figures of the γ phase. The solid lines in (b) are visual guides. The error bars of the data in (b) are smaller than the symbol size.
Figure 4 shows the neutron diffraction spectra of the deformed and undeformed samples near the α(211) and α(110) diffraction planes integrated over all of the data detected by the HIPPO 90° panels for all three sample rotations. The background data were subtracted for clarity. The data measured at different positions at a pitch of 2 mm in the z-direction are all plotted. With the increase of z, i.e. approaching the impact location, the peak intensity of the α(211) and α(110) diffraction planes increased, and the peak positions of these α peaks shifted to a smaller lattice spacing. A detailed analysis of the strains in both phases, e.g. to determine if the strain in the α phase occurred by deformation after it was transformed from γ phase or whether the sample volumes of the α phase had already formed in the strained state, is forthcoming.

Figure 4. (Colour online) Integrated 90° HIPPO diffraction data of the undeformed and deformed samples. (a) Near the peak positions of the α(211) diffraction plane, (b) α(110) diffraction plane.
As can be seen in Figure 4(b), peaks at ~1.94 and 2.20 Å occurred at some z positions in the middle of the sample (between 10 and 14 mm) which cannot be indexed with the α or γ phase. These peaks were not found in the undeformed sample. A previous study (Li et al., Reference Li, Wang, Liu, An, Liu, Sua, Li and Liaw2014) suggested that the small peaks between the γ(200) and γ(111) diffraction planes, i.e. the peak around 1.94 Å, correspond to the (101) reflection of the ε phase. Although ε-Fe is a high-pressure phase and is not stable under ambient conditions, the peaks can be indexed with ε-Fe by extrapolating the lattice parameters in a high-pressure regime (Clendenen and Drickamer, Reference Clendenen and Drickamer1964). This extrapolation provided lattice parameters of 2.51 Å for the a-axis and 4.33 Å for the c-axis at ambient pressure, and the d-spacings of 1.94 Å for the ε(101) diffraction plane and 2.17 Å for the ε(002) diffraction plane, which correspond well with the observed peak positions in Figure 4(b). ε-Fe was also recognized in 18.5% Mn–iron (Parr, Reference Parr1952), where the d-spacings for the ε(101) and ε(002) diffraction planes were reported to be 1.93 and 2.04 Å, respectively.
Figure 1(a)–(c) shows the volume fractions of the α and ε phases and the microstrain of the γ phase as derived from the Rietveld analysis with MAUD including full texture refinement. Microstrain, as derived from the peak profile analysis with MAUD, continued to increase as z became larger except at 26 mm. The small drop of strain in the vicinity of the impact surface at the z-position of 26 mm is not an artifact, as it was reported to be a characteristic strain distribution of samples deformed by the Taylor impact test (Furmanski et al., Reference Furmanski, Trujillo, Martinez, Gray and Brown2012). This microstrain behavior suggested that plastic deformation started to affect the volume around 8 mm from the undeformed surface, and the amount of plastic deformation increased toward the impact surface. This is consistent with previous reports on conventional, non-AM and tensile-strained stainless steel (Hatano et al., Reference Hatano, Kubota, Shobu and Mori2016), suggesting that the martensitic transformation occurred in this AM 304 stainless steel as a result of severe plastic deformation. As for the microstrain of the α phase, the peak width analysis of the α diffraction peaks showed a constant amount of microstrain, indicating that the α grains were not plastically deformed after their formation.
The position dependence of the volume fraction of the α phase was similar to that of the microstrain of the γ phase: It began to increase at the z-position of 8 mm and showed a small drop at 26 mm. Figure 1(d) shows the position dependences of the volume fraction of the α phase and the value of microstrain divided by the crystallite size of the γ phase analyzed by MAUD. The value of microstrain divided by the crystallite size is related to the dislocation density (Smallman and Westmacott, Reference Smallman and Westmacott1957), which in turn is related to plastic strain and therefore explains the correlation with the volume fraction of the α phase. Therefore, we conclude that plastic strain induced the α phase transformation in this AM 304 stainless steel.
At the impact surface, i.e. the z position of 28 mm, the volume fraction of the α phase reached its maximum of 4.4%. On the other hand, the ε phase had its maximum volume fraction of 0.6% at the z position of 8 mm and decreased with increasing z. Because there was still a small amount of the α phase at the z position of 8 mm, it was assumed that the ε phase was transformed from the γ phase which was slightly deformed in the plastic region. The ε phase that formed during the early stages of plastic deformation transformed subsequently to α, which is consistent with the report that the ε phase is an intermediate phase by Venables (Reference Venables1962).
Using spatially resolved diffraction measurements on SMARTS, the radial variation of the aforementioned parameters was characterized. No variation was found, allowing us to conclude that the slices characterized by the HIPPO measurements can be assumed to be radially homogeneous.
Figure 5 shows the PFs of the deformed and undeformed samples with the cylinder axis in the center of the PFs. The γ texture changed from a preference of the (200) poles along the sample axis to a preference of the (220) poles along the cylinder axis, which is consistent with the texture evolution during uniaxial compression. The α texture was not strong compared with the γ phase, especially in the undeformed sample, but the preferences of the (200) and (222) poles became stronger near the impact surface in the deformed sample. These orientations were also reported as the result of a study of compressively deformed SUS321 stainless steel (Tiamiyu et al., Reference Tiamiyu, Eskandari, Nezakat, Wang, Szpunar and Odeshi2016). Although the (200) and (222) textures for α are known to be the stable orientations formed after compressive deformation in a b.c.c. material, we suggest that the α texture is because of transformation and not because of deformation: The similarities between the γ(111) and α(110) PFs and between the γ(220) and α(222) PFs, which become clearer as the z position increases and the α texture determination becomes more reliable because of the increased α volume fraction, are consistent with the Kurdjumov–Sachs orientation relationship ({111}γ//{011}α,  $\left\langle {\bar 1}01 \right\rangle \gamma //\left\langle {\bar 1}{\bar 1}1 \right\rangle \alpha$) between the γ and α phases. This suggests that the α phase, which was generated after deformation, was formed by transformation and not by deformation. There were also several similarities between the PFs of the ε and γ phases, ε(002) and γ(111), ε(110) and γ(220), which satisfy the Shoji–Nishiyama orientation relationship ({111}γ//{0001}ε,
  $\left\langle {\bar 1}01 \right\rangle \gamma //\left\langle 11{\bar 2}0 \right\rangle \varepsilon$). Therefore, the ε phase was also considered to be generated from deformed γ grains.
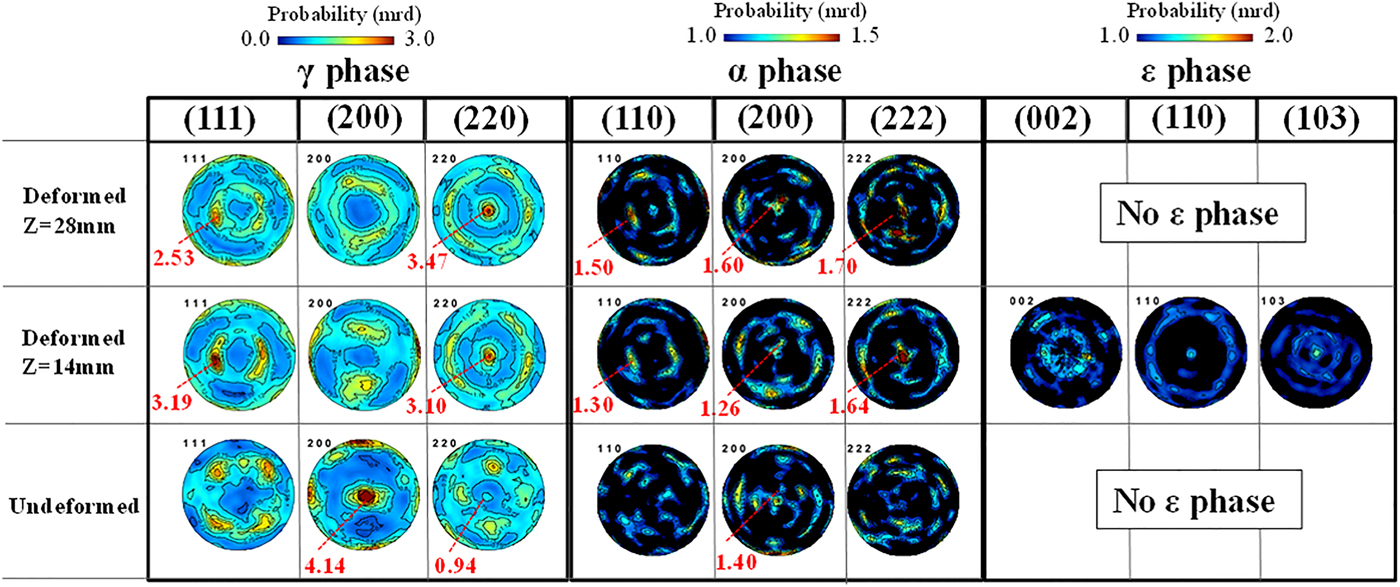
Figure 5. (Colour online) PFs of the γ, α, and ε phases in different deformation states.
Guided by the bulk neutron diffraction analysis, we were able to identify ε grains by destructive OIM analysis, as shown in Figure 6. We observed microstructures consistent with ε being an intermediate phase toward α. A detailed analysis of the OIM results gathered from various volumes of the sample will be reported in another publication.
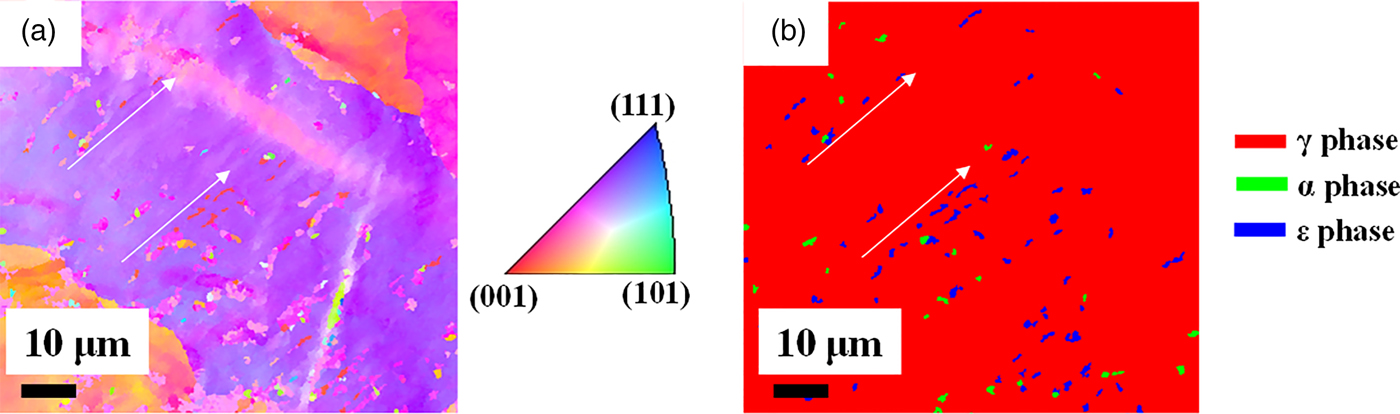
Figure 6. (Colour online) (a) EBSD inverse pole figure orientation map and (b) phase map of the deformed sample measured at the z position of 8 mm.
IV. CONCLUSIONS
A 304L stainless steel cylindrical projectile manufactured by an AM method and compressively deformed by a Taylor impact test showed microstructural variation along the axis of the deformed cylinder, but not in radial direction. The crystallographic phases and texture were investigated along the axis of the deformed cylinder and the radial axis by the neutron diffraction and EBSD methods. The following conclusions were obtained:
(1) The α phase increased as deformation became severe, and the maximum volume fraction of the α phase was 4.4% in the most severely deformed area near the impact surface.
(2) The ε phase was detected only in the least deformed area and showed a maximum volume fraction of 0.6%. This is consistent with the ε phase being an intermediate phase during the strain-induced formation of α.
(3) The strong γ texture of {200} parallel to the build direction was formed after manufacturing by the AM process. The texture changed to {220} parallel to the build direction and the axis of the deformed cylinder after deformation, which is consistent with plastic deformation of an f.c.c. material. The predominant textures of the α phase were {200} and {222} parallel to the axis of the deformed cylinder, which developed as the strain increased.
(4) The crystal structure data for the ε phase and the knowledge of where to look for the ε phase obtained from the neutron diffraction study of the deformed sample allowed us to observe the ε phase with OIM, underlining the complementarity of bulk characterization by neutron diffraction and in-plane scans with the EBSD method.
The results presented here show the power of neutron diffraction to characterize materials deformed by Taylor impact/gas gun. To the best of our knowledge, this is the first time this combination of characterization methods was applied to this type of sample. The ability to characterize the bulk microstructure of the entire sample makes it possible to derive trends in the microstructure evolution that will provide insights into the phase transformation mechanisms, which in turn will allow us to understand and ultimately predict this important type of deformation. The complete characterization of the entire sample provided essential guidance for the destructive analysis by EBSD, and in particular, it allowed us to identify the regions with the ε phase by EBSD in order to study the orientation relationships on the local level.
ACKNOWLEDGEMENT
S. Takajo gratefully acknowledges support from JFE Steel Corporation for his PhD thesis research at Los Alamos National Laboratory.


