


I. INTRODUCTION
A method was developed to detect 0.6% and quantitate 1–3% of the crystalline impurity 4-(5-cyclopentyloxy-carbonylamino-1-methyl-indol-3-ylmethyl)-3-methoxy-N-o-tolylsulfonylbenzamide hydrate (Figure 1) in a pharmaceutical tablet. The method was validated to show linearity, accuracy, precision, and ruggedness. Accuracy was determined from excipient mixtures and tablets spiked with crystalline impurity. Precision was assessed at either the quantitation or detection limits by measuring the instrument, method, and intermediate precisions. Ruggedness was assessed by evaluating repetitive assay, repetitive packing, sample packing, and sample stability.

Figure 1. Structure of the crystalline impurity 4-(5-cyclopentyloxy-carbonylamino-1-methyl-indol-3-ylmethyl)-3-methoxy-N-o-tolylsulfonylbenzamide hydrate.
II. EXPERIMENTAL
A. Samples
Standards contained the crystalline impurity in concentrations of 3, 2.5, 2, 1.5, 1, 0.8, 0.6, and 0% per 200 mg tablet. Standards were prepared in a mixture of United States Pharmacopeia/National Formulary (USP/NF) tablet excipients of croscarmellose sodium, lactose, magnesium stearate, microcrystalline cellulose, povidone, hydroxypropylmethylcellulose, and titanium dioxide. Standards were weighed to an accuracy of 0.01%. The particle size and distribution of excipient mixtures and active ingredient were not measured, but were constant owing to control of active ingredient and excipient manufacturer/grade. Tablet samples were ground in a mortar and pestle. Particle size for samples was controlled by reducing the particle size to ensure that the samples passed through a 355 µM sieve.
B. Specimen preparation
1. Sample packing
Samples were packed in sample cups (see Section II.E for description) using Techniques A and B given below. Technique A was used for sample packing unless Technique B was cited. Technique A was difficult to perform and was designed to preclude the formation of scraping lines across the sample surface. Technique B was easy to perform and would cause scraping lines across the sample surface.
a. Technique A
1 Pour a 100% sample with a slight excess into a sample cup. This was performed by filling the sample cup with powder with an additional 2 mm of powder over the cup edge.
2 Compress the sample by pressing downward with a 75 × 38 × 1 mm3 microscope slide onto the cup surface.
3 Rotate the microscope slide until the edges of the sample cup meet the glass slide. Ensure the microscope slide covers the sample surface entirely.
4 Remove the microscope slide by lifting the slide vertically and slowly.
b. Technique B
1 Pour a 100% sample with a slight excess into a sample cup. This was performed by filling the sample cup with powder with an additional 0.5 mm of powder over the cup edge.
2 Press and swirl the powder down into the sample cup using a 75 × 25 × 1 mm3 microscope slide.
3 Scrape off the surface with the microscope-slide edge to a level even with the sample-cup edge.
2. Sample-density studies
Over-packing samples (n = 9) were achieved by using a powder volume 50% greater than, and under-packing samples (n = 7) were achieved by using a powder volume 50% less than the amount specified using Technique A. In addition, two samples were under-packed by filling the sample cup to a powder level that was approximately 10% less than the volume needed to fill the sample cup.
C. Standard
Silicon 640B area at 28.44°2θ was used as an external standard to normalize X-ray intensity (counts per second (cps)) and area measurement (cps-degree) for the expected decrease in X-ray beam intensity with time. The area measurement (cps-degree) was determined by integrating the peak intensity (cps) against time measured using the Scintag Diffraction Management Software v. 3.40.
D. Data reduction
1. Normalized area
This method used an unresolved, doublet-peak response at about 10.87 and 11.18°2θ to measure the crystalline impurity. The 11.18°2θ peak was about three times more intense than the 10.87-°2θ peak when compared to peak height. Area was calculated by using a parabolic fit from 10.6 to 11.4°2θ. The narrow calculation range was selected to exclude baseline interference from the tablet excipients. Area was normalized as follows:
 $$\eqalign{& \hbox{Normalized area} = \hbox{sample area} (\hbox{cpm-deg})/ \hbox{silicon area} \cr & \quad ( \hbox{cpm-deg})}$$
2. Calibration plots
Each calibration plot was determined in triplicate, and was plotted using the mean-normalized area with an error bar representing the standard deviation.
E. Data collection
The data-collection parameters using a Scintag diffractometer model XDS2000 are given below:
Figure 2. Crystalline impurity calibration plots (n = 3).
F. Assay of the crystalline impurity content in excipient mixtures and tablets
The crystalline-impurity content of the excipient mixtures and tablets was measured by X-ray diffraction using the parameters in Sections II.A–II.E. The calibration curve was prepared in an excipient mixture and was used to determine the impurity content by linear-regression analysis. All results were expressed as a weight-to-weight percentage. Assay results from tablets were expressed as a percentage of the crystalline impurity based on a 200 mg tablet. Samples were analyzed in triplicate by three different operators.
III. RESULTS AND DISCUSSION
A. Calibration plots
1. Linearity and range
The calibration plot was determined on three occasions by using standards containing 0, 0.6, 0.8, 1, 1.5, 2, 2.5, and 3% crystalline impurity. The regression parameters were calculated and are reported in Table I. The three plots of the normalized area against crystalline impurity concentration gave a mean regression line with a correlation coefficient (r 2) of 0.996, a slope of 3.92 × 10⁻³, and an intercept of −2.43 × 10⁻⁴ as reported in Table I and shown in Figure 2.
Table I. Regression statistics for the crystalline impurity calibration plot.

The detection limit was selected considering that the 0.6% standard had a 3:1 signal-to-noise ratio; whereas the quantitation limit was selected considering that the 1% standard had a 5:1 signal-to-noise ratio. The detection and quantitation limits were selected based on the authors' assumption that the 3:1 and 5:1 signal-to-noise ratios were the minimum necessity to detect and quantitate the impurity.
2. Calibration-plot reproducibility
Calibration-plot reproducibility was determined by different operators. The results gave a linear plot that was reproducible within the 95% prediction limits for the slope and intercept as shown in Figure 3.
Figure 3. Calibration plots prepared and analyzed independently.
3. Calibration plot prepared in lactose monohydrate
Calibration standards were prepared in lactose monohydrate to assess if standards could be prepared in a single excipient and not in an excipient mixture. Lactose was selected since it can be obtained in high-grade analytical purity, and it would help to maintain some physical similarity between the standards and analytical samples. Lactose is one of the major ingredients in the pharmaceutical tablet. The tablet excipients are difficult to handle, mix, and pack individually into sample cups; thus, no individual excipient would be expected to prepare an ideal analytical sample.
The lactose-calibration plot is shown in Figure 4. The plot had a 0.970 correlation coefficient (r 2) that was inferior to the 0.996 correlation coefficient for the excipient mixture as reported in Table I. The inferior correlation coefficient from the lactose-calibration plot was attributed to the difficult packing characteristics of lactose. The slope from the lactose-calibration plot was found to be significantly lower than the slope from the excipient-calibration plot; thus, one would expect an increase in analytical inaccuracy. Considering the correlation coefficients and slopes reported in Table I, an excipient mixture would be preferred for preparing the calibration standards.
Figure 4. Crystalline impurity calibration plot prepared in lactose monohydrate.
B. Accuracy assessment using an excipient mixture spiked with crystalline impurity
Method accuracy was assessed from crystalline impurity measurement in an excipient mixture spiked at levels of 1.25, 1.75, 2.25, and 2.75%. Method accuracy results are reported in Table II. The crystalline impurity measured from individual samples ranged from 69.8 to 110.9%; however, most results ranged from 95 to 105%. Mean results ranged from 89.3 to 105.5%.
Table II. Accuracy measurements from samples of the crystalline impurity prepared in an excipient mixture.

*See text for packing technique.
The plot of measured against theoretical crystalline impurity content was found to have a slope of 1.07 ± 0.06, an intercept of −0.19 ± 0.12, and a correlation coefficient of 0.915. The slope and intercept were found to be near to one and zero showing that the method was accurate.
C. Accuracy assessment using tablets spiked with crystalline impurity
Method accuracy was assessed from crystalline impurity measurement in tablets spiked at levels of 1, 1.5, 2, and 2.5%. The data (adjusted for crystalline impurity loss; see next section) are reported in Table III. Crystalline impurity concentrations from individual samples ranged from 62.7 to 104.0%. Mean results ranged from 72.0 to 92.7%. The plot of measured against theoretical crystalline impurity content was found to have a slope of 0.92 ± 0.09, an intercept of −0.12 ± 0.17, and a correlation coefficient of 0.911. The slope and intercept were found to be near to one and zero showing that the method was accurate.
Table III. Accuracy measurements* from tablets spiked with crystalline impurity.

*See text for loss adjustment.
D. Low crystalline impurity measured in spiked tablets
Assay results showed that about half of the expected crystalline impurity content was measured from spiked tablets without adjustment for loss as reported in Table III. An investigation was conducted to discover the cause for the low crystalline impurity content.
1. Impurity morphology
Testing showed that the crystalline impurity used to prepare the spiked tablets was 98.5% pure chemical. The authors postulated that the crystalline impurity could have been a mixture of physical forms and not the pure hydrate. Thermogravimetric analysis was used to measure indirectly the crystalline impurity content by measuring the water-of-hydration. The crystalline impurity has been characterized as a hydrate with a water content of about 3.1%.
Thermogravimetric analysis shows that the crystalline impurity was 76% pure. An example of thermogram is shown in Figure 5. The morphology of the remaining 24% active ingredients was attributed to another physical form that was confirmed qualitatively by X-ray diffraction (spectrum not shown).
Figure 5. Thermogravimetric analysis of the crystalline impurity.
2. Crystalline-impurity dehydration
Tablet-batch records show that the tablet granulations were dried for 1 h in air with an inlet temperature near 70 °C; thus, the authors postulated that the crystalline impurity could have been lost by crystal dehydration. To estimate the crystalline impurity lost during the granulation-drying process, samples of the crystalline impurity were held at several isothermal temperatures from 50 to 75 °C for 1 h before determining the impurity content by thermogravimetric analysis. Results show that a critical temperature of 70 °C would cause loss of about 23% crystalline impurity in 1 h as shown in Figure 6. Crystalline-impurity dehydration (loss) increased significantly at temperature above 60 °C. The data in Figure 6 support the above-noted postulate.
Figure 6. Crystalline impurity loss by dehydration in one hour.
3. Correction for morphology and dehydration
Tablets were spiked with 24% less crystalline impurity because the impurity was only 76% pure in the physical form. About 23% crystalline impurity was lost during manufacture, because the high-inlet temperature during the granulation-drying process caused the impurity to dehydrate to another physical form. A correction of 1.5% was used to correct for chemical purity of 98.5%. Data corrected for lost crystalline impurity in spiked tablets are reported in Table III.
E. Method, instrument, and intermediate precisions
1. Method precision at the quantitation and detection limits
Method precision at the quantitation limit was assessed by analyzing six unique 1% crystalline impurity standards. The results reported in Table IV show that method precision was 6.1% based on the relative-standard deviation. The mean crystalline impurity value was 0.99% with a standard deviation of 0.06%.
Table IV. Method precision at the quantitation and detection limits (n = 6)

Method precision at the detection limit was assessed by analyzing six unique 0.6% crystalline impurity samples. The results reported in Table IV show that method precision was 7.4% based on the relative-standard deviation. The mean crystalline impurity value was 0.68% with a standard deviation of 0.05%.
2. Instrument precision at the quantitation limit
Instrument precision at the quantitation limit was assessed by preparing a 1% crystalline impurity sample and analyzing it six times. The precision was calculated from the area (cps-deg). The results reported in Table IV show that instrument precision was 5.8% based on the relative-standard deviation.
3. Intermediate precision at the quantitation limit
Intermediate precision was studied using the 1% crystalline impurity standard to measure long-term exposure of the analytical sample to the random and combined effect of operators, days, temperature, and humidity. To assess the intermediate precision, the mean, standard deviation, and relative-standard deviation were determined for the assay result, starting intensity, ending intensity, peak position, and peak intensity. The 11.18°2θ peak was used to assess position because of the signal-to-noise ratio of 5:1; whereas the 10.87°2θ peak was not used to assess position because of the lower signal-to-noise ratio of 3:1.
Intermediate-precision measurements show that the 1% crystalline impurity standard had a mean value of 0.95%, a standard deviation of 0.07%, and a relative-standard deviation of 7.3%. The 1% standard assayed within the range of 0.85–1.15% (±15%) for 52 of 61 assays performed over 6 months as reported in Table V. Nine samples were found to assay below 0.85%; whereas no sample was found to assay above 1.15%. Samples assaying below 0.85% were excluded from the intermediate-precision statistics because they showed a slight decrease in the peak, starting, and ending intensities. Further investigation for assay ruggedness (Section III.F) confirmed experimental error supporting exclusion of these data.
Table V. Intermediate precision at the quantitation limit (1% crystalline impurity).

F. Ruggedness: repetitive assay, repetitive packing, sample packing, and sample stability
1. Repetitive assay
Variability was observed in the assay of tablets spiked with 1, 1.5, 2, and 2.5% crystalline impurity. The variability was initially unexplained and an investigation was conducted by repeating the analyses, while observing the samples and their physical characteristics and by monitoring the ambient temperature and humidity. Repeated assay measurements show that the samples swelled at a relative humidity greater than 57%. Sample swelling caused the sample surface to go out of focus with the X-ray beam and cause false-low results. Swelling might occur considering that the povidone, lactose, and croscarmellose sodium excipients are hygroscopic and may swell.
Tablets spiked with 1, 1.5, 2, and 2.5% crystalline impurity were assayed five times. A summary of the five assays is given in Table VI. All data in this section are reported without correction for morphological purity and impurity loss by dehydration. The maximum expected impurity concentration would be about 50–55%.
Table VI. Five repetitive assays for crystalline impurity content in spiked tablets.

*Measured by a calibrated chart-recording thermometer/hygrometer about 10 feet away from the diffractometer.
#Assays occurred over 2 days hence a humidity range was given.
The samples were inspected after the fourth assay. Samples that gave a not detected response had swelled and had a convex and sometimes cracked appearance. These sample characteristics would have caused the sample surface to move out-of-focus with the X-ray beam path. An out-of-focus sample would be expected to give inaccurate results since the diffractometer uses a single-focus beam. The temperature was constant and was eliminated as a variable. The humidity during the five analyses varied greatly as reported in Table VI and shown in Figure 7. Non-detected results occurred when the relative humidity was greater than 57%. Inspection of the samples after the fifth assay performed at 50–55% relative humidity confirmed that samples with a flat surface gave accurate results.
Figure 7. Temperature and humidity measurements throughout a repetitive assay.
The spectrum of a swelled sample showing a significant peak shift to 11.30°2θ, and a level sample showing a negligible peak shift to 11.22°2θ are given in Figure 8. The peak shift to 11.30°2θ caused the response to shift partially beyond the 10.6–11.4°2θ calculation range causing the peak tail to be lost and rendering the computer software unable to discern the impurity response from the baseline. The starting, peak, and ending intensities decreased when the peaks shifted as reported in Table VII.
Figure 8. Crystalline impurity spectra showing a shifted-peak position at 11.3 °2Θ and a normal-peak position at 11.2 °2Θ.
Table VII. Normal- and shifted-peak position statistics.
2. Repetitive packing
Repetitive packing was assessed by packing a sample 1, 10, 20, and 30 times at 8 and 50% relative humidity (ambient). The repetitive packing was accomplished by packing a sample, emptying the sample from the sample cup, and re-packing the same sample using a new microscope slide. Figure 9 shows that the impurity concentration decreased linearly with increased packing repetitions at about 8% relative humidity; but, remained unaffected at 50% relative humidity. The authors postulated that the decrease in impurity concentration observed at 8% relative humidity was caused by impurity adhesion to the microscope slide because of static-charge induction. The drug substance is known to acquire a static charge at low humidity.
Figure 9. Packing replicates and crystalline impurity content.
3. Sample packing
a. Packing techniques A and B
The accuracy measurements reported in Table II show that operator 1 was able to obtain similar results using either packing Technique A or B. The authors concluded that scraping lines on the sample surface caused by using Technique B did not affect the assay results.
b. Sample density
The sample-packing process is operator dependent, and a variation in sample packing would be expected to give a variation in sample density and assay results. The authors postulated that over-packing a sample might increase the crystallite concentration and increase assay results, and the reverse would be expected for under-packing samples. Alternately, increasing the sample density in a homogeneous sample would be expected to decrease the transmitted-beam intensity and decrease assay results. The change in transmitted-beam intensity in a homogeneous sample, and its relationship to sample density can be described as (Cullity, Reference Cullity1978):
 $$I_x=I_{\rm o} {\rm e}^{ - \lpar u/\rho \rpar \rho x }\comma \;$$
where I x is the transmitted-beam intensity after passing through a thickness x, I o is the incident X-ray beam intensity, μ/ρ is the mass-absorption coefficient, and ρ is the density. The quantity μ/ρ is derived from the linear-absorption coefficient μ and the true density ρ.
In a pharmaceutical excipient mixture, the true density expressed in Eq. (2) can be replaced with the relative density (ρ r) which is described as:
 $$\rho _{{\rm r }}=\rho _{\rm b} /\rho _ \comma \;$$
where ρ b is the bulk density.
The relative density will increase to unity when all air spaces have been eliminated in a sample by compression forces (Lachman et al., Reference Lachman, Lieberman and Kanig1986). Small compression forces are used when packing an X-ray sample and air spaces would be expected to exist; thus, one can assume that ρ r will always be smaller than ρ. Air spaces would always be expected to exist from voids caused by dissimilar particle morphology in an excipient mixture. The use of the relative density in Eq. (2) shows that increasing and decreasing the sample density would decrease and increase assay results, respectively.
Over-packing a 1% crystalline impurity standard by two operators gave a mean result of 1.03 and 0.92% crystalline impurity as reported in Table VIII. Over-packing the 1% crystalline impurity standard to significantly affect sample density and alter assay results was not possible.
Figure 10. Crystalline impurity spectra following exposure to ambient conditions for 10 days.
Table VIII. Sample over-packing and under-packing statistics.

*Packed below sample-cup edge, see text.
Sample under-packing results are reported in Table VIII. Two-of-nine samples were found to assay below 0.85%; whereas no sample was found to assay above 1% crystalline impurity. The two samples assaying below 0.85% were samples that were filled 10% below the volume needed to fill the sample cup. The authors concluded that the values below 0.85% were caused by the sample being out-of-focus with the X-ray beam. Under-packing the 1% crystalline impurity standard to affect assay results was not possible unless the sample cup was under-filled. Under-packing results show a decreasing trend in impurity concentration (~10%); however, no corresponding trends were observed in the spectra.
G. Sample stability
Stability of the 1% crystalline impurity standard was assessed by exposing one sample continuously to random and combined temperature and humidity (ambient) conditions. A normal X-ray analysis could expose a sample to ambient conditions for as long as 3 days considering that the samples are assayed on a 32-position autosampler.
The 1% crystalline impurity standard gave good results (91–100%) after exposure to ambient temperature and humidity for three continuous days as reported in Table IX. At 6 and 10 days the assay results trended low to 0.84 and 0.66%. The temperature was constant at 22–23 °C while the daily-peak humidity ranged from 15 to 67%. The spectra are shown in Figure 10.
Table IX. 1% crystalline impurity results during a 10-day exposure to ambient conditions (one sample).
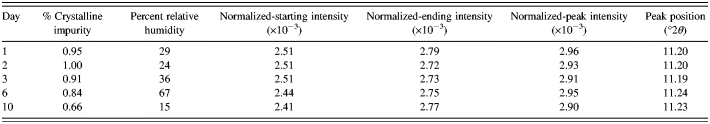
A positive-peak shift to 11.24°2θ and a decrease in starting intensity was observed in the 6- and 10-day assays after the sample was exposed to high humidity (67%). A slight decrease in starting intensity was observed. The relative humidity measurements reported in Table IX and the spectra shown in Figure 10 led the authors to assume that the lower assay results had been caused by displacement error when the sample swelled at high humidity (~67%). Quantitative accuracy was lost when the sample surface rose because a positive-peak shift moved the response slightly beyond the 10.6–11.4 °2θ calculation range.
IV. CONCLUSION
A method was developed to detect 0.6% and quantitate 1–3% of a crystalline impurity in a pharmaceutical tablet. The calibration curve was found to be linear with a correlation coefficient of 0.996. The method was found to be reproducible, accurate, precise, and rugged. The crystalline impurity could be measured with about 15% variability at the quantitation limit.
Measurement of the crystalline impurity content from spiked tablets was found to be 50% lower than expected. An investigation confirmed that the impurity was lost during the manufacturing process through a physical form change caused by the loss of the water-of-crystallization.
Repeated assays of tablets spiked with the crystalline impurity show that inaccuracy could occur by displacement error caused by sample swelling at humidity greater than 57%. Displacement error was confirmed by a positive increase in peak position.
Repetitive-packing studies show that the crystalline impurity was lost with increasing packing repetitions at low humidity. The impurity loss was attributed to impurity adhesion to the microscope slide caused by an induced-static charge at low humidity.
The intermediate precision studies show that the 1% crystalline impurity standard measured within ±15% in 52 of 61 assays when tested for 6 months.


