I. INTRODUCTION
The identification of crystalline phase(s) in a polycrystalline material (i.e., qualitative analysis) is one of the main applications of the powder diffraction technique and has gained increasing interest both scientific (e.g., in case of organic, inorganic chemistry, pharmaceutics, mineralogy, archeometry, and forensic science) and industrial (e.g., in case of check of drug quality and manufactoring process) (Whitfield and Mitchell, Reference Whitfield, Mitchell, Clearfield, Reibenspies and Bhuvanesh2008).
Hanawalt and Rinn, in a pioneering paper (Hanawalt and Rinn, Reference Hanawalt and Rinn1936), proposed the approach for qualitative analysis based on the classification and use of X-ray diffraction patterns. Successively, Hanawalt et al. (Reference Hanawalt, Rinn and Frevel1938) provided a reference library of diffraction patterns of known crystalline compounds, described in terms of a two-columns table of (d, I) values (where d is the interplanar spacing and I the peak intensity) associated with the experimental diffraction peaks, and grouped via the d value of the first strongest line. This library can be considered the precursor of the modern digitized databases. The Hanawalt search criterion was guided by the three strongest lines. The two milestone papers (Hanawalt and Rinn, Reference Hanawalt and Rinn1936; Hanawalt et al., Reference Hanawalt, Rinn and Frevel1938) opened the door to the traditional method based on the search–match approach inquiring a database of single-phase diffraction patterns (Jenkins and Snyder, Reference Jenkins and Snyder1996). The search–match method has been implemented in most of the qualitative phase analysis computer programs and requires to carry out the following steps:
-
(1) the reduction of the powder pattern into a “stick” pattern consisting of a set of (d, I) values associated with the experimental diffraction peaks;
-
(2) the search for the candidate database crystalline phase(s) according to a guiding criterion;
-
(3) the match between the reduced experimental pattern and the database reference pattern(s); and
-
(4) the identification and ranking of the most probable crystalline phase(s), belonging to the set of the matched ones, by adoption of a mathematical tool, i.e., a figure of merit (FoM), able to assess the reliability of the match.
A qualitative phase analysis based on “stick” patterns has (i) the advantage of limiting the necessary amount of data of the reference database (whose content can consist of hundreds of thousands stick patterns, stored in the database entries), and, consequently, the advantage of enabling a quick database interrogation and the attainment of reliable results in small CPU time; (ii) the disadvantage of neglecting some information present in the full diffraction pattern.
More recently, the increasing computing power has allowed us to adopt an alternative approach, which uses a database consisting of single-phase full diffraction patterns (Gilmore et al., Reference Gilmore, Barr and Paisley2004).
Many computer programs based on the traditional search–match approach exist. After a wide spread effort beginning in the 1980s today most codes are commercial [e.g., The HighScore suite (PANalytical, 2017), PDXL (Rigaku, 2017), DIFFRAC.EVA (Bruker, 2017), Match! (Crystal Impact, 2017)]. An exception is the freely available QUALX2.0. This latter code is the subject of this paper.
QUALX2.0, the new version of the freely available qualitative phase analysis software QUALX (Altomare et al., Reference Altomare, Cuocci, Giacovazzo, Moliterni and Rizzi2008), can interrogate two databases of stick patterns, one of them is commercial, PDF-2 (ICDD, 2003), the second one is freely available, POW_COD (Altomare et al., Reference Altomare, Corriero, Cuocci, Falcicchio, Moliterni and Rizzi2015). The crystallographic information of each POW_COD entry is generated from the CIF files of the Crystallography Open Database (COD) (Gražulis et al., Reference Gražulis, Chateigner, Downs, Yokochi, Quirós, Lutterotti, Manakova, Butkus, Moeck and Le Bail2009, Reference Gražulis, Daškevič, Merkys, Chateigner, Lutterotti, Quirós, Serebryanaya, Moeck, Downs and Le Bail2012), a collection of crystal structures of inorganic, metal–organic, organic compounds and minerals, freely downloadable by Web and continuously growing thanks to the efforts of an international team of researchers (the current number of COD entries is larger than 372.000).
The commercial computer programs are also able to inquire databases built from COD. Their comparison with QUALX2.0 points out that they use updated commercial databases, containing a very large number of entries [e.g., the ICDD database PDF-2, PDF-4+, PDF-4/minerals, and PDF-4/organics (http://www.icdd.com/); databases based on the crystal structures in the ICSD database (FIZ Karlsruhe, 2017), in the LPF database (Villars et al., Reference Villars, Onodera and Iwata1998), etc.]. QUALX2.0 is able to carry out the RIR-based semi-quantitative analysis only, while some commercial software is devoted to quantitative analysis (e.g., HighScore Plus, PDXL, and Match!) and some other also to cluster analysis (e.g., HighScore Plus, DIFFRAC.EVA, and PDXL).
The future of QUALX2.0 is addressed to improve both the features of the databases and the graphical and computational tools. In this project, it is not excluded the possibility to use versions of commercial databases updated.
QUALX2.0 has been recently enriched by the introduction of new tools enabling the use of restraints on symmetry (space group, crystal system), unit-cell parameters, unit-cell volume, crystal properties (calculated density, measured density, and crystal color). Accordingly, the possibility of applying the new restraints conditions required a suitable modification of POW_COD in order to optimize its structure for storing crystallographic information and making its interrogation quick and efficient.
In this paper, a description of the main features of the current version of QUALX2.0 together with an example of application is reported.
II. MAIN FEATURES OF QUALX2.0
QUALX2.0 is able to carry out the qualitative phase analysis in a highly automatic and user friendly way. It is supported by an effective graphic interface that enables the user to easily change its default choices and strategies.
Once the powder diffraction pattern has been imported and visualized by QUALX2.0, the user can decide to continue:
-
(1) by default run, i.e., by carrying out all the steps leading to the phase identification (data processing, background calculation and subtraction, peak detection, and search–match are, in sequence, automatically carried out);
-
(2) via interactive approaches; this is the obliged choice when the user wants:
-
(a) to modify the experimental 2θ range, e.g., by excluding the extreme 2θ region of the diffraction pattern;
-
(b) to change the default settings of data processing and/or background calculation and/or peak location and/or search–match steps.
In particular, the following interactive approaches can be executed by graphic interface:
-
– Kα 2 stripping;
-
– Smoothing of the experimental pattern by the Savitzky–Golay filter method (Savitzky and Golay, Reference Savitzky and Golay1964);
-
– 2θ-zero shift correction by the reflection-pair method (Dong et al., Reference Dong, Wu and Chen1999);
-
– Change of the automatically selected background points (by adding and/or deleting points);
-
– Choice of the background function best fitting the selected background points. The default function is the Chebyshev polynomial. The other possible background functions are: (i) cubic-spline, (ii) Bézier spline, and (iii) filter function based on the Brückner algorithm (Brückner, Reference Brückner2000);
-
– Selection of the experimental diffraction peaks [and corrisponding (d, I) values] by modifying the results and/or the conditions of the automatic peak-search;
-
– Set of the search–match conditions (see Figure 1, showing the dialogue window managing the search–match conditions). At the end of the search–match step a list of plausible database crystalline phases are ranked according to the decreasing values of a FoM. The FoM includes four contributions, three of them suitably weighted, according to the following formula:
(1)where FoM θ takes into account the average difference between the 2θ values of the observed and matched database peaks; FoM I is related to the average difference between the intensity values of the observed and matched database peaks; FoMph depends on the percentage of the matched experimental peaks and on their intensity; and FoMdb depends on the percentage of the matched database peaks and on their intensity. $${\rm FoM} = \sqrt {\displaystyle{{{\rm FoM}_{{\rm db}} \cdot (w_\theta \cdot {\rm FoM}_\theta + w_I \cdot {\rm FoM}_I + w_{{\rm ph}} \cdot {\rm FoM}_{{\rm ph}} {\rm )}} \over {w_\theta + w_I + w_{{\rm ph}}}}}, $$

(For more details see the software documentation).

Figure 1. QUALX2.0 dialogue window managing the search–match conditions.
The default value of the weights w θ , w I , and w ph is 0.5, but it can be changed by the dialogue window in Figure 1 (via the “2θ”, “Intensity” and “Phases” trackbars) (see the software documentation for the meaning of graphical options shown in Figure 1).
In addition, the graphic interface enables the user to:
-
• easily select the reference database (PDF-2 or POW_COD) to be inquired at the search–match step;
-
• visualize the main crystallographic information stored in each database entry; and
-
• apply restraints guiding the search–match.
The use of restraints can greatly help to successfully identify the crystalline phase(s) in a sample. Particularly, this is true for mixtures in which the number of component phases is large and/or the degree of peak overlap is strong and/or peaks are broad,…. In these cases the accuracy of the experimental (d, I) values can be low and FoM, being based on (d, I), is not able to select the correct phases among the most probable ones. Consequently, it could be difficult for the user to recognize the correct phases by a “blind” search. The use of restraints, when available, can be crucial in pivoting towards to the correct phase(s) identification.
The awareness of the usefulness of restraints convinced us to implement these tools in QUALX2.0.
The current version of QUALX2.0 is able to use the following kinds of restraints:
-
(a) on chemical composition, chemical name, type of compound (organic, inorganic, etc.), database entry number(s);
-
(b) on symmetry (space group, crystal system), unit-cell parameters, unit-cell volume, crystal properties (calculated density, measured density, and crystal color). Their implementation required to suitably modify the POW_COD database to manage all the information of interest for the restraints and make effective the restraints-guided search–match approach.
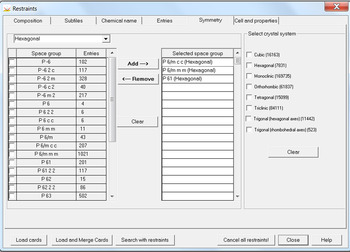
An example of QUALX2.0 dialogue windows managing restraints on symmetry is shown in Figure 2.

Figure 2. QUALX2.0 dialogue window managing restraints on symmetry.
An example of application of restraints on chemical composition is described in Section III.
In case of restraints on symmetry, the graphic interface enables to select one or more crystal systems and/or one or more space groups (see Figure 2). For each crystal system the number in parenthesis on the right part of the dialogue window indicates the total number of POW_COD database entries corresponding to the crystal structures whose crystal system is that one. In the left part of the dialogue window a list of all possible space groups present in the POW_COD entries is provided together with a number (supplied in the column “Entries”) that indicates the total number of POW_COD entries corresponding to the crystal structures whose space group is that one. The dialogue window enables the user to select one or more space groups corresponding to one crystal system (e.g., see Figure 2 where the space groups P6/mcc, P6/mmm, and P61, corresponding to the selected hexagonal crystal system, have been chosen).
The restraints dialogue windows enable also the user to carry out an easy and useful inspection of the content of the database entries satisfying the conditions stated by restraints. For example, in case of the use of restraints on symmetry, if the three space groups P6/mcc, P6/mmm, and P61 are selected and the button “Load cards” is pressed (see Figure 2), instead of carrying out a restraints-guided search (that is activated by the button “Search with restraints”), QUALX2.0 provides, in the results list, all the 1429 POW_COD entries corresponding to crystal structures whose space group is one of the three chosen space groups.
III. APPLICATION AND RESULTS
An example of interactive approach application of QUALX2.0 is here described. The mixture under study (hereinafter mentioned by the code name TILE) belongs to a set of Italian stoneware ceramics with large amorphous content, recently characterized via qualitative and quantitative phase analysis by Gualtieri and co-workers (Gualtieri et al., Reference Gualtieri, Riva, Bresciani, Maretti, Tamburini and Viani2014). Stoneware ceramics are obtained by firing at high temperature (about 1463–1498 K) a mixture of natural raw materials (i.e., kaolinite–illite-rich clays, sodium and potassium feldspars, and quartz-rich sand). The thermic treatment and the consequent melting of feldspars are responsible for the formation of a glassy phase (more than 50%); the rest of component phases in the final product are quartz, feldspars, and mullite; this last one is generated during the firing process (Lassinantti Gualtieri et al., Reference Lassinantti Gualtieri, Romagnoli and Gualtieri2011; Gualtieri et al., Reference Gualtieri, Riva, Bresciani, Maretti, Tamburini and Viani2014). TILE is a mixture containing 10 wt% of an internal standard (pure annealed commercial rutile, added to the sample in order to estimate the amorphous fraction) and 90% of sample. The authors obtained the following results concerning the sample: it contains an amorphous phase (63.4 wt%), quartz (the majority crystalline phase, 25.8 wt%), and two secondary crystalline phases, mullite (6.9 wt%), and albite (3.9 wt%).
The high fraction of amorphous component has made not straightforward the characterization of the crystalline phases by QUALX2.0. In order to correctly identify all the crystalline phases, not default strategies have been applied and prior information exploited.
The X-ray powder diffraction pattern consists of laboratory data (diffractometer setup: Bragg Brentano θ–2θ; CuKα radiation; experimental 2θ range: 3.0°–70.0°, 2θ step: 0.02°).
Once the background contribution has been automatically calculated and subtracted and K α 2 stripping executed, the following steps have been, in sequence, carried out:
-
(a) The automatic peak selection process has been improved (being the experimental pattern a bit noisy, some peaks have been added, and some other ones deleted);
-
(b) The search–match step. Owing to the nature of the sample, the subset of the POW_COD database concerning inorganic compounds only (POW_COD_INO) has been queried. Since information on chemical composition of the sample, obtained by XRF analysis, has been provided by Gualtieri et al. (Reference Gualtieri, Riva, Bresciani, Maretti, Tamburini and Viani2014), restraints on the following chemical species: Si, O, Al, Ti, Fe, Ca, Mg, K, and Na, can be applied (see Figure 3). The largest FoM plausible phases, obtained by the search–match step using restraints on chemical composition, have been checked by careful visual inspection. The best agreement with the selected experimental peaks corresponds to: (1) quartz (entry # 00-901-3321); (2) rutile (entry # 00-901-5662); and (3) albite (entry # 00-900-2201). If these three phases are in turn graphically accepted, one low-intensity experimental peak is still unmatched (its 2θ position is 16.40°; it is marked by a star in Figure 4). In order to identify the additional crystalline phase which can be responsible for the presence of the unmatched peak, the use of restraints can be combined with other non-standard strategies. Among them one possibility is to deactivate the default “Check strongest peaks” condition (see Figure 1), according to which a database crystalline phase is considered plausible if at least the three most intense entry lines are matched by the experimental peaks. If we do that choice, the search–match with restraints is successful, providing, in sequence, the following correct phases: (1) quartz (entry # 00-901-3321); (2) rutile (entry # 00-901-5662); (3) albite (entry # 00-900-2201); and (4) mullite (entry # 00-900-1322). The unmatched peak can be ascribed to reflection (1 1 0) of mullite. In an a posteriori analysis we have verified that the standard search–match prevents the identification of mullite because one of its three most intense peaks (positioned at around 2θ = 25.99°) cannot be detected in the experimental pattern because hidden by the low 2θ tail of the peak of quartz, positioned at 2θ = 26.64°.

Figure 3. QUALX2.0 dialogue window managing restraints on chemical composition.

Figure 4. TILE mixture: zoom of the X-ray powder diffraction pattern. At the bottom the vertical bars indicate the selected experimental peaks and the reflection 2θ positions in case of the database entries of quartz, rutile, and albite. The star symbol marks the unmatched peak.
IV. CONCLUSIONS
QUALX2.0, the heir of the qualitative phase analysis program QUALX, is a user-friendly software based on the traditional search–match approach and is able to carry out the phase identification process by inquiring the commercial database PDF-2 and the freely available database POW_COD.
QUALX2.0, in continuous evolution, has been recently improved by the introduction of new graphic and computing tools concerning the use of restraints and enabling to enhance its potentialities and performances. Accordingly, POW_COD has been recently modified to make effective and fast the restraints-guided search.
V. PROGRAM AND DATABASE AVAILABILITY
QUALX2.0, POW_COD, and POW_COD_INO can be freely downloaded (for academic and non-profit institutions), after user registration at http://www.ba.ic.cnr.it/user/register.
QUALX2.0 runs under the Windows operating system. It is written in standard Fortran and C++, and the output file is written in HTML format. Documentation about the program and the database installation is provided in PDF format; the help-on-line manual is also available.
ACKNOWLEDGEMENTS
The authors thank Dr. Caterina Chiarella and Dr. Francesco Baldassarre of the Institute of Crystallography (Bari, Italy) for technical support, and Prof. A. F. Gualtieri of University of Modena and Reggio Emilia (Italy) for providing us the X-ray powder diffraction data of TILE mixture.