


I. INTRODUCTION
Vanadium is a highly redox-active element. The redox activity of vanadium is key to the function of vanadium redox flow batteries (VRFBs), a promising candidate to store energy from renewable sources. In VRFBs, vanadium occurs in the oxidation states II, III, IV, and V. At a state of charge (SOC) of about 50%, the VO2+ (IV) and  ${{\rm VO}_2}^+$ (V) species form a
  ${{\rm V}_2{\rm O}_3}^{3+}$ dimer. The species are converted into each other during the operation of the battery. Unfortunately, a major capacity decay is correlated to the unwanted transport of the V species through the separator an ionomeric membrane. Ion transport through the nanoscopic water system of these two-faced materials (having hydrophilic and hydrophobic characteristic), in general, is lacking understanding. Careful characterization of the V concentration and species is key to a better understanding of this phenomenon.
In the positive electrolyte of the VRFB, VO2+ is oxidized to  ${{\rm VO}_2}^+$ during charging, and in the negative electrolyte, V3+ is reduced to V2+. Besides the dissolved vanadium ions, the electrolyte consists of 4 M sulfuric acid. V speciation of the electrolyte maybe performed by redox titration, speciation of V species inside the membranes is more challenging. X-ray absorption near-edge structure analysis (XANES) could be the ideal tool to probe this multiphase material in situ, as the XANES information is representative for the entire sample depth and is sensitive to the dissolved species. Usually, XANES is performed at synchrotron radiation facilities. This is definitely reasonable when spatially resolved studies on vanadium species are required. However, series measurements and analysis of elemental gradients of higher concentrations, as well as the option to have students experiment more freely with the technique, are not possible with synchrotron sources, as beamtime is usually not granted for these kinds of projects.
New developments on micro focusing X-ray sources and optics have made XANES attractive for laboratory use. Laboratory-based XANES has just recently become commercially available with very good X-ray emission spectroscopy (XES) capabilities and acceptable XANES performance. The activity of Gerald Seidler and his group at the University of Washington (UW), Seattle, resulted in the start-up company EasyXAFS providing XANES and XES capabilities and a large-scale two beamline instrument at the UW Clean Energy Institute (CEI) (Seidler et al., Reference Seidler, Mortensen, Remesnik, Pacold, Ball, Barry, Styczinski and Hoidn2014, Reference Seidler, Mortensen, Ditter, Ball and Remesnik2016). The EasyXAFS instrument uses a selection of spherically bent crystal analyzers (SBCA) and a one element SDD detector, which requires an exchange of optics when switching between elements. A different concept for XES and XANES has been realized successfully by Wolfgang Malzer and Birgit Kanngiesser at the Berlin University of Technology (TU Berlin). They built a major research instrumentation XES at the Max Planck Institute Muehlheim designed especially for catalysis research (Malzer et al., Reference Malzer, Grötzsch, Gnewkow, Schlesiger, Urban, Debeer and Kanngießer2016). A prototype XANES spectrometer is also available at the TU Berlin (Schlesiger et al., Reference Schlesiger, Anklamm, Stiel, Malzer and Kanngießer2015). The instrument developed at TU Berlin uses highly annealed pyrolytic graphite (HAPG) crystals over a wide energy range and a pixel detector to simultaneously record a wider energy range, thereby the need for an exchange of optics is eliminated and scanning of the optic reduced. This instrument has been successfully used in order to determine the Cu valence state crucial to elucidate catalytic function, as well as Mn and Fe species involved in catalysis (Dimitrakopoulou et al., Reference Dimitrakopoulou, Huang, Kröhnert, Teschner, Praetz, Schlesiger, Malzer, Janke, Schwab, Rosowski, Kaiser, Schunk, Schlögl and Trunschke2017; Le et al., Reference Le, Parishan, Sagaltchik, Göbel, Schlesiger, Malzer, Trunschke, Schomäcker and Thomas2017). Liquid samples have also been analyzed successfully.
Other groups, like Szlachetko et al. from Kielce Poland, the Paul Scherrer Institute, and Honkanen et al. from Helsinki Finland, have also established X-ray spectroscopic capacities in their laboratories over several years (Szlachetko et al., Reference Szlachetko, Berset, Dousse, Hoszowska and Szlachetko2013; Németh et al., Reference Németh, Szlachetko, Bajnóczi and Vankó2016; Honkanen et al., Reference Honkanen, Ollikkala, Ahopelto, Kallio, Blomberg and Huotari2019). In addition to the instruments available in individual research groups, the newly founded company “Sigray,” which started out building high-resolution micro-X-ray fluorescence instrumentation, recently commissioned a novel laboratory-based XANES using a tube design with diamond-embedded targets and paraboloidal imaging optics. Using this novel design, even a moderate spatial resolution of ~100 µm will be feasible.
The aim of the research presented here was to provide accurate speciation of vanadium in the VRFB electrolyte and membranes using a laboratory-based easyXES100 system.
II. EXPERIMENTAL
A. Chemicals and materials
Sulfuric acid, hydrogen peroxide, and nitric acid were purchased from Merck (for analysis, Darmstadt, Germany). Ultrapure water was generated by Veolia Elga Purelab Flex 4 (conductivity: 18 MΩ cm, Paris, France). Polyimide foil was obtained from Conrad Electronic (thickness: 40 µm, Hirschau, Germany). Clean laboratory wipes were obtained from Kimtech (Kimberly-Clark, Irving, USA).
Vanadium electrolytes were electrochemically converted from the V3+/VO2+ electrolyte (vanadium concentration: 1.6 M, sulfuric acid concentration: 4 M, Gesellschaft für Elektrometallurgie mbH, Nürnberg, Germany). The V species were evaluated using UV/Vis. Vanadium foil was obtained from Exafs Materials (thickness: 5 µm, Danville, USA). Nafion 117 was obtained from Chemours (thickness (unhydrated): 178 µm, equivalent weight: 1100 g n(SO3)−1, Wilmington, USA).
B. Sample preparation
Nafion was pretreated similar to Tang et al. (Reference Tang, Svoboda, Lawton, Aaron, Papandrew and Zawodzinski2013). Nafion was hold sequentially in 3% hydrogen peroxide, ultrapure water, 1 M sulfuric acid and ultrapure water. Every step was performed for 1 h at 80 °C.
Preparation of the V electrolyte for the laboratory-based XANES analysis:
A piece of commercial laboratory wipe was placed on a sticky polyimide foil. Then, ~25 µl of either the V2+, V3+, VO2+,  ${{\rm V}_2{\rm O}_3}^{3+}$, or
  ${{\rm VO}_2}^+$ electrolyte was pipetted on the wipe. The specimen was sealed immediately with another polyimide foil. In this way, a pouch filled with the electrolyte soaked onto the wipe was obtained. Aged samples of the electrolyte were obtained by storing the described specimens for 35 d at room temperature.
C. Preparation of V soaked Nafion 117
Pretreated Nafion 117 membranes were put in the 1.6 M V3+, VO2+,  ${{\rm V}_2{\rm O}_3}^{3+}$, and
  ${{\rm VO}_2}^+$ electrolyte for 72 h at room temperature. Subsequently, the membranes were extracted from the V electrolyte, and the superficial electrolyte was removed using a laboratory wipe. For the XANES analysis, the membranes were sealed in between two polyimide foils.
D. Instruments
Laboratory-based XANES measurements were performed using easyXES100 (EasyXAFS, Renton, USA). The easyXES100 is equipped with a VF-80JM X-ray tube (W/Pd-anode, 4 mA, 25 kV, Varex Imaging, Salt Lake City, USA). A Ketek detector VITUS H80 80 mm2 SDD (München, Germany) was used. The sample was mounted just in front of the detector. According to the manufacturer, the beam size on the sample is approximately 3 × 3 mm2, and the energy resolution of the instrument typically 0.5–1.5 eV at 85° Bragg angle and energies from 5000 to 12 000 eV. The energy resolution, thus, is comparable to those obtained with Si(111) optics at synchrotron facilities, e.g., Si(111) 1.4 × 10⁻⁴ dE/E P06 beamline (DESY, Hamburg Germany) (P06 – Micro and Nano-probe Beamline General Specifications, 2020). For the vanadium speciation, a Ge(422) SBCA (step size of ΔE = ~0.25 eV) was used. A helium flight path is installed to reduce air absorption (see Figure 1). The angle is converted into an energy using the following equation, where Eis the energy, E 0 is the backscatter energy, and ΘB is the Bragg angle:
 $$E = \displaystyle{{E_0} \over {{\rm sin}\lpar {\Theta_{\rm B}} \rpar }}$$
Figure 1. (Color online) Schematic representation of the easyXES100 in the XAFS mode.
For every sample, I 0 was measured separately, without any sample in the beam path. Usually, several XANES spectra (from −100 to 400 eV relative to the vanadium K-edge at 5463 eV) were collected on one sample and merged afterwards for better statistics. The energy steps and times varied depending on the specimen: V foil (n = 10, time per spectrum: 4520 s, ΔE of 0.25 eV over the entire energy range), electrolyte specimens (n = 4, time per spectrum: 2030 s, ΔE of 0.5 eV before the edge, 0.25 eV from −30 to 50 eV relative position of the edge, and 2–5 eV in the post-edge region), aged electrolyte (n = 4, measurement time: 1001 s, ΔE see electrolyte), and Nafion 117 membranes soaked with the electrolyte (n = 6, measurement time: 2920 s, ΔE see electrolyte).
E. Electrochemical cell
The electrochemical conversions were realized via an in-house built redox flow battery cell. The cell consists of two 500 ml electrolyte tanks (Duran, Schott, Mainz, Germany). Additionally, the negative electrolyte (NE) tank was linked to a 500 ml wash bottle (Duran, Schott, Mainz, Germany) filled with water and during operation NE tank was purged with nitrogen through the wash bottle to avoid oxidation of V2+. Membrane pumps NF 1.25 RPDC 12 V (KNF, Freiburg, Germany) and power supply LN-1803C (QUATPOWER, Pförring, Germany) were used to transport the electrolyte to the cell through PE tubes (inside diameter: 4 mm, outside diameter: 6 mm). PE tubes were linked to cell using PVDF straight connector (Reichelt Chemietechnik GmbH + Co., Heidelberg, Germany) and silicone O-rings (inside diameter 6.07 mm, outside diameter: 3/8 in, thickness 1.78 mm, RS PRO, Frankfurt am Main, Germany). From the outside to the core, the cell consist of acrylic glass end plate (thickness: 1 cm, from the workshop), graphite paper H2315 (thickness: 210 µm, Freudenberg, Freudenberg, Switzerland), copper plate (thickness: 1 mm, from the workshop), as current collector bipolar plate PPG86 (thickness: 1.5 mm, Eisenhuth, Osterode, Germany), acrylic glass space to provide space for the electrolyte (thickness: 2 mm, from the workshop) and silicone seals (thickness: 1 mm, from the workshop), graphite felt SIGRAFELL GFD 4.6EA (thickness: 4.6 mm, SGL Carbon, Wiesbaden, Germany), and in the middle, Nafion 117 as the polymer electrolyte membrane separator with an active area of 10 cm2. The charge and discharge procedure were performed using a potentiostat (VSP 5-channel, Bio-Logic, Claix, France) with 0.4 A.
III. RESULTS
A. Vanadium species determination of the VRFB electrolyte
The determination of the SOC is a fundamental value to examine the cell performance. In VRFBs, it was shown that especially for the positive electrolyte, the formation of the  ${{\rm V}_2{\rm O}_3}^{3+}$ dimer poses a major problem to determine the SOC via UV/Vis. Jia et al. (Reference Jia, Liu, Sun, Yang, Ren, Heald, Liu, Li, Lu and Xie2014) have shown that SR-XANES can be used instead to determine V2+, V3+, VO2+, and
  ${{\rm VO}_2}^+$ and therefore the SOC in situ. However, if the vanadium electrolyte of a concentration of 1.6 M could be analyzed by laboratory XANES instead this would allow an immediate analysis of samples, series measurements, and save resources. The concentration is quite high and the information obtained is extremely valuable in the performance evaluation of the VRFBs but does not necessarily necessitate the use of synchrotron facilities.
Accordingly, here we present laboratory-based studies on V species using an easyXES100 extended instrument. Initially, we studied a thin vanadium film.
Metal films are usually used to calibrate the energy scale of an XAFS measurement, they yield very good statistics and spectra are well described in the literature. Accordingly, here we first compare the XAFS measurement of a V foil obtained with the laboratory instrument with the literature data. In addition, the energy scale is calibrated using the following equation, where ΔΘ is the difference between the reference and measured data:
 $$E = \displaystyle{{E_0} \over {{\rm sin}\lpar {\Theta_{\rm B}-\Delta \Theta} \rpar }}$$
In Figure 2, the V K-edge XAFS of a V foil measured and corrected with our easyXES100 and at the Advanced Photon Source (APS) (Newville, Reference Newville2016) are shown. The XANES and EXAFS region of the laboratory-based XANES is comparable to the data from the synchrotron. When looking at the uncorrected and corrected spectra, it becomes clear how important the calibration and correction of the energy scale is. The relative uncertainties obtained from counting statistics on the edge jump for the V foil are below 1%. To obtain this quality of data 13 h measurement time was applied. The data at the APS was obtained in 930 s. Depending on the purpose, the measurement time should be optimized.

Figure 2. (Color online) V K-edge of a V foil measured with the laboratory-based easyXES and at the APS (Newville, Reference Newville2016).
The XANES spectra of V species in the vanadium electrolyte of a concentration of 1.6 M (62.7 g kg−1) containing V2+, V3+, VO2+,  ${{\rm VO}_2}^+$, and
  ${{\rm V}_2{\rm O}_3}^{3+}$ were studied using the easyXES100. UV/Vis measurements were performed alongside the XANES analysis for comparison. The results are displayed in Figure 3. The edge shifts to higher energies with increasing effective oxidation state of vanadium. In addition, we found the change of the pre-edge peak energy and intensity to be specific for the species VO2+,
  ${{\rm V}_2{\rm O}_3}^{3+}$, and
  ${{\rm VO}_2}^+$. The pre-edge features are comparable and the edge shifts are in the same range as observed by Jia et al. (Reference Jia, Liu, Sun, Yang, Ren, Heald, Liu, Li, Lu and Xie2014) at the APS.
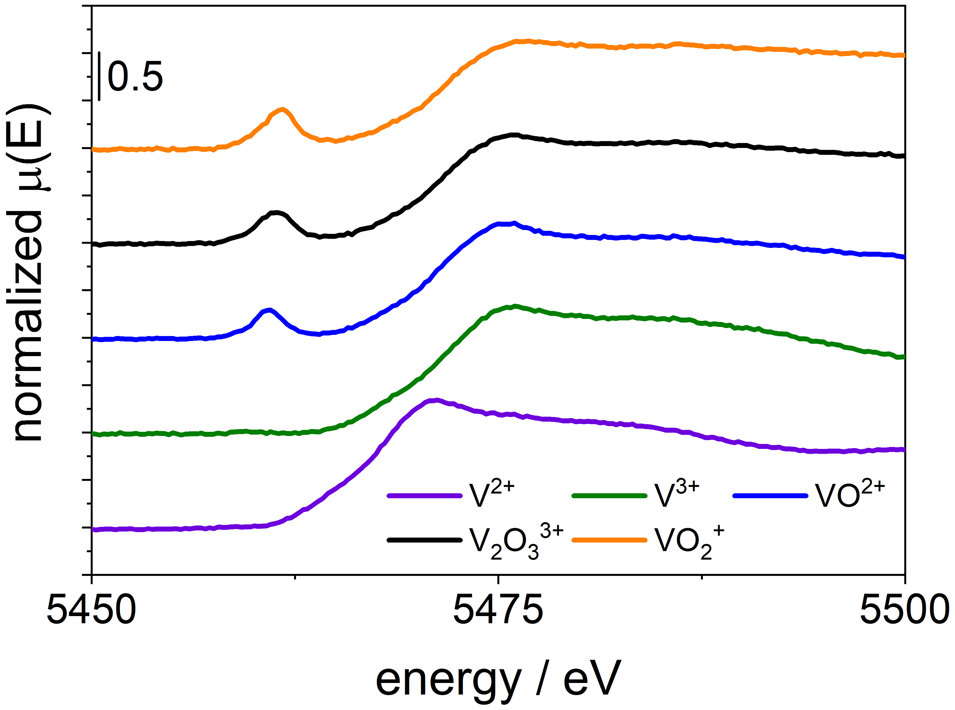
Figure 3. (Color online) V K-edge of the V2+, V3+, VO2+,  ${{\rm V}_2{\rm O}_3}^{3+}$, and
  ${{\rm VO}_2}^+$ electrolyte measured with the easyXES100.
The XANES of V2+(H2O)6 and V3+(H2O)6 does not show a pre-edge peak. This is because the coordination of the ions is octahedral. Thus, the 1s → 3d transition is not allowed due to selection rules. However, for VO2+(H2O)5,  ${{\rm V}_2{\rm O}_3}^{3+}$(H2O)8, and
  ${{\rm VO}_2}^+$(H2O)4, the transition is allowed because these ions show a distorted octahedral structure. The coordination of VO2+(H2O)5,
  ${{\rm V}_2{\rm O}_3}^{3+}$(H2O)8, and
  ${{\rm VO}_2}^+$(H2O)4 is not only affected by water molecules but also by the covalently bound oxygen atoms (Vijayakumar et al., Reference Vijayakumar, Burton, Huang, Li, Yang, Graff, Liu, Hu and Maria2010). The linear combination fit of the pre-edge peak of the dimer electrolyte yields a composition of 53% V–V and 47% V–IV which matches well ratio expected from the preparation of this electrolyte (50:50). The XANES spectrum of the dimer electrolyte and the linear combination of 50% V–V and 50% V–IV are shown in Figure 4. The results show that it will be possible to determine the SOC of the VRFB by laboratory XANES and linear combination fitting. In contrast to the UV/Vis specification, where the formation of the strong absorbing dimer hampers the determination of
  ${{\rm VO}_2}^+$ and VO2+.

Figure 4. (Color online) V K-edge of the  ${{\rm V}_2{\rm O}_3}^{3+}$ electrolyte and the linear combination of the spectra from 50% VO2+ and 50%
  ${{\rm VO}_2}^+$ measured with the easyXES100.
The laboratory XANES instruments allowed us to study the aging of the electrolyte, which in general manifests itself in precipitation of the solution. In Figure 5, first results of the V electrolyte aging are shown. The V K-edge of VO2+,  ${{\rm V}_2{\rm O}_3}^{3+}$, and
  ${{\rm VO}_2}^+$ are similar. It is likely that VO2+ and
  ${{\rm V}_2{\rm O}_3}^{3+}$ were reduced to the more stable VO2+. After 35 d, the spectrum of the V3+ displays a pre-edge peak. This may indicate an oxidation to VO2+ or precipitation to a compound with a distorted coordination sphere. The spectrum of V2+ exhibits a significant edge shift to higher energies and a small pre-edge peak appears which can be interpreted in the same way as for the V3+. However, the shift of the edge indicates the oxidation of V2+. This is not unexpected as V2+ has highly sensitive to oxidation and needs to be stored in inert gas atmosphere. These are first results and the aging processes must be studied in more detail in the future. The spectra on the electrolyte were obtained in approximately 2–2.3 h with a relative uncertainty obtained from the edge jump of less than 1%.

Figure 5. (Color online) V K-edge of the V2+, V3+, VO2+,  ${{\rm V}_2{\rm O}_3}^{3+}$, and
  ${{\rm VO}_2}^+$ electrolyte after 35 d measured with the easyXES100.
B. Vanadium species determination inside the nanoscopic water body of Nafion membranes
To understand capacity fade in VRFBs caused by vanadium cross over, it is key to understand the transport of the different V species inside the membrane. Diffusion coefficient of the ions differs considerably. To be able to determine V species inside membranes will help to understand the molecular processes underlying the transport. Being able to determine V species inside the hydrated membranes directly in the laboratory would be a major step forward in studying ionomeric membrane performance. For proof of principle, membranes soaked in a single V species electrolyte were subjected to laboratory-based XANES.
In Figure 6, XANES spectra of a Nafion 117 membrane soaked with the V3+, V3+, VO2+,  ${{\rm V}_2{\rm O}_3}^{3+}$, and
  ${{\rm VO}_2}^+$ electrolyte are shown. The pre-edge features of the VO2+,
  ${{\rm V}_2{\rm O}_3}^{3+}$, and
  ${{\rm VO}_2}^+$ electrolyte are well visible and allow distinguishing between the species. The concentration of V in the membrane according to our elemental determination is 0.192 ± 0.004 mol kg−1 (approx. 1% w), which is much lower than the concentration of the electrolyte of 1.6 mol l−1 (Lutz and Fittschen, Reference Lutz and Fittschen2019). Due to the low concentration, the measurement time was higher than for the electrolyte with 5 h. The statistical uncertainty derived from the edge jump was approximately 1.7%. The spectra are compared with the spectra of the V electrolyte. However, the signal-to-noise ratio is worse because of the lower concentration of V in the membrane and unspecific absorption of Nafion 117. The pre-edge transmission of the electrolyte is 57% compared to a pre-edge transmission of 17% for the Nafion 117 membranes soaked with the electrolyte.

Figure 6. (Color online) V K-edge Nafion 117 hydrated with the V3+, VO2+,  ${{\rm V}_2{\rm O}_3}^{3+}$, and
  ${{\rm VO}_2}^+$ electrolyte measured with the easyXES100.
IV. CONCLUSION
Overall, access to a powerful laboratory-based XAFS instrument provides important information on the SOC of VRFBs. It is even possible to determine V species inside the Nafion membrane. It can be concluded that laboratory-based XANES will help to understand the chemistry inside ionomeric membranes. The measurement times to achieve the V species determination in the membrane with sufficient statistics are approximately 2 and 5 h. This is much longer compared with time resolutions obtained at state-of-the-art synchrotron facilities, i.e., a measurement time of a few minutes or less is sufficient at a synchrotron. In consequence, time-resolved in situ measurements, e.g., to study charge–discharge phenomena in batteries, have only been realized at a synchrotron. Additionally, the smaller source size and the low divergence at synchrotron sources also allows using focusing optics and achieving higher spatial resolution in a reasonable time.
The benefit of laboratory XAFS is, however, the every day access without the need for a proposal. New ideas can be testes right away and preliminary data can be collected in preparation for the more detailed experiment at a synchrotron source. The analysis of references in higher concentration, as well as analyzes with lower spatial resolution, can and should be done in the laboratory. Finally, laboratory-based XAFS as described herein will improve “hands-on” experience in the field and improve those experiments taken to synchrotron facilities.
ACKNOWLEDGEMENTS
The authors want to thank Christian Gutsche (former Clausthal University of Technology) and Devon Mortenson (EasyXAFS) for support.


