I. INTRODUCTION
After the superconductivity of β-FeSe was discovered by Hsu et al. (Reference Hsu, Luo, Yeh, Chen, Huang, Wu, Lee, Huang, Chu, Yan and Wu2008), substantial efforts have been made to design new superconducting materials based on this non-toxic layered compound (Margadonna et al., Reference Margadonna, Takabayashi, Ohishi, Mizuguchi, Takano, Kagayama, Nakagawa, Takata and Prassides2009; Oyler et al., Reference Oyler, Ke, Sines, Schiffer and Schaak2009; Patel et al., Reference Patel, Hua, Yu, Avci, Xiao, Claus, Schlueter, Vlasko-Vlasov, Welp and Kwok2009; Williams et al., Reference Williams, McQueen and Cava2009; Guo et al., Reference Guo, Jin, Wang, Wang, Zhu, Zhou, He and Chen2010; Jung et al., Reference Jung, Lee, Choi, Kang, Lee, Hwang and Kin2010). A large number of superconducting materials have been made by doping or intercalating another component into this binary system. Up to now, the highest superconducting transition temperature of the FeSe-based materials was reported to be above 48.7 K for K0.8Fe1.7Se2 by Sun et al. (Reference Sun, Chen, Guo, Gao, Huang, Wang, Fang, Chen, Chen, Wu, Zhang, Gu, Dong, Wang, Yang, Li, Dai, Mao and Zhao2012). However, the superconducting phase in this material is still in dispute. Furthermore, the superconducting mechanism of the FeSe-based materials has not yet been reported.
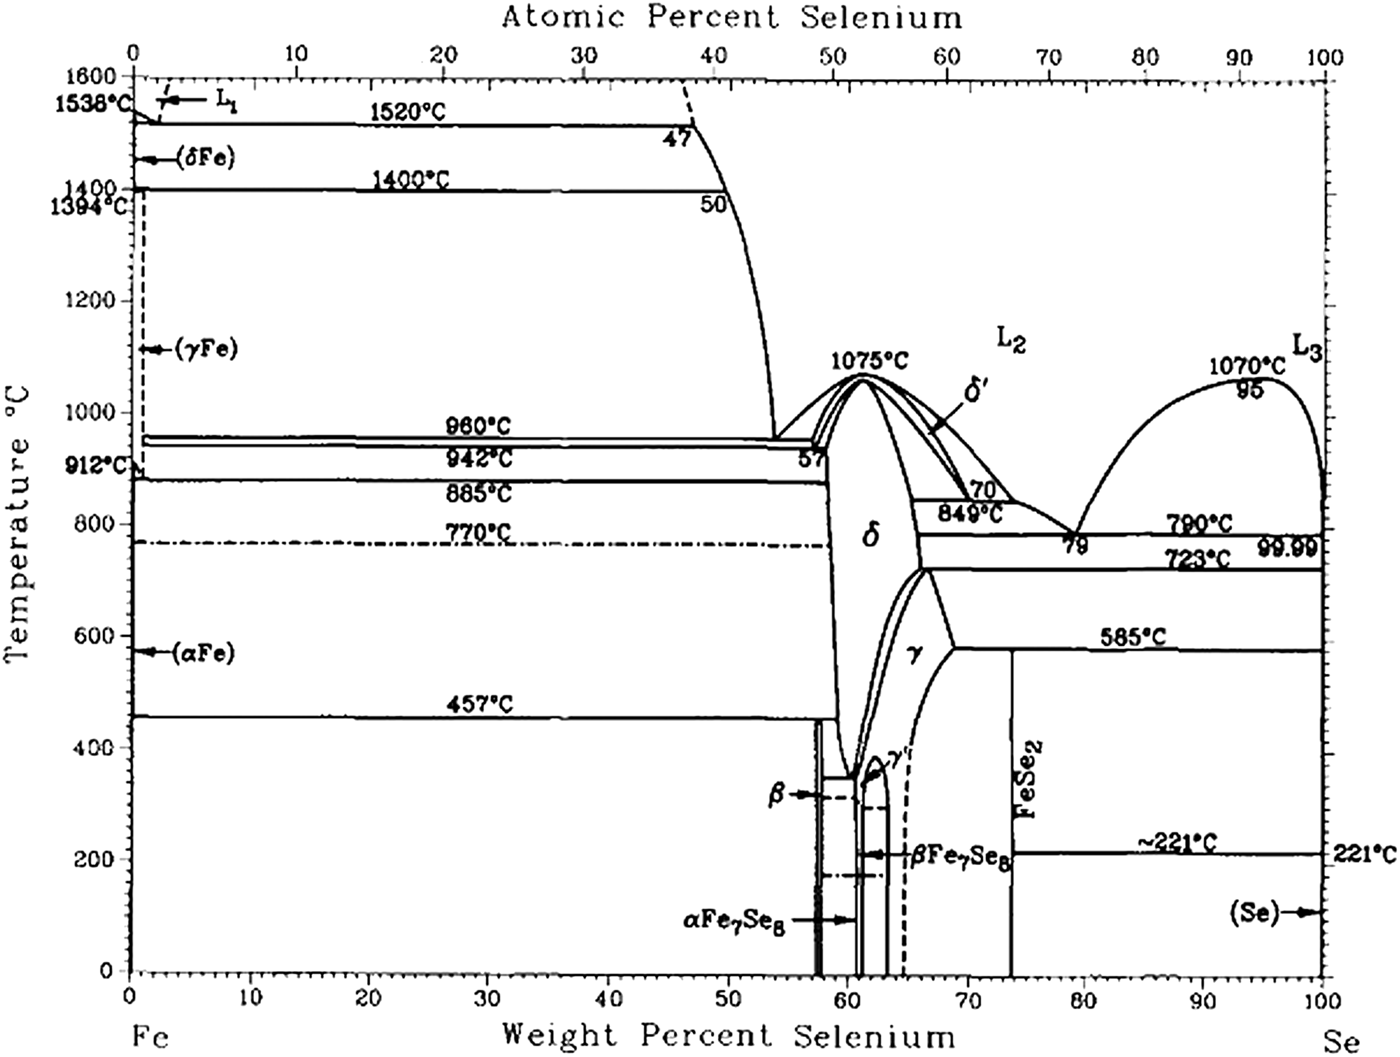
Phase diagram plays a major role in designing materials and in understanding their physical and chemical properties (Pomjakushina et al., Reference Pomjakushina, Conder, Pomjakushin, Bendele and Khasanov2009). As the foundation of FeSe-based materials, the Fe–Se binary system should be completely studied. The binary phase information can be extrapolated into a multi-component system, and it can also be used to calculate the thermodynamic properties, such as the energies of formation of the defects in the superconducting β-FeSe compound. There are several publications which have reported the phase information on the Fe–Se binary system (Hirone and Chiba Reference Hirone and Chiba1956; Dutrizac et al., Reference Dutrizac, Janjua and Tognri1968; Svendsen, Reference Svendsen1972). Schuster et al. (Reference Schuster, Mikler and Komarek1979) studied the entire system by isopiestic methods and X-ray analysis, and they assessed the previous literature and reported a complete phase diagram for the Fe–Se binary system. Two compounds, FeSe and FeSe2 in the iron-rich portion and the selenium-rich portion, respectively, were confirmed by Schuster et al. (Reference Schuster, Mikler and Komarek1979). The phase structures with the selenium contents from 51.5 to 58.5 at.%, which are the most complicated part of this binary system and named “Fe1−xSe phase” in the literature, were also determined in their work. Three non-stoichiometric compounds (hexagonal-δ and monoclinic-γ and -γ′) were reported in this range, and the solid-solution ranges at 552°C were presented. However, Katayama et al. (Reference Katayama, Uoda and Kosuge1990) re-studied this “Fe1−xSe phase” (from 50 to 58.3 at.% Se) in the lower-temperature region at 300 and 400°C by X-ray and DTA measurements and presented results different from those reported by Schuster et al. (Reference Schuster, Mikler and Komarek1979) in the range of 50–60 at.% Se. Another compound, Fe7Se8 was found in the lower temperature range. However, the monoclinic-γ′ phase was not observed by Katayama et al. (Reference Katayama, Uoda and Kosuge1990) and another monoclinic phase γ was named Fe3Se4 and showed a totally different solid-solution range. Based on these two works, Okamoto (Reference Okamoto1991) evaluated this binary-phase diagram (shown in Figure 1), but since there was no conformity, the selenium-rich boundary of monoclinic-γ was drawn as a dashed line. Table I presents the names and the solid-solution ranges of Fe3Se4 reported in different previous works. Since the phase information before 1979 was all obtained in the higher-temperature range above 400°C, the results at the lower-temperature range from Katayama et al. (Reference Katayama, Uoda and Kosuge1990) need to be re-examined. Furthermore, detailed work should also be done to determine the correct solid-solution range of the monoclinic Fe3Se4 phase.

Figure 1. Phase diagram of the Fe–Se binary system by Okamota (1991).
Table I. The solid-solution ranges of Fe3Se4 reported in the literature.

The magnetic properties of iron selenides can be very sensitive to their compositions. The magnetism of iron selenides was first studied by Hirone and Chiba (Reference Hirone, Maeda and Tsuya1954), who reported that the Curie temperature of Fe3Se4 is 303 K. Terzieff and Komamk (Reference Terzieff and Komamk1978) also measured the magnetic properties of the compounds in the Fe–Se system and found that Fe3Se4 is ferrimagnetic with a different Curie temperature of 338 K. The disagreement between the results obtained by Hirone and Chiba (Reference Hirone, Maeda and Tsuya1954) and Terzieff and Komamk (Reference Terzieff and Komamk1978) can be due to different compositions they measured in the solid-solution range.
In order to resolve the differences in the Fe–Se binary system, the phase relation of 50–60 at.% Se, the solid-solution range of Fe3Se4 and the magnetic properties of Fe3Se4 with different compositions have been examined in this work. Powder X-ray diffraction (PXRD) was carried out to obtain the phase information, and on the basis of unit-cell parameters (Grain, Reference Grain1967), the solid-solution range of Fe3Se4 has been determined. An inductively coupled plasma-atomic emission spectrometry (ICP-AES) was used to check the chemistry compositions of the samples. Finally, a physical property measurement system (PPMS) was used to measure the magnetic properties of the Fe3Se4 samples.
II. EXPERIMENTAL
All samples were prepared by solid-state reaction. The pure powders of Fe (99.99%) and Se (99.95%), which are the products of China National Accord Medicines Corporation, were mixed and ground in an agate mortar, cold-pressed into disks (10 mm in diameter) with 200 kg cm−2 uniaxial stress and sealed in a quartz tube under vacuum. All samples were heated at 1000°C for 3 days and cooled down to room temperature in the furnace with the power switched off to get the phases in the low temperature range. A part of each sample was used for the PXRD measurement and the other part was comminuted, sealed in the quartz tube again under vacuum and re-heated at 400°C for 7 days before cooling down, to check the phase equilibrium in the sample.
PXRD data used for phase identification were collected at room temperature on a PANalytical diffractometer (X'Pert PRO MRD) equipped with CuKα radiation (λ = 1.5418 Å) operating at 40 kV and 40 mA and a diffracted-beam graphite monochromator in a reflection mode (2θ = 10–80°, step = 0.017°2θ, and scan speed = 5 s per step).
For precise unit-cell parameter determination, a NIST standard reference material 640 Si powder standard sample was used to calibrate the wavelength and diffractometer. The CoKα radiation (λ = 1.7903 Å) at 40 kV and 30 mA with a diffracted-beam graphite monochromator was used in a reflection mode (2θ = 5–135°, step = 0.017°2θ, and scan speed = 20 s per step).
Magnetic susceptibility measurements were carried out using a Quantum Design PPMS magnetometer in the temperature range of 10–380 K and at a magnetic field of 0.2 T. Approximately 20–40 mg of the material was weighed accurately into a gelatin capsule. Measurements of the susceptibility were made on warming after cooling in zero field (zero field-cooled (ZFC)).
III. RESULTS AND DISCUSSION
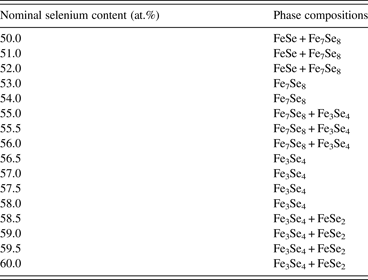
A total of 16 samples with selenium contents from 50 to 60 at.% were investigated by PXRD. The phase composition was obtained with the first part of each sample, and PXRD was carried out again to measure the other part after the second heat treatment. XRD patterns from two parts of the samples were compared and no significant changes could be observed, which verify the equilibrium of the phases in our samples. The phase compositions of the samples in the low temperature range are listed in Table II. It can be seen that the Fe7Se8 phase appeared in our work, which agrees with that reported by Katayama et al. (Reference Katayama, Uoda and Kosuge1990), who found that the Fe7Se8 phase can be stable only at temperatures below 320°C. This also suggests that the phase equilibrium in our samples reached below 320°C.
Table II. Phase compositions of the samples with selenium contents between 50 and 60 at.%.
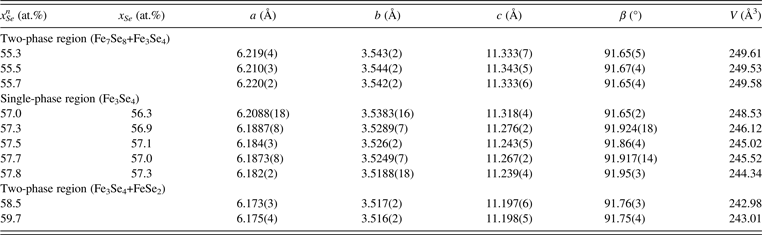
In order to obtain accurate unit-cell parameters of Fe3Se4, ten samples around the Fe3Se4 solid solution were analyzed with PXRD in a reflection mode (2θ = 5–135°, step = 0.017°2θ, and scan speed = 20 s per step). CoKα radiation was used to avoid possible Fe fluorescence and to increase the resolution of the diffraction data. Moreover, a Si standard was used to calibrate the wavelength and diffractometer. XRD patterns of the samples within the 55.3–59.7 at.% Se nominal composition range are shown in Figure 2. It can be seen that within the nominal composition range of 55.3–55.7 at.% Se [Figure 2(a)], the intensities of peaks belonging to Fe7Se8 decrease with increasing Se content. Although the majority of Fe7Se8 peaks overlapped with those from Fe3Se4, the peak near 60°2θ can serve as a reliable indicator of the existence of Fe7Se8. In the patterns of the composition range between 57 and 57.8 at.% Se as shown in Figure 2(b), all the observed diffraction peaks can be indexed by a monoclinic cell, no impurity peaks arising from either the Fe7Se8 or FeSe2 phase can be observed. The patterns are quite consistent with each other except that the position of peaks was shifted slightly to the right side with increasing Se content. For samples with nominal Se contents higher than 58.5 at.%, a considerable amount of FeSe2 impurity appeared in the patterns [Figure 2(c)], indicating that the samples are within the Fe3Se4 and FeSe2 two-phase region.
Figure 2. X-ray diffraction patterns of samples with different compositions in (a) the two-phase region: Fe7Se8+Fe3Se4, (b) the Fe3Se4 single-phase region, and (c) the two-phase region: Fe3Se4 + FeSe2.
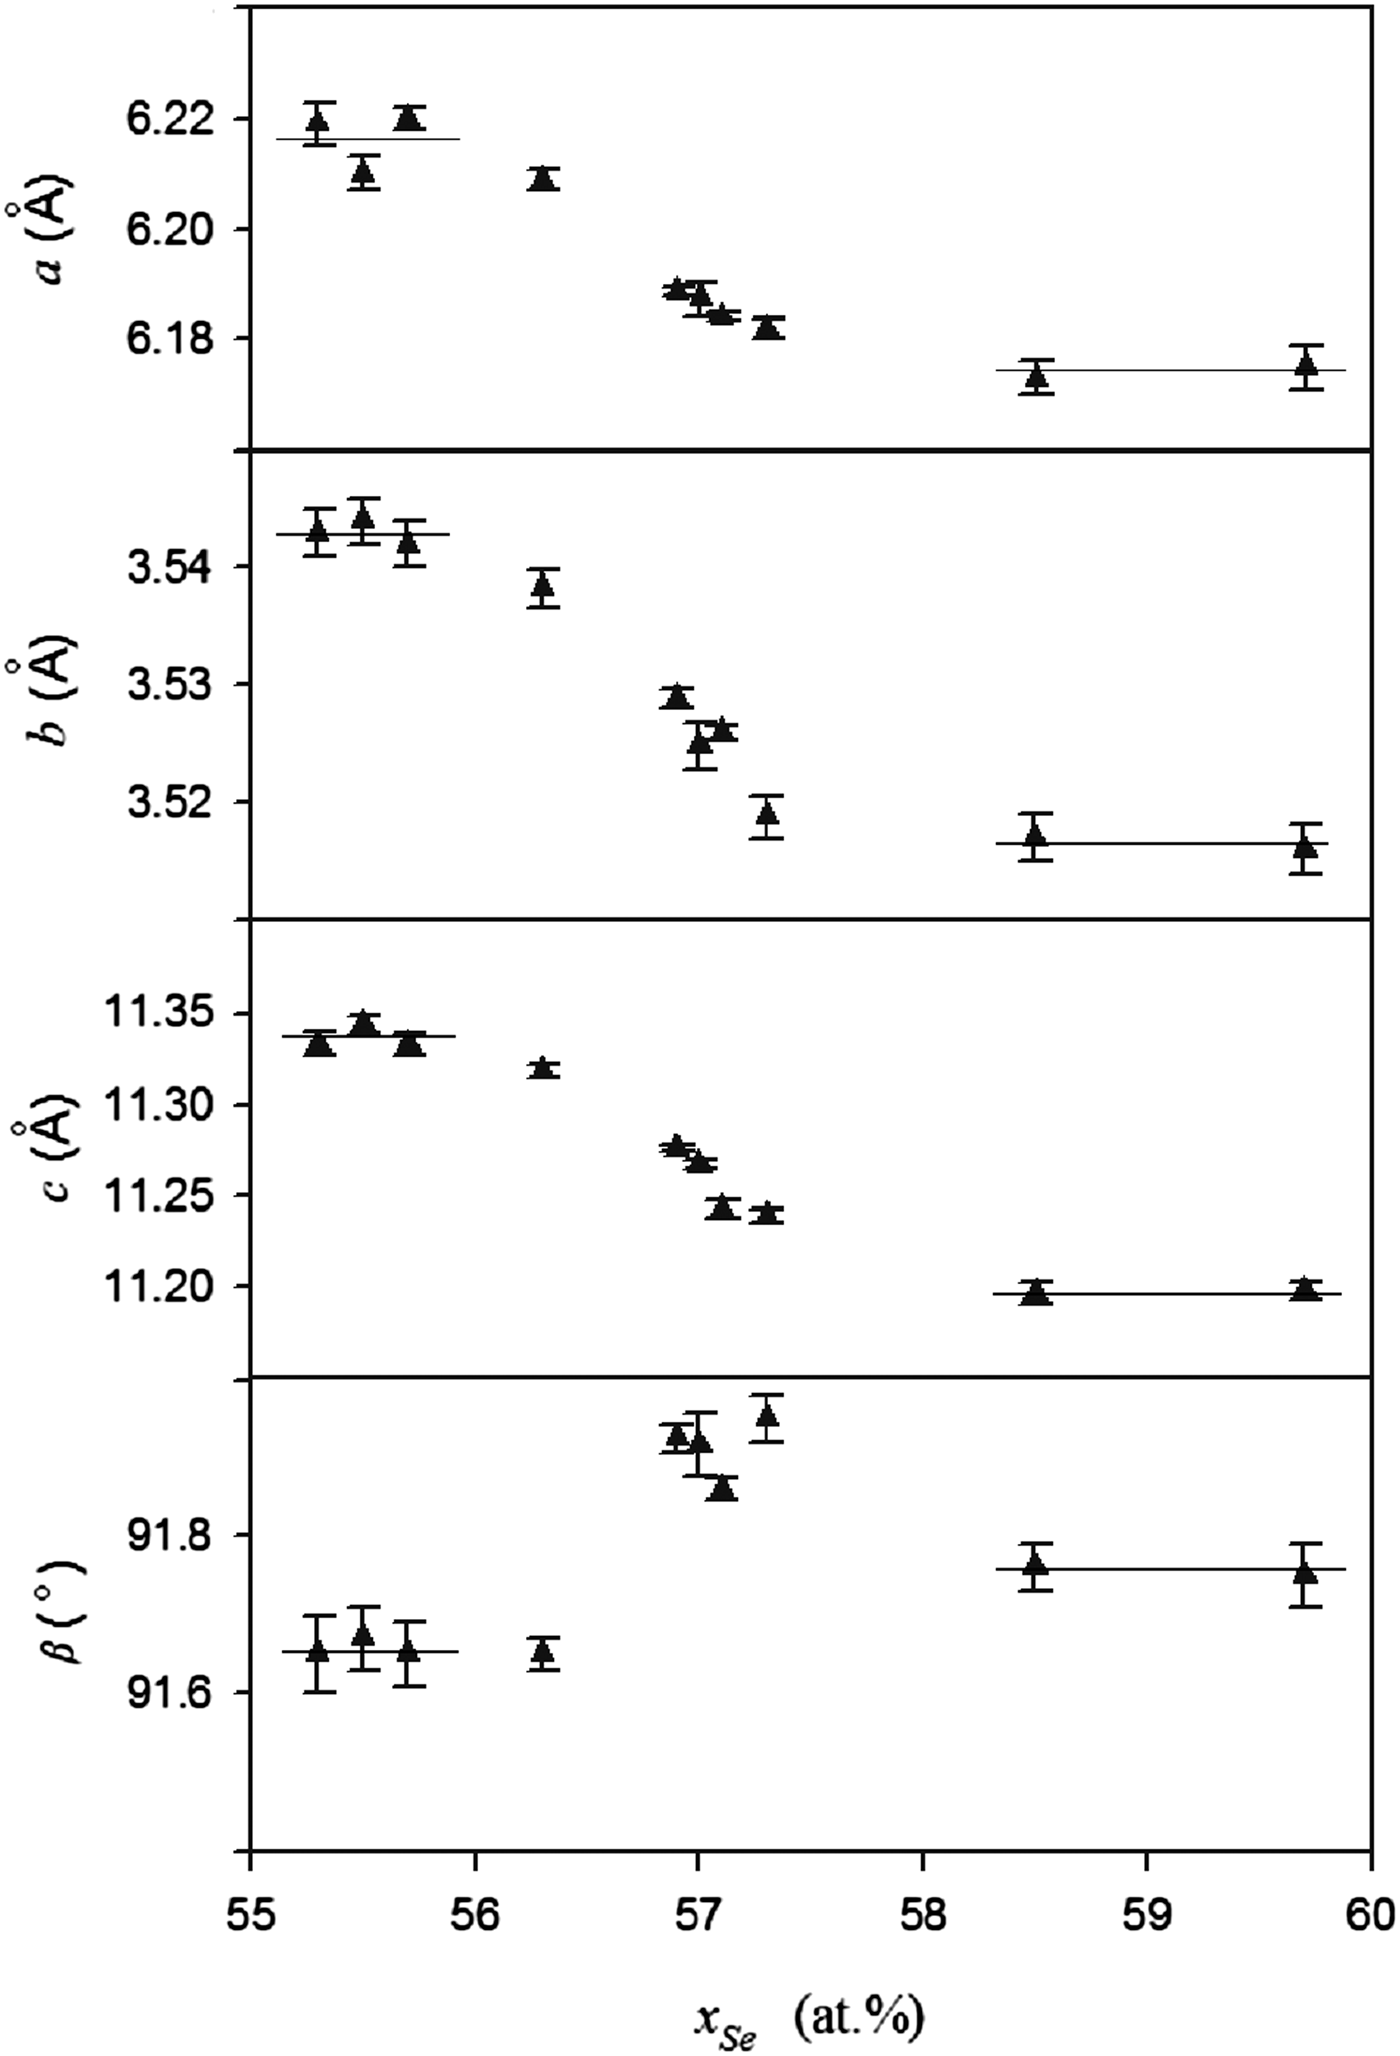
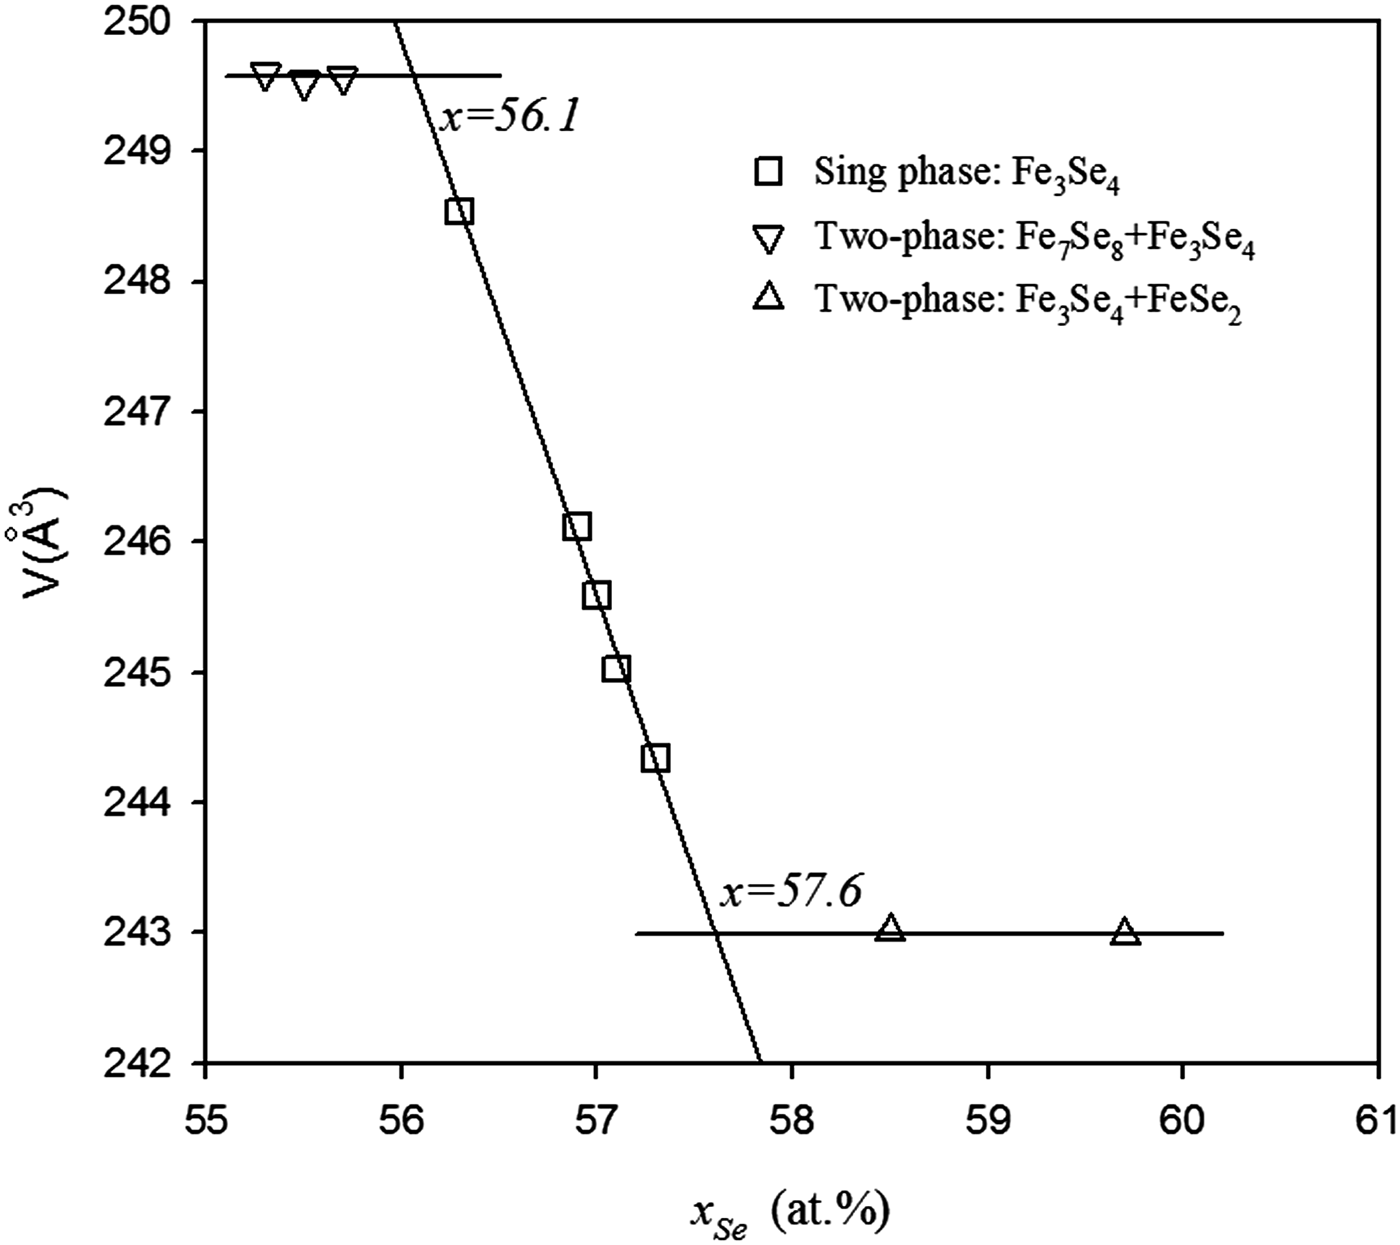
In order to obtain accurate chemical compositions of the samples, ICP-AES was used to measure the actual compositions of the five samples in the single-phase region, and the results are shown in Table III. It should be noted that the compositions of Se were smaller than the nominal compositions, which could be due to the volatility of selenium. The unit-cell parameters of these ten samples are also listed in Table III. The parameters (a, b, c, and β) of Fe3Se4 with different compositions are shown in Figure 3. It can be seen that in the Fe3Se4 single-phase region the monoclinic unit cell (space group I2/m) of Fe3Se4 decreases with increasing Se content: the a-axis from 6.2088 to 6.182 Å, the b-axis from 3.5383 to 3.5188 Å, and the c-axis from 11.318 to 11.239 Å. It can be observed that with rising Se content, the vacancies of the iron atom are increased, which can be responsible for slightly reduced unit cells. The parameters in the two-phase regions basically remain unchanged, which agrees with the phase rule. The unit-cell volumes of Fe3Se4 with different compositions are plotted in Figure 4 and a linear dependence of the volume with the Se content is observed for the five samples within the single-phase region, which agrees well with Vegard's law. Unit-cell volumes of Fe3Se4 within the two-phase regions are also given in Figure 4, and for those samples, two horizontal lines are subsequently fitted. The solid-solution range of Fe3Se4, determined from the two crossing points, is from 56.1 to 57.6 at.% Se. Compared with the results from the literature in Table I, it is clear that the results from Schuster et al. (Reference Schuster, Mikler and Komarek1979) are more reasonable. The reason for the deviation in the 1979 work could be due to the use of nominal compositions in their research.
Figure 3. Unit-cell parameters (a, b, c, and β) of Fe3Se4 with different compositions.
Figure 4. Variation of the unit-cell volume with the selenium content, and the solid-solution range determined from the unit-cell volume.
Table III. The values of unit-cell parameters of Fe3Se4 in the single-phase region and the adjacent two-phase regions.
x Sen: the nominal composition of Se.
x Se: the composition of Se from the ICP-AES measurement.
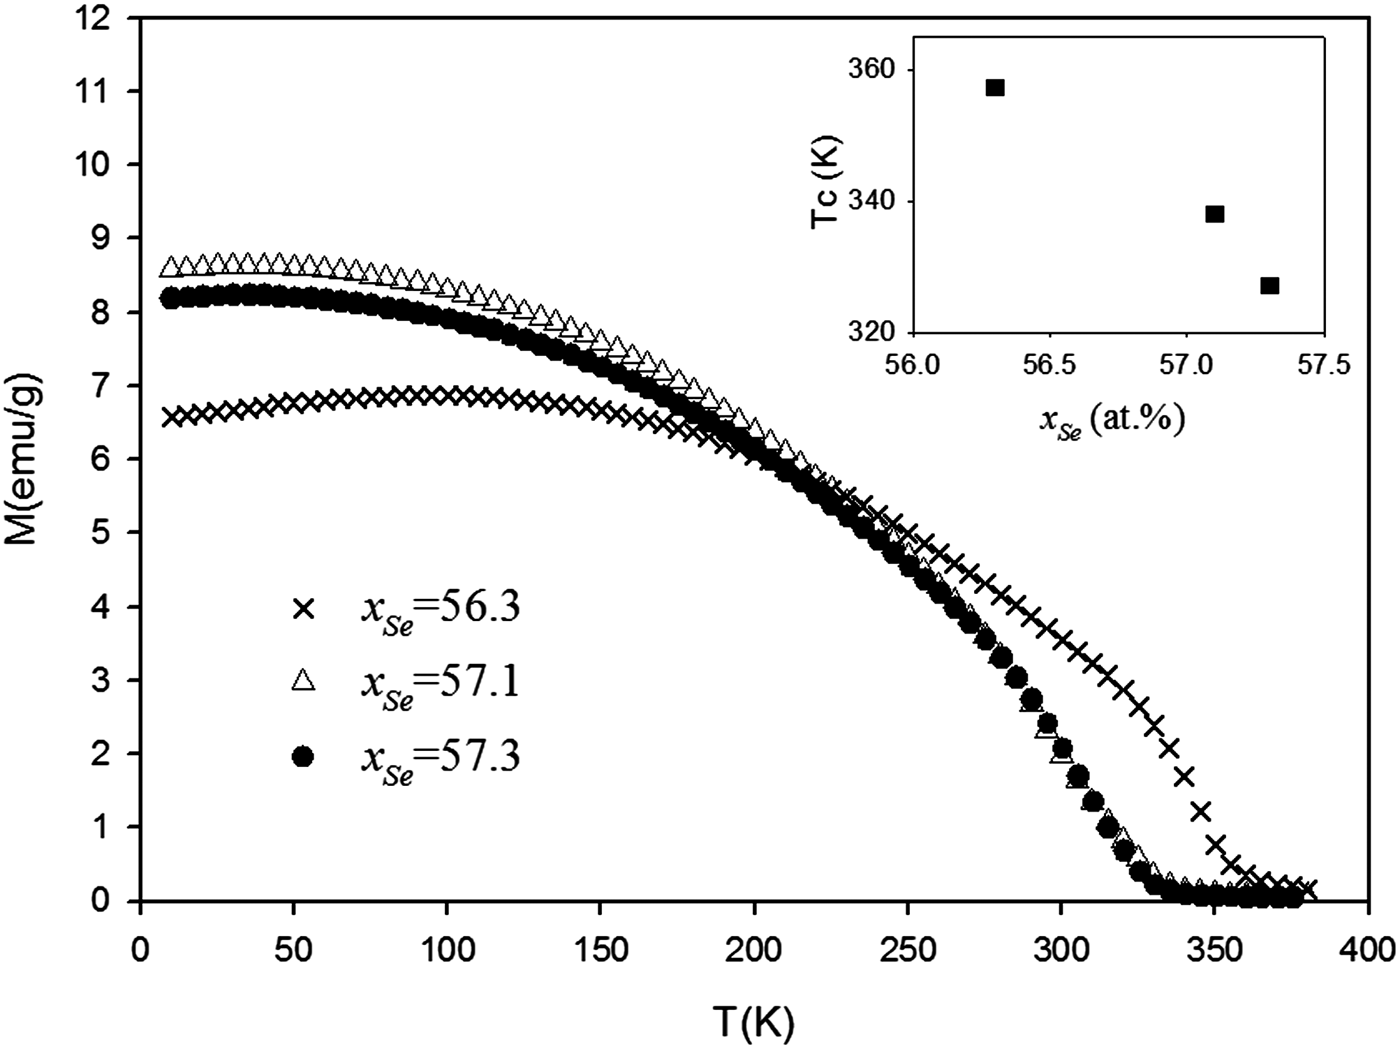
The thermomagnetic curves of three samples with 56.3, 57.1, and 57.3 at.% Se contents are plotted in Figure 5 and the Curie temperatures calculated from the curves are shown in Table IV and are also plotted in the inset of Figure 4. Ferrimagnetism is observed from all three samples, which agrees with the work reported by Terzieff and Komamk (Reference Terzieff and Komamk1978). Specifically, the Curie temperature at 57.1 at.% Se (338 K) is the same as Terzieff's results. Compared with the other compositions, it can be seen that the Curie temperature decreases with increasing Se content in the solution range of Fe3Se4. This trend can be attributed to an increase in non-magnetic selenium ions with increasing Fe vacancies, which weaken the interaction between the magnetic iron ions and reduce the Curie temperature.
Figure 5. M–T curves obtained by the magnetic measurement, and the Curie temperatures calculated from the M–T curves.
Table IV. Curie temperatures of Fe3Se4 with different Se contents.
x Se: the composition of Se from the ICP-AES measurement.
IV. CONCLUSION
In this work, the crystalline phases of the Fe–Se binary system with selenium contents from 50 to 60 at.% were studied by XRD and two non-stoichiometric compounds (hexagonal-Fe7Se8 and monoclinic-Fe3Se4) have been observed. The solid solubility of the Fe3Se4 phase has been determined based on the values of unit-cell parameters, which is from 56.1 to 57.6 at.% of selenium content. The results were compared with those from the previous literature. The thermo-magnetic curves of three samples with 56.3, 57.1, and 57.3 at.% Se were measured. Ferrimagnetism was obtained for all three samples and the Curie temperature in the Fe3Se4 solid solution was calculated and found to decrease with increasing Se content.
ACKNOWLEDGEMENTS
Financial support from the National Natural Science Foundation of China (numbers 50772012,51172025 and 50972010) and the Fundamental Research Funds for the Central Universities (number FRF-TP-09-021B) is gratefully acknowledged. The authors also thank Yanping Xu for her help with PXRD measurements.