


I. INTRODUCTION
In only two decades, the accessibility of high-energy radiation (HE) at synchrotron sources and series of new algorithms for data processing prompted advanced techniques such as X-ray (total) scattering, in situ powder X-ray diffraction (PXRD), and X-ray diffraction computed tomography (XRD-CT). As these HE applications enabled time- and spatially-resolved analysis of materials with various degrees of crystallinity, they are quickly impacting almost every field of material science. After two successful decades, what are the next challenges or opportunities?
The analysis of semi- and noncrystalline materials was significantly advanced by the marriage of HE-beamlines and the algorithm for pair distribution function (PDF) analysis (Billinge and Kanatzidis, Reference Billinge and Kanatzidis2003). The initial challenge of the technique was hours-long data acquisition, resulting from the use of point detectors scanning over wide angular ranges. This was soon addressed by introducing comparably larger 2D detectors and even higher energies in the experimental setup. Indeed, the combination of the image plate and high-energy radiation (≈80 keV) decreased the measurement time a few orders of magnitude. However, this setup restrains the accessible Q and time resolution, because of several factors: high background, difficulties in resolving Compton and fluorescence scattering (Chupas et al., Reference Chupas, Qiu, Hanson, Lee, Grey and Billinge2003), and detector properties such as pixel resolution, readout time, and active area. In 2007, these limits were tackled with the flat-panel detector. Featuring relatively narrower point spread function, higher frame rates, and large active area, the flat-panel enabled fast acquisition of high-resolution scattering data, limited only by frame rates (30 Hz), and image-lag correction procedures (Chupas et al., Reference Chupas, Chapman and Lee2007). Nowadays, both types of 2D detectors are used in PDF analyses, where the data quality depends on aforementioned factors, while the time resolution ranges from seconds to minutes, depending on a sample and the setup. In both cases, subsequent data processing needs to address an appropriate procedure for evaluating uncertainties of 2D data, to take into account the fact that the signals are not counted, but integrated (Yang et al., Reference Yang, Juhás and Billinge2013).
Similarly, the combination of hard X-rays and modern Rietveld refinement software (Coelho, Reference Coelho2000; Stinton and Evans, Reference Stinton and Evans2006) extended the scope of dynamic and in situ PXRD experiments. Particular advantages of HE-PXRD, e.g. penetration depth, low absorption, and shrinkage of scattering angles enabled not only monitoring reactions in vessels, such as mechanochemical reactions (Friščić et al., Reference Friščić, Halasz, Beldon, Belenguer, Adams, Kimber, Honkimäki and Dinnebier2013), but also shortened the time necessary to collect the full data set. Time resolution and data quality are mostly limited by the detector size (2θ-coverage) and frame rates, but also by the signals from the vessel that swamp the signals of the investigated material.
Although XRD-CT was introduced as a laboratory method already in 1987 (Harding et al., Reference Harding, Kosanetzky and Neitzel1987), it is only during the last decade that the technique blossomed at HE-beamlines equipped with 2D detectors (Bleuet et al., Reference Bleuet, Welcomme, Dooryhée, Susini, Hodeau and Walter2008). Since 2008, XRD-CT was successfully used for a variety of heterogeneous materials including diluted materials, biological tissues, and even amorphous materials (Alvarez-Murga et al., Reference Alvarez-Murga, Bleuet, Leopoittevin, Boudet, Gabarino, Salamat, Tucoulou, Mezouar and Hodeau2014). Not surprisingly, the technique was expanded to support PDF-CT (Jacques et al., Reference Jacques, Di Michiel, Kimber, Yang, Cernik, Beale and Billinge2013), and real-time XRD-CT (Jacques et al., Reference Jacques, Di Michiel, Beale, Sochi, O'Brien, Espinosa-Alonso, Weckhuysen and Barnes2011), two promising new approaches. Further advances in time-resolved XRD-CT techniques include resolving the limitations imposed by the frame rates of the detector and optimizing the data collection strategy to the point where the time and spatial resolution do not need to be traded off against one another.
In summary, this brief overview identifies the main challenge of the selected HE applications: collecting high-quality data in a subsecond time regime. In 2007, it was proposed that the greatest potential in PDF development lies in the optimization of detector technology (Chupas et al., Reference Chupas, Chapman and Lee2007). In this work, we take this idea one step further and examine how the detector technology based on the direct detection of X-rays affects the data quality and time resolution of HE X-ray techniques.
The direct detection of X-rays, as an integral part of hybrid photon counting (HPC) technology, significantly improved time resolution and data quality of various X-ray-based applications (Jaeschke et al., Reference Jaeschke, Khan, Schneider and Hastings2016). In the last decade, HPC-detectors became widely used and available particularly owing to the commercialization of the silicon-based detectors PILATUS (Brönnimann et al., Reference Brönnimann, Baur, Eikenberry, Fischer, Florin, Horisberger, Lindner, Schmitt and Schulze2002), EIGER (Dinapoli et al., Reference Dinapoli, Bergamaschi, Henrich, Horisberger, Johnson, Kraft, Mozzanica, Schmitt, Shi and Suter2010), and MYTHEN (Schmitt et al., Reference Schmitt, Brönnimann, Eikenberry, Gozzo, Hörmann, Horisberger and Patterson2003; Bergamaschi et al., Reference Bergamaschi, Cervellino, Dinapoli, Gozzo, Henrich, Johnson, Kraft, Mozzanica, Schmitt and Shi2010). Noise-free technology and modular design of these systems advanced the XRPD and scattering measurements by allowing high quality data to be collected in second (Dyadkin et al., Reference Dyadkin, Pattison, Dmitriev and Chernyshov2016) or subsecond time regime (Haverkamp and Wallwork, Reference Haverkamp and Wallwork2009; Jones et al., Reference Jones, Fearn, Winter, Yuan, Lennie, Parker, Thompson and Tang2014; Thompson et al., 2014). However, the advantages of these HPC-detectors were limited to applications carried out in low and mid X-ray regime, owing to the low absorption efficiency of silicon sensor at energies higher than 40 keV. Thus, the use of the HPC-technology in HE applications relied on a sensor material that exhibits higher absorption efficiency at high X-ray energies, such as CdTe, GaAs, or Ge (high Z materials). Hybrid design of the photon-counting detectors allows sensor and readout to be produced independently (Figure 1), so today various sensors are combined with several readout ASICs (Application Specific Integrated Circuit): Medipix3 (Ballabriga et al., Reference Ballabriga, Campbell, Heijne, Llopart, Tlustos and Wong2010), PIXIRAD III (Bellazzini et al., Reference Bellazzini, Brez, Spandre, Minuti, Pinchera, Delogu, de Ruvo and Vincenzi2015), and PILATUS3 (Loeliger et al., Reference Loeliger, Brönnimann, Donath, Schneebeli, Schnyder and Trüb2012). This, in turn, resulted in several photon-counting detection systems with distinct features and technical specifications, governed by the ASIC design and the choice of the sensor. Apart from sensor type and thickness, the active area of the sensor is another distinctive feature of a detector as it influences achievable frame rates and total angular coverage. Moreover, unlike silicon-based sensors, the active area of high Z detectors is often limited by the difficulties in growing crystals of suitable quality, so it directly influences the data quality. This work addresses characterization and applications of systems based on PILATUS3 readout chip and CdTe sensor, the first commercially available large-area CdTe detector, scaling up to two million pixels (2M).
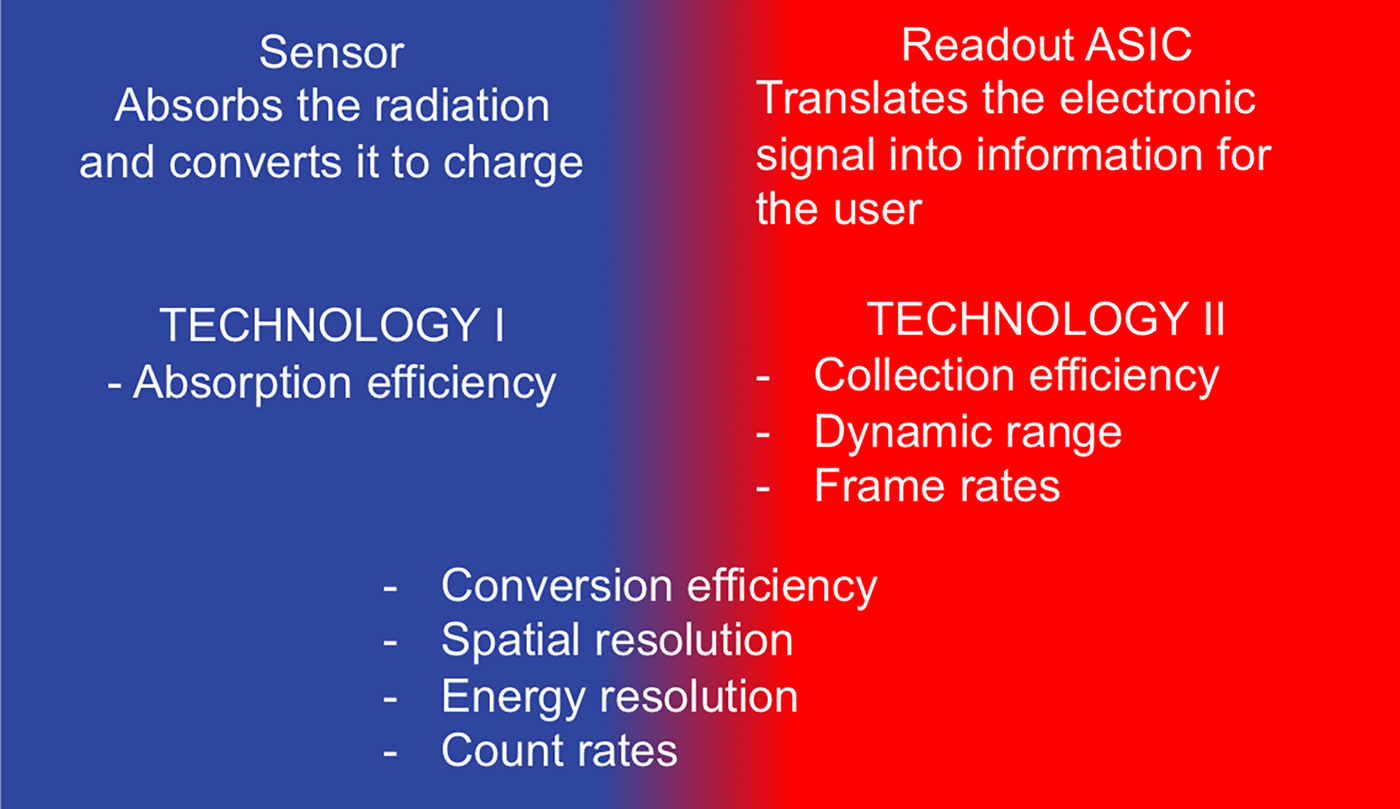
Figure 1. (Colour online) Individual optimization of two technologies (sensor, readout) is an underlying principle of HPC design and a key to specific detector properties.
II. EXPERIMENTAL
Characterization of the PILATUS3 CdTe detector was examined in two contexts: (A) detector technical specifications and (B) effect of the technical specifications on quality of data collected at short acquisition times. A prototype of PILATUS3 CdTe was used for the detector characterization, while the XRPD, X-ray scattering, and XRD-CT measurements were carried out with a commercial PILATUS3 X CdTe 300 K system (301 453 pixels). Considering that the PILATUS3 CdTe features an adjustable energy threshold, it is important to note that all presented measurements were carried out using the default value of the energy threshold, which corresponds to the 50% of the energy of incoming X-ray beam.
A. PILATUS3 CdTe characterization
The full characterization of PILATUS3 CdTe detector system was carried out at BAMline at BESSY II (Görner et al., Reference Görner, Hentschel, Müller, Riesemeier, Krumrey, Ulm, Diete, Klein and Frahm2001) and at DECTRIS, and described elsewhere (Radicci et al., Reference Radicci, Commichau, donath, Rissi, Sakhelashvili, Schneebeli, Traut, Trueb, Tudosie and Broennimann2014). Here we present three fundamental characteristics, which are essential for the collection of high-quality data.
1. Quantum efficiency
Throughout a given energy range, sensor absorption depends on the material type and its thickness. In comparison with Si, the photoelectric absorption coefficient of CdTe is significantly higher, especially between 40 and 100 keV [Figure 2(a)]. The absorption efficiency of the sensor is one of the important parameters for evaluating the quantum efficiency of the detector [Figure 2(b)]. Values simulated with HORUS (Pennicard and Graafsma, Reference Pennicard and Graafsma2011) predict high quantum efficiency between 10 and 100 keV (dashed line), what is supported by the set of measured values (dots). Two kinks on the curve at 26.7 and 31.8 keV correspond to the K edge of Cd and Te, what results effectively in a reduction of the energy of the detected X-ray photons. Quantum efficiency is correlated with the decrease in data acquisition times, thus this is the main factor influencing time resolution.
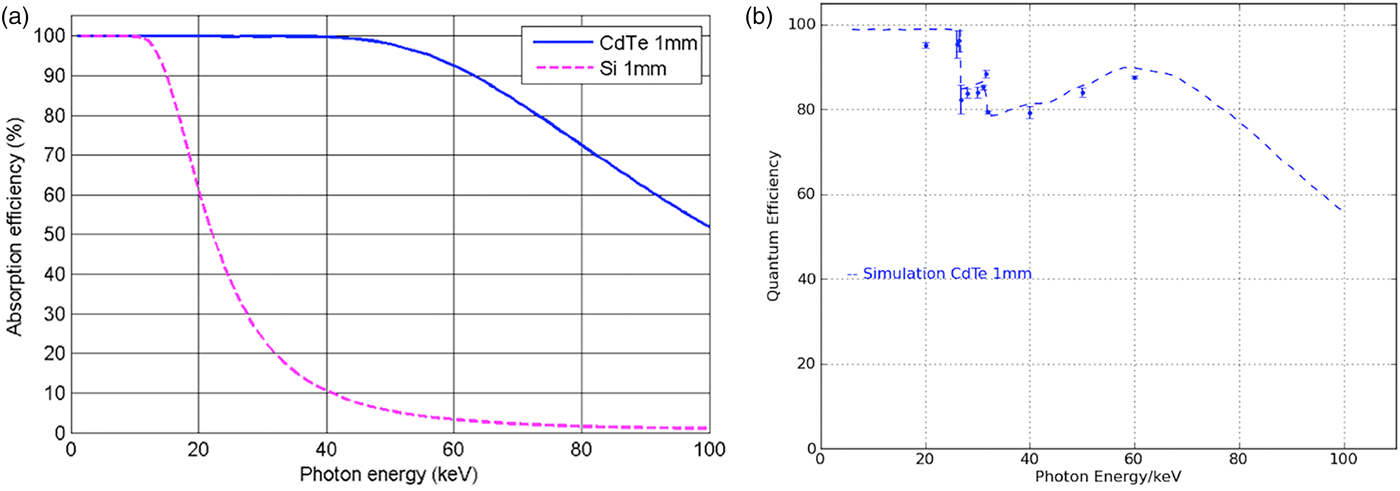
Figure 2. (Colour online) (a) In comparison with Si (pink dashed), CdTe sensor (blue line) shows higher absorption efficiency at high energies. (b) Quantum efficiency of PILATUS3 CdTe, as measured (dots) and simulated (blue dashed line).
2. Point spread function (PSF)
The PSF can be considered as the extent to which the information is contained within a pixel. For HPC detectors, the width of PSF depends on several parameters, such as incoming X-ray energy, internal fluorescence (Cd and Te escapes described above), and predefined energy threshold. As expected, monochromatic pencil-beam scans of the PILATUS’ 172 × 172 µm2 pixels at energies lower than 26.7 keV showed that the width of PSF corresponds to one pixel, as for the silicon-based detectors. However, PSF tends to broaden with the increase of the incoming X-ray energy and because of the internal fluorescence. The most prominent broadening is expected at X-ray energies close above the absorption edges of Cd at 26.7 keV. However, pencil-beam scans over single pixels showed that even at a critical energy such as 28 keV more than 85% of detected intensity is confined to the central pixel. At higher energies, the PSF was evaluated with polychromatic radiation, and the preliminary results show no significant decay. PSF measurements with monochromatic radiation are planned in the near future.
Having mentioned the internal fluorescence of CdTe sensor and its effect on PSF, it is also interesting to address the possibility to suppress both internal and sample fluorescence. This can be achieved by using the adjustable energy threshold in the range between 8 and 40 keV. In general, the optimal energy threshold corresponds to 50% of the incoming X-ray energy. If the energy threshold is separated more than the energy resolution from the fluorescence energy, fluorescence can be discriminated. The threshold energy resolution of PILATUS3 CdTe systems is less than 1 keVrms for energies below 30 keV, and it increases up to 2 keVrms at higher energies (Zambon et al., Reference Zambon, Christodoulou, Donath, Radicci, Rissi, Sakhelashvili, Schneebeli, Tudosie, Trueb and Broennimann2015). That is, far enough from the absorption edges of Cd and Te it is possible to suppress the internal fluorescence and obtain high-quality data, as evident from the examples presented in the following section.
3. Count rate linearity
The detector count rate linearity was assessed at 60 keV (Figure 3). The measured data (dots) were compared with the curve obtained by a Monte Carlo simulation (line) and to the theoretical response of an ideal detector (dashed line). Even at incoming rates as high as 5 × 10⁶ phts/s/pixel the deviation from the ideal curve only amounts to 25%. This small deviation can be corrected with high accuracy using the implemented count-rate corrections (Trueb et al., Reference Trueb, Dejoie, Kobas, Pattison, Peake, Radicci, Sobott, Walko and Broennimann2015).

Figure 3. (Colour online) Count rate linearity of the PILATUS3 CdTe reaches 5 × 10⁶ counts/s/pixel. Measured values (circles) fit to the simulated values (line). As a comparison, a response of ideal detector (dashed line) is shown.
B. HE-applications with PILATUS3 CdTe
The PILATUS3 CdTe 300K was tested at high-energy beamlines at several synchrotron sources: PETRA III at Deutsches Elektronen-Synchrotron (DESY), Germany; Advanced Photon Source (APS), USA; European Synchrotron Radiation Facility (ESRF), France; and Diamond Light Source (DLS), UK. The tests explore technical specifications in the context of HE-applications and answer the initial questions: is it possible to collect HE-data in the subsecond regime, and how does this relate to noise?
1. Powder X-ray diffraction
The quality of data that can be collected in the millisecond time range was examined at I12 beamline at DLS (Drakopoulos et al., Reference Drakopoulos, Connolley, Reinhard, Atwood, Magdysyuk, Vo, Hart, Connor, Humphreys, Howell, Davies, Hill, Wilkin, Pedersen, Foster, De Maio, Basham, Yuan and Wanelik2015). Two PXRD patterns of CeO2 sample were taken at 55 keV, using an exposure time of 1 ms and 0.2 mm or 5 mm slits. In both cases, the Scherrer rings were integrated, resulting in PXRD patterns with low-intensity peaks and an average background value close to zero (Figure 4). Such a background is a direct consequence of the noise-free detector performance and the quality of the CdTe sensor. This is particularly important for in situ investigations where the material is confined in a vessel, as the signals of the vessel may swamp the signal of the sample. In order to resolve the sample signal, obtaining a low background through noise suppression (scattering, fluorescence) is crucial.

Figure 4. (Colour online) PXRD pattern (t = 1 ms) reveals identifiable low-intensity peaks and average background close to zero (ID12, DLS).
2. Scattering measurements and PDF analysis
The opportunity of enhancing time-resolved X-ray scattering experiments with PILATUS3 CdTe was investigated at two beamline stations: HPCAT at APS and P02.1 at PETRA III, DESY.
At HPCAT (Shen et al., Reference Shen, Chow, Xiao, Sinogeikin, Meng, Yang, Liermann, Rod, Bommannavar and Mao2008) it was possible to measure diffuse scattering from a liquid Ga with a time exposure of 0.005 milliseconds at the energy of 30.5 keV. By increasing the exposure time to 1 millisecond, high-quality diffuse scattering patterns could be obtained (Figure 5). Compared with PILATUS3 with 450 µm thick silicon sensor, the CdTe sensor offers 10-fold efficiency increase with correspondingly shorter exposure times.

Figure 5. (Colour online) An exposure time as low as 0.005 ms allows scattering signal to be detected (pink), while 1 ms exposure time results in high-quality scattering data (red), (HPCAT, APS).
The DESY group investigated the correlation between exposure time and data quality using the data collected on Fe73.5Cu1Nb3Si15.5B7 amorphous ribbons at 60 keV (Bednarcik and Liermann, Reference Bednarcik and Liermann2016). Twenty patterns were measured using the exposure time of 0.1 s. The standard deviation (σ) of the residual curve (obtained by subtracting the spline from the experimental profile) was calculated for a single pattern and a number of merged patterns. As expected, σ of the measurement was found to decrease with the number of measured patterns, following the σ ∝ N 1/2 relation (Figure 6). Single pattern (t = 0.1 s, σ = 0.07) was found to be suitable for reliable calculations of PDF up to 18 Å (Figure 7). Thus, it can be proposed that the rapid PDF measurements can be carried out in a subsecond regime, where the achievable Q-values are limited by the size of the detector – in this case 487 × 619 pixels, and generally 1475 × 1679 pixels for the currently largest available system, the PILATUS3 X CdTe 2M.

Figure 6. (Colour online) Standard deviation of the residual curve drops exponentially with the number of merged patterns.
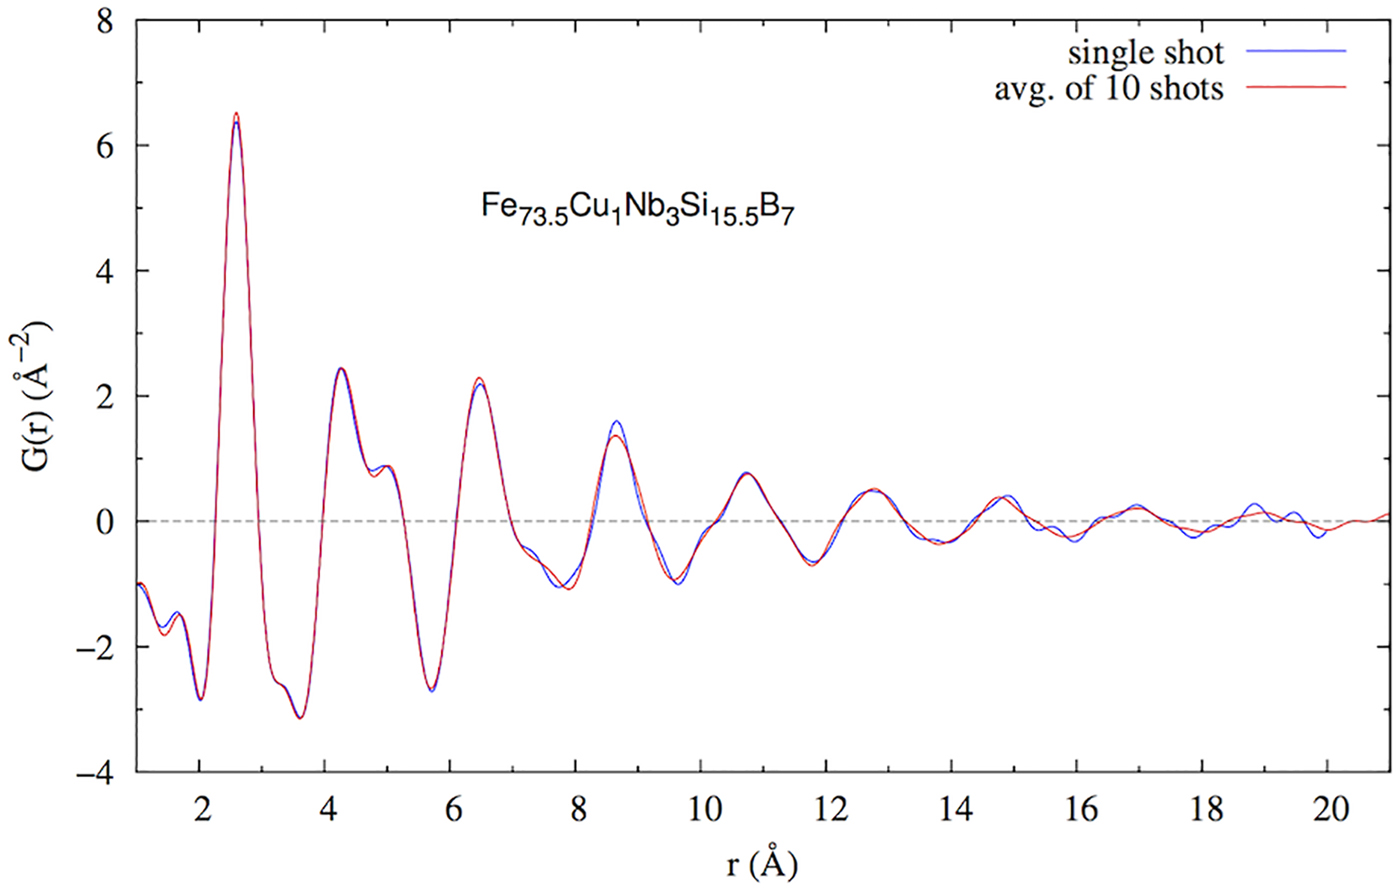
Figure 7. (Colour online) Single scattering pattern (t = 0.1 s, σ = 0.07) can be used for calculations of PDF up to 18 Å.
3. XRD-computed tomography
The first XRD-CT measurements made with the PILATUS3 CdTe 300K detector were a part of a broader investigation of catalytic membrane reactor. The aim of the study was to monitor oxidative coupling of methane processes in operando. The data taken at beamline I15A at ESRF at 93 keV revealed the presence of a new phase at the interface between the catalyst and membrane, which compromises the long-time stability of the reactor (Vamvakeros et al., Reference Vamvakeros, Jacques, Middelkoop, Di Michiel, Egan, Ismagilov, Vaughan, Gallucci, van Sint Annaland, Shearing, Cernik and Beale2015). The same group of authors used the detector to test the new data collection strategy, which enables a post-experimental choice between the temporal and spatial resolution. The interlaced XRD-CT is based on the collection of subsequent XRD-CT scans with low spatial but high temporal resolution. If these scans are combined (post-experimental), the spatial resolution can be increased (Vamvakeros et al., Reference Vamvakeros, Jacques, Di Michiel, Senecal, Middelkoop, Cernik and Beale2016). Proof-of-the concept tests were based on the acquisition time of 50 ms per point. Shortly after the tests with the PILATUS3 CdTe 300 K, the first PILATUS3 X CdTe 2M was delivered to the beamline.
IV. CONCLUSION
Data obtained using the PILATUS3 CdTe detector at several beamlines, operating under different setups, and addressing different applications illustrate significant reduction of acquisition time and increase in data quality. In the setups used, ex and in situ PXRD measurements, and scattering studies can be carried out in millisecond time range, and high-resolution XRD-CT data can be obtained in a matter of seconds. Data quality is enhanced by noise suppression, resulting in the low background, what enables reliable detection of very low intensities, and better separation of signals arising from the sample and the measurement vessel. Standard uncertainties of the 2D data can be calculated in a more straightforward manner, as the detector operates in the counting mode. The reduction of measurement time and the improvement of the data quality are a direct consequence of the detector's high quantum efficiency at high energies and its noise-free performance.
ACKNOWLEDGEMENTS
The authors would like to thank Michael Rissi, Valeria Radicci, Pietro Zambon, Peter Trüb (DECTRIS) for the data on detector characterization; Stanislav Sinogeikin (HPCAT, APS), Michael Drakupoulos (ID12, DLS) for the data collection and Stefan Brandstetter (DECTRIS) for providing the test detector.
FUNDING
Equipment, time, and manpower required for this work were provided by DECTRIS, Diamond Light Source, and DESY.
CONFLICT OF INTERESTS
The authors have no conflicts of interest to declare.


