INTRODUCTION
It is a well known fact that to analyze cement products, X-ray fluorescence spectrometry (XRF) is the standard analytical technique. Prior to the 1990s, sample preparation by pressed powder and fusion were both accepted to analyze cement products and related raw materials (Anzelmo, Reference Anzelmo2009). The 2010 reality of the cement industry is not the same as in the past. A substantial cement production increase using alternative raw materials and additives involving secondary fuels and the use of reference materials from various sources makes use of pressed powder less ideal method. This factor comes from the necessity of matrix matching to increase or optimize the accuracy of the analytical technique (Bouchard et al., Reference Bouchard, Anzelmo, Arias, Behrens, Durali-Müller, Rivard and Seyfarth2009). The fusion preparation technique simplifies laboratory work by using less calibration curves. Why? Because this technique solves the particle size and mineralogy effects associated with the use of pressed powders (Anzelmo, Reference Anzelmo2009; Spangenberg and Fontboté, Reference Spangenberg and Fontboté1994). All these reasons motivated our efforts to develop a global and unique fusion method for the preparation of all cements, processed materials, as well as a very large range of raw materials.
We are also face with other realities in 2010, such as the importance we contribute to time and money. This fact motivated our efforts to develop an alternative cement for finished products analytical method, implemented to optimize profitability. This second method was developed in compliance to ASTM C 114 and ISO/DIS 29581-2 specifications of the precision and accuracy requirements. Sample preparation by fusion and WDXRF analysis were selected to fulfill these requirements.
EXPERIMENT (RAW MATERIAL ANALYTICAL APPLICATION)
Instrument conditions
All information regarding instruments, sample preparation methodology development, final optimized conditions of using a Claisse M4 fluxer, and robust analysis of the preparation method for sample preparation by fusion was presented in the previous paper (Bouchard et al., Reference Bouchard, Anzelmo, Arias, Behrens, Durali-Müller, Rivard and Seyfarth2009).
In the following, a Bruker-AXS S4 Explorer sequential wavelength-dispersive X-ray fluorescence (WDXRF) spectrometer with a rhodium end-window X-ray tube of 1000 W was used for data generation. The spectrometer analytical conditions, peak-line, background measurements, background position, pulse-height, counting time, and other parameters were defined and optimized by the wavelength step-scanning of standard disks representative of the application. The spectrometer analytical conditions for the measurement of all the elements used for the raw materials application are listed in Table I. Analytical lines for certain elements were
TABLE I. Spectrometer operation parameters for raw materials application.

1 FPC=as flow proportional counter; SC=scintillation counter.
2 Low bkd and high bkd=value for lower and higher background when used.
added to the analysis method because the reference values for these elements were available from the raw materials reference materials (RMs). A 28 mm collimator mask as well as a vacuum were used for all the measurements.
Calibration preparation
To calibrate the raw materials application with the WDXRF RM from different origins, the following were used:
• Bureau of Analyzed Samples Ltd. CRM-393 and CRM-513 limestone
• European Committee for Iron and Steel Standardization EURO-CRM 701-1
• European Coal and Steel Community EURO-CRM 776-1
• Domtar Research Center RM GYP-C, GYP-D, and GYP-4 gypsum
• JCA Reference Materials for X-ray Fluorescence Analysis 601A Series XRF-01 to XRF-15 cements and slag cements series
• JCA Reference Materials for X-ray Fluorescence Analysis RM-612 cement
• Natural Resources Canada RM FER-2 to FER-4 iron ores series
• NIST Standard Reference Material® (SRM) 88b dolomitic limestone
• NIST Standard Reference Material® (SRM) 698 Jamaican bauxite
• NIST Standard Reference Material® (SRM) 1880a to 1889a cement series
• NIST Standard Reference Material® (SRM) 2689 to 2691 coal fly ashes series
• NIST Standard Reference Material® (SRM) 2696 silica fume
• 16 RM mixes from this listing to cover the holes in the calibration
TABLE II. RM element concentration as an oxide equivalent.

TABLE III. Interelement corrections and squared correlation coefficients for raw materials application.
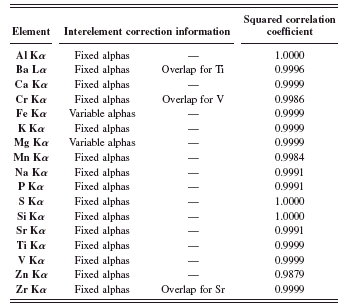
TABLE IV. Raw materials application results.

1 Max. Dev.=Maximum deviation.
TABLE V. Spectrometer operation parameters for rapid cement fusion application.

1 FPC=gas flow proportional counter; SC=scintillation counter.
2 Low bkd and high bkd=value for lower and higher background when used.
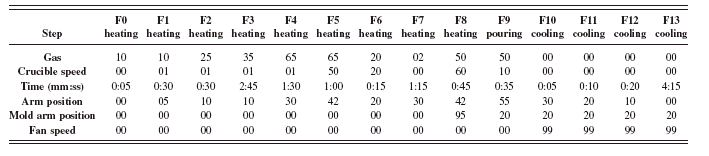
TABLE VI. Automatic fusion program parameters for rapid cement fusion method.

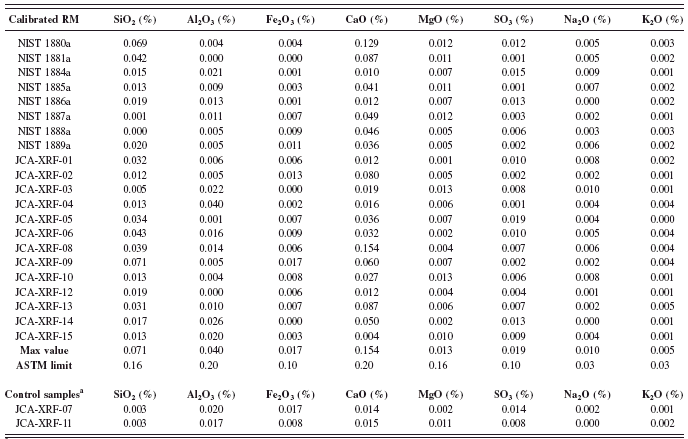
TABLE VII. RM element concentration as oxide equivalent and control samples.

1 Control samples: One or more certified RM, not used in the calibration and having a composition within the calibration range for each element to be analyzed. When only one validation certified RM is to be used, select a sample in the middle of the concentration ranges. Where several validation certified RMs are used, select samples covering high and low values (ISO/DIS 29581-2:2007).
Table II demonstrates the certified element concentration ranges in both the original sample base and the ignited base.
Two sets of the different standard glass disks were produced. The first set was used for calibration. Once the calibration was completed, the two sets of standard glass disk were analyzed as unknown. The results were then used to evaluate the precision and the accuracy of the methodology.
RESULTS AND DISCUSSION (RAW MATERIAL ANALYTICAL APPLICATION)
Calibration
Table III enumerates the interelement corrections that were used as well as their type. Also displayed are the squared correlation coefficients from the calibration curves of the analyzed elements.
Sensitivity, precision, and accuracy results
Table IV illustrates the results obtained from assessing sensitivity, precision, and accuracy. Using the spectrometer software, the sensitivity results were captured using the lower limit of detection (LLD). Precision was evaluated on an absolute concentration base (%) by calculating the maximum difference between the results of the analyzed elements for the duplicate preparations of all reference materials used in the calibration. The accuracy evaluation was determined on an absolute concentration base (%) by calculating the maximum difference of the two results obtained from the duplicates against the certified value over all the reference materials used in the calibration. The standard deviation was calculated by the software and is also presented in this table. The results proved excellent accuracy and precision despite the wide range of elements.
EXPERIMENTAL (RAPID CEMENT FUSION APPLICATION)
Instrument conditions
The same fusion and spectrometry instruments were used for the rapid cement fusion application. The specific
TABLE VIII. Interelement corrections and squared correlation coefficients for rapid cement fusion application.
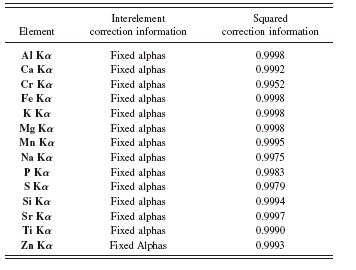
TABLE IX. ASTM C114: Precision test results (part 1).
1 Results of control samples are included in the calculation for maximum value.
TABLE X. ASTM C114: Precision test results (part 2).

1 Results of control samples are included in the calculation for maximum value.
TABLE XI. ASTM C114: Accuracy test results (part 1).

1 Abs. Max Er.=Absolute maximum error.
2 Results of control samples are included in the calculation for Abs. Max. Er.
TABLE XII. ASTM C114: Accuracy test results (part 2).

1 Abs. Max Er.=Absolute maximum error.
2 Results of control samples are included in the calculation for Abs. Max. Er.
TABLE XIII. ISO: Precision test results of control sample JCA-XRF-07 (part 1).

TABLE XIV. ISO: Precision test results of control sample JCA-XRF-07 (part 2).

TABLE XV. ISO: Precision test results of control sample JCA-XRF-11 (part 1).
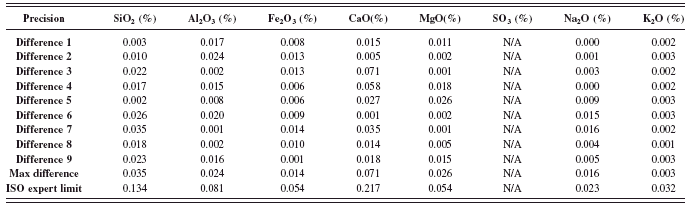
TABLE XVI. ISO: Precision test results of control sample JCA-XRF-11 (part 2).

TABLE XVII. ISO: Accuracy test results of control sample JCA-XRF-07 (Part 1).

spectrometer analytical conditions for the measurement of all elements in raw materials analytical application are listed in Table V.
Fusion method development
Only nonignited materials were fused to develop this rapid fusion method for cement finished products. A number of dry oxidation step tests were completed on the fusion instrument and were evaluated with different oxidizers. Different sample to flux ratios were also evaluated (1:3, 1:4, 1:5, and 1:6).
Global sample preparation method
An Optimix (available at Corporation Scientifique Claisse, www.claisse.com) crucible and a 32 mm diameter, 1 mm thick mold composed of 95% Pt/5% Au alloy were used. Pure grade prefused flux (available at Corporation Scientifique Claisse, www.claisse.com) composition of 49.75% lithium tetraborate (LiT), 49.75% lithium metaborate (LiM), containing integrated 0.50% LiBr nonwetting agent was selected to produce stable sample preparation. The maximum temperature was controlled not to exceed a temperature of 1050°C because over this critical point, flux begins to volatilize and the sample to flux ratio (Loubser et al., Reference Loubser, Strydom and Potgieter2004) can be affected without consistency. Volatile compounds from samples like SO3 also begin to evaporate when lacking consistency (Spangenberg and Fontboté, Reference Spangenberg and Fontboté1994).
Results of fusion method development
It was determined that dry oxidation at the beginning of the fusion process is absolutely necessary during the analytical process when using the rapid cement analytical fusion method. This essential step allows the fusion of cements with additions like a number of slag cements, known to contain under oxidized material. Some of these new cement products are impossible to fuse in the nonignited state without using an oxidizer. A preparation with a sample to flux ratio of 1:4 needed a fusion program consisting of 3 min of heating between 800 and 950°C and 6 min with heating at 1025°C to prepare stable glass disks. The cooling process is performed using forced air around 5 min, thus allowing the glass disks to be safely removed. More than 60 different finished products, including a series that is known to contain the higher level of under oxidized materials, were successfully fused with this methodology. This rapid cement fusion method demonstrated good efficiency to prepare homogeneous and stable lithium borate glass disks with all the cement finished products.
TABLE XVIII. ISO: Accuracy test results of control sample JCA-XRF-07 (Part 2).

TABLE XIX. ISO: Accuracy test results of control sample JCA-XRF-11 (part 1).

Step by step procedure
First, 1.3000 g of nonignited sample is weighed with ±0.0001 g precision in a clean and dry crucible. Then, 0.700 g of LiNO3 ACS grade oxidizer is weighed with a precision of ±0.005 g. Finally, 5.3000 g of Claisse LiT/LiM/LiBr: 49.75/49.75/0.50, Pure Grade Flux is weighed with ±0.0003 g precision on top of other materials. A vortex mixer is used to blend everything together. Vortex mixer’s speed was controlled so as not to lose material. Variance of the flux to sample weight ratio causes error in the results (Berube et al., Reference Berube, Rivard and Anzelmo2008). The M4 fluxer fusion program parameters, including dry oxidation, are shown in Table VI.
Preparation for calibration, selection of control samples, and preparation for validation
The objectives of the second part of this project were to develop a faster analytical application, including the calibration of a WDXRF with the two sets of RM from NIST Series 1880a, 1881a, and 1884a to 1889a and JCA Series XRF-01 to XRF-15. The ultimate objective of the rapid cement application was to comply with the ASTM and ISO analysis standard methods requirements. The standard methods have two different philosophies. ASTM uses SRMs to verify precision and accuracy on two different days (ASTM, 2008). ISO validates repeatability of the method using one or more RM as a control sample that has not been included in the calibration over the past 2 weeks (DIN EN ISO 29581-2, 2007). It is also important to note that for the verification of ASTM, the results should include LOI, but that for ISO, LOI free results are needed. Table VII displays the concentration range as an oxide equivalent for both RM sets and for the combination of the two sets. Control samples’ oxide concentrations are also listed in this table. These control samples were selected to validate rapid cement fusion/XRF method with the ISO standard method.
Two sets of glass disks including each RM was prepared for the calibration of the XRF instrument and for the qualification of the rapid method with ASTM Standard Test Method C 114; one on the first day and the second the following day (less than 24 h apart) (ASTM, 2008). To validate the analytical method using ISO, 10 glass disks of control samples JCA-XRF-07 and JCA-XRF-11 were prepared within 15 days (less than 2 weeks) (DIN EN ISO 29581-2 l, 2007). The control sample glass disks were analyzed on the spectrometer the day of preparation.
EXPERIMENTAL RESULTS AND DISCUSSION (RAPID CEMENT FUSION APPLICATION)
Calibration
The two RM series from NIST and JCA (except the control samples) were used to build the calibration curves. Table VIII
TABLE XX. ISO: Accuracy test results of control sample JCA-XRF-11 (part 2).

lists the element and interelement corrections type used for every analytical line. The squared correlation coefficients from the calibration curves were extracted from the software.
ASTM precision and accuracy
The ASTM precision test was conducted as described in method (ASTM, 2008). The duplicates in this standard method are two disks that were prepared on two different days and for each RM (one every day). The results presented in Tables IX and X are the absolute difference of the duplicate results for all analyzed oxide. The maximum results of every RM used in the calibration are shown and compared to the ASTM precision limit. The maximum values of all the elements obtained are well within the limits, which confirm that ASTM C114 precision specifications meet the requirements.
The ASTM accuracy test was conduct as described in the method (ASTM, 2008). The results shown in Tables XI and XII are the absolute difference of the average of duplicates from the RM certified values for all the analyzed elements. The absolute maximum errors calculated among the entire RMs used in the calibration are shown and compared to the ASTM accuracy limit. The maximum values obtained from all the oxides meet the specifications and are well within the limits.
ISO precision and accuracy
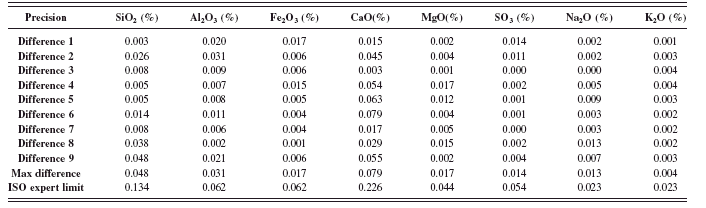
The ISO limits for precision and accuracy are not fixed limits like those of the ASTM C 114. The ISO limits are pending the concentration of the oxides in the control samples analyzed. The ISO precision test was conducted as described in the method (DIN EN ISO 29581-2 l, 2007). The absolute differences shown in Tables XIII – XVI were calculated with the successive results obtained from the control samples. The maximum absolute difference for all oxides are shown and compared to the ISO expert precision limit. The results obtained from this test meet the specified limits for the two different control samples.
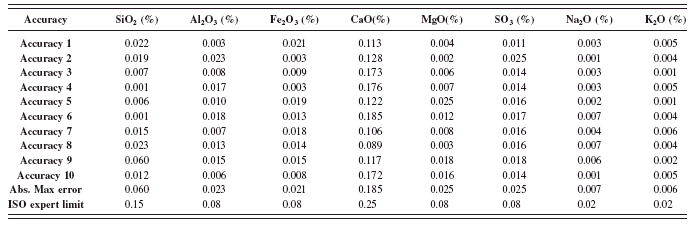
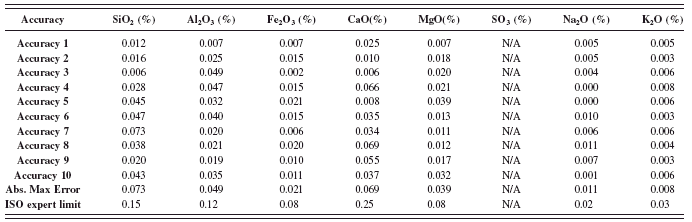
The ISO accuracy test was conducted as described in the method (DIN EN ISO 29581-2 l, 2007). The accuracy values shown in Tables XVII – XX were calculated by using the difference between the results obtained from ten preparations performed over 15 days against the certified values. The absolute maximum error for all oxides are shown and compared with the ISO expert accuracy limit. Accuracy limits were all met by both control samples.
CONCLUSIONS
A global fusion/XRF analytical method for cement industry materials has been described in this paper as well as in the previous paper (Bouchard et al., Reference Bouchard, Anzelmo, Arias, Behrens, Durali-Müller, Rivard and Seyfarth2009). This method of preparation by fusion allows fusing cements and all the raw materials normally found in a cement plant. The overall method complies with the precision and accuracy requirements of the international standard methods for cement analysis (ISO/DIS 29581-2 and ASTM C 114).
In this paper, it was proven that it is possible in the 21st century to obtain a precise and accurate calibration able to cover the wide range of raw materials used by the global cement industry. The range of materials include cement, blended cement, cements with additions, aluminate cement, clinker, kiln feed, raw mix, limestone, gypsum, sand, clay, bauxite, silica fume, slag, fly ash, and iron ore, just to name a few.
As second part of the project, a rapid cement fusion/XRF methodology was developed to analyze the cement industry’s finished products. This method is useful when fast results are needed as is the case for clinker, cement, and cement with addition. This method enables the preparation and analysis of samples in less than 30 min. This faster fusion method combined with the XRF spectrometer also complies with both cement analysis standard methods: ASTM C 114 and ISO/DIS 29581-2.
ACKNOWLEDGMENTS
The authors thank Luc Bérubé of the Corporation Scientifique Claisse for his implication in the management of the project. In addition, the authors would also like to thank Mélissa Desbiens and Benoît Robitaille of the Corporation Scientifique Claisse for their devoted work in the laboratory.