


I. INTRODUCTION
“SFCA” (Silico-Ferrite of Calcium and Aluminium) phases are key bonding materials of industrial iron ore sinter. Sinter is a major feedstock material of blast furnaces, utilised extensively worldwide in the production of steel from iron ore. During the iron ore sintering processes, iron ore fines (the <6.3 mm fraction of iron ore) are mixed with flux [e.g. limestone, CaCO3, and usually also dolomite, CaMg(CO3)2, or other Mg-bearing minerals such as olivine, (Fe,Mg)2SiO4, and serpentine (Mg,Fe)3Si2O5(OH)4] and coke breeze and heated rapidly (~4 min) to temperatures of ~1300 °C followed by slower cooling in air (Dawson et al., Reference Dawson, Ostwald and Hayes1985). This results in partial melting and the formation of a porous but physically strong composite material in which the iron-bearing minerals hematite, Fe2O3, and magnetite, Fe3O4 (including relict ore particles) are bonded by a complex matrix containing predominantly “SFCA” phases, as well as other Ca-rich ferrite phases, calcium silicates and glass (quenched liquid).
The “SFCA” in iron ore sinter has been categorised on the basis of composition, morphology, and crystal structure into two main types. The first is a low-Fe form called SFCA, which typically contains 60–76 wt% Fe2O3, 13–16 wt% CaO, 3–10 wt% SiO2, and 4–10 wt% Al2O3 (Hancart et al., Reference Hancart, Leroy and Bragard1967; Ahsan et al., Reference Ahsan, Mukherjee and Whiteman1983). The second is a high-Fe, low-Si (e.g. 84 wt% Fe2O3, 13 wt% CaO, 1 wt% SiO2, and 2 wt% Al2O3) form called SFCA-I (Mumme et al., Reference Mumme, Clout and Gable1998). The crystal structures of SFCA and SFCA-I are distinct (Hamilton et al., Reference Hamilton, Hoskins, Mumme, Borbidge and Montague1989; Mumme et al., Reference Mumme, Clout and Gable1998). A number of recent investigations have utilised in situ powder diffraction techniques – laboratory-based X-ray diffraction (XRD), synchrotron XRD, and neutron diffraction – in order to determine the formation mechanisms of SFCA and SFCA-I under simulated sintering conditions (Webster et al., Reference Webster, Pownceby, Madsen and Kimpton2012, Reference Webster, Pownceby, Madsen and Kimpton2013a, Reference Webster, Pownceby and Madsen2013b, Reference Webster, Pownceby, Madsen, Studer, Manuel and Kimpton2014, Reference Webster, O'Dea, Ellis and Pownceby2017).
Sintering technology can also be applied to unconventional sources of ferrous materials including low-grade iron ore (e.g. titanium-rich ironsands) or by-products from iron and steel making processes such as mill scale and collected dusts. In a recent series of publications by Wang et al. (Reference Wang, Pinson, Chew, Rogers, Monaghan, Pownceby, Webster and Zhang2016a) and Webster et al. (Reference Webster, Churchill, Tufaile, Pownceby, Manuel and Kimpton2016), the effects of New Zealand titanomagnetite ironsand – containing 7.9 wt% Ti – addition on the formation of SFCA and SFCA-I iron ore sinter bonding phases was determined. Ironsand is a relatively cheap source of iron, and the introduction of a minor amount of titanium-bearing ore into the blast furnace burden has been demonstrated to extend blast furnace operating campaigns because of the formation of titanium carbonitrides on the hearth lining (Li et al., Reference Li, Li and Fruehan2001). Increasing ironsand addition from 1.3 to 6.7 and to 13.8 wt% in an otherwise synthetic sinter mixture composition designed to form SFCA-I did not significantly affect the thermal stability range of SFCA-I, nor did it significantly affect the maximum concentration of SFCA-I attained. The main effect of ironsand addition was a small reduction in the thermal stability range of another complex calcium-rich ferrite, γ-CFF (nominal composition Ca3.0Fe14.82O25). In comparison, increasing ironsand addition from 2.4 to 3.9 and to 11.6 wt% in an otherwise synthetic sinter mixture composition designed to form SFCA resulted in a decrease in the maximum SFCA-I concentration, with a corresponding increase in the concentration of SFCA. Separate phase equilibria studies revealed that SFCA can incorporate more titanium in its structure (up to 1.2 wt% TiO2) than SFCA-I (0.6 wt% TiO2), which was thought to explain the behaviour in the mixtures designed to form SFCA.
The current paper concerns the effects of adding another unconventional source of iron, mill scale. Mill scale is an Fe-rich (65–70% Fe) waste product containing wüstite (FeO), magnetite and hematite, which is formed on the surface of steel as a result of oxidation during continuous casting, reheating, and hot-rolling operations (Birks et al., Reference Birks, Meier and Pettit2006). Mill scale is often recycled through the sintering process with the exothermic oxidation of wüstite and magnetite providing a reduction in the coke breeze addition (Umadevi et al., Reference Umadevi, Brahmacharyulu, Karthik, Mahapatra, Prabhu and Ranjan2012). Here, the effect of mill scale addition on the formation of SFCA and SFCA-I under simulated sintering conditions is investigated using in situ XRD. As part of the study the thermal decomposition of mill scale was also characterised in order to understand how its breakdown may influence the formation of SFCA and SFCA-I during heating.
II. EXPERIMENTAL
A. Sample preparation
The mill scale has previously been characterised (Wang et al., Reference Wang, Pinson, Chew, Monaghan, Pownceby, Webster, Rogers and Zhang2016b). In summary, its bulk composition is 71.0 wt% total Fe, 0.2 wt% CaO, 0.1 wt% Al2O3, 0.9 wt% SiO2, 0.2 wt% MgO, and 0.6 wt% Mn. Its relative crystalline mineral phase composition determined by XRD is 53 wt% wüstite, 35 wt% magnetite, 10 wt% hematite, and 1 wt% goethite (minor green rust, Fe2O3.H2O, also observed). The mill scale was added in progressively higher amounts to fine grained (<20 µm) synthetic Fe2O3 (Acros Organics, 99.999% purity), calcite, CaCO3 (Thermo Fisher, 99.95%), quartz, SiO2 (Sigma Aldrich, 99.995%), and gibbsite, Al(OH)3 (Alcan OP25 Super White, 99.9%), which were mixed under acetone in a mortar and pestle with an intermediate drying and remixing stage to ensure homogenisation. Three sinter mixtures were prepared, with mill scale contents of 2.6–10.6 and to 21.2 wt%. Each mixture had bulk composition – 77.36 wt% Fe2O3, 14.08 wt% CaO, 3.56 wt% SiO2, and 5 wt% Al2O3 – matching that of the bulk composition investigated in detail previously by Webster et al. (Reference Webster, Pownceby, Madsen and Kimpton2012, Reference Webster, Pownceby, Madsen and Kimpton2013a, Reference Webster, Pownceby, Madsen, Studer, Manuel and Kimpton2014, Reference Webster, Churchill, Tufaile, Pownceby, Manuel and Kimpton2016), and within the SFCA compositional stability domain established by Patrick and Pownceby (Reference Patrick and Pownceby2001) (i.e. each mixture was designed to form SFCA during heating).
B. In situ XRD data collection
Details of the in situ XRD experimentation have been described in detail previously (Webster et al., Reference Webster, Pownceby, Madsen and Kimpton2013a, Reference Webster, Pownceby and Madsen2013b, Reference Webster, Churchill, Tufaile, Pownceby, Manuel and Kimpton2016, Reference Webster, O'Dea, Ellis and Pownceby2017). The mill scale sample, and the three sinter mixture samples were heated over the range 20–1350 °C, at a heating rate of 20 °C min−1 from 20 to 600 °C as the decomposition temperature of CaCO3 was approached, and with individual datasets collected for 1 min continuously during heating. The rate was then reduced to 10 °C min−1 for the range 600–1350 °C, which corresponded to the period of Ca-rich ferrite phase formation, reaction and decomposition for the sinter mixture samples. Samples were heated under a flow of a 0.5 vol% O2 in N2 gas mixture (to give a nominal oxygen partial pressure of pO2 = 5 × 10⁻³ atm). The oxygen partial pressure has been used in all of our in situ XRD work, and the selection was based on the work of Hsieh and Whiteman (Reference Hsieh and Whiteman1989) who determined that this pO2 maximised the formation of Ca-rich ferrites whilst still producing mineral assemblages similar to those found in industrial sinters.
C. In situ XRD data analysis
Rietveld refinement-based QPA was performed using TOPAS (Bruker, 2014). The crystal structure data of Blake et al. (Reference Blake, Hessevick, Zoltai and Finger1966), Hamilton (Reference Hamilton1958), Fjellvåg et al. (Reference Fjellvåg, Grønvold, Stølen and Hauback1996), Hazemann et al. (Reference Hazemann, Berar and Manceau1991), and Lager et al. (Reference Lager, Jorgensen and Rotella1982) were used for Fe2O3, Fe3O4, FeO, FeOOH and SiO2, respectively. Corrections to account for sample displacement and peak intensity variation in asymmetric diffraction geometry were incorporated into the TOPAS refinement. The use of the Hill and Howard QPA algorithm (Hill and Howard, Reference Hill and Howard1987) embodied in TOPAS returns relative, rather than absolute, concentrations for crystalline phases in a system if amorphous material, including melt phases, are present. The previous in situ work performed in this context has demonstrated amorphous Al2O3 is present in these systems after the decomposition of Al(OH)3. Therefore, absolute phase concentrations as a function of temperature were determined using the “external standard” approach given by Webster et al. (Reference Webster, Pownceby and Madsen2013b)
 $$W_i = \displaystyle{{\mu _mS_i{(ZMV)}_i} \over K}$$
Here W i is the weight fraction of phase i, S i is the Rietveld scale factor, ZM is the unit-cell mass, V is the unit-cell volume, and μ m is the mass absorption coefficient of the entire mixture. K is an experiment constant used to put W i on an absolute basis. It was calculated using the “known” concentrations of phases in the starting sample (the assumption is made that the sample is 100% crystalline), and the Rietveld-refined S values for phases in the sample in the first dataset collected at 20 °C according to
 $$K = \displaystyle{{\mu _m\sum\nolimits_{i = 1}^n {S_i{(ZMV)}_i}} \over {\sum\nolimits_{i = 1}^n {W_i}}} $$
D. Ex situ XRD data collection and analysis
Ex situ XRD data were collected on the mill scale sample, mixed in a 50:50 wt ratio with a very high purity and highly crystalline corundum (α-Al2O3; Baikalox Alumina Polishing Powder), over the range 5°–140°2θ using a PANalytical MPD instrument fitted with a cobalt long-fine-focus X-ray tube operated at 40 kV and 40 mA. The incident beam path was defined using 0.04 radian Soller slits, a 20 mm mask, a 0.5° fixed divergence slit, and a 1° anti-scatter slit. The diffracted beam incorporated a second set of Soller slits, a graphite monochromator to eliminate unwanted wavelengths and a 4.6 mm anti-scatter slit. An X'Celerator detector was used in scanning line (1D) mode with an active length of 2.122°2θ. Quantitative phase analysis was performed using the internal standard method (Madsen and Scarlett, Reference Madsen, Scarlett, Dinnebier and Billinge2008), in order to calculate the amorphous content of the mill scale.
III. RESULTS AND DISCUSSION
A. Thermal decomposition of mill scale
Figure 1 shows a plot of accumulated in situ XRD data, viewed down the intensity axis and with temperature plotted vs. 2θ, for the experiment performed just using the mill scale sample. Figure 2 shows the results of the Rietveld-based QPA on these in situ XRD data, showing absolute phase concentrations as a function of temperature. Based on known phase equilibria between hematite/magnetite and magnetite/wüstite at a pO2 of 5 × 10⁻³ atm, magnetite should be the stable Fe-oxide phase between about 1180 and 1750 °C (Huebner, Reference Huebner and Ulmer1971). Wüstite begins transforming first to magnetite at temperatures as low as ~300 °C. At these low temperatures, even though the pO2 is at 5 × 10⁻³ atm, the Fe-oxide stability field is for hematite. As the temperature is further increased, the hematite is transformed to magnetite with a transition beginning above 1150 °C and being completed by 1300 °C. Graininess of this Fe3O4 above 1250 °C results in poor particle statistics, which has an influence on the QPA in this region.

Figure 1. (Colour online) In situ XRD data collected for the mill scale sample, viewed down the intensity axis, over the range 20–1350 °C at pO2 = 5 × 10⁻³ atm.
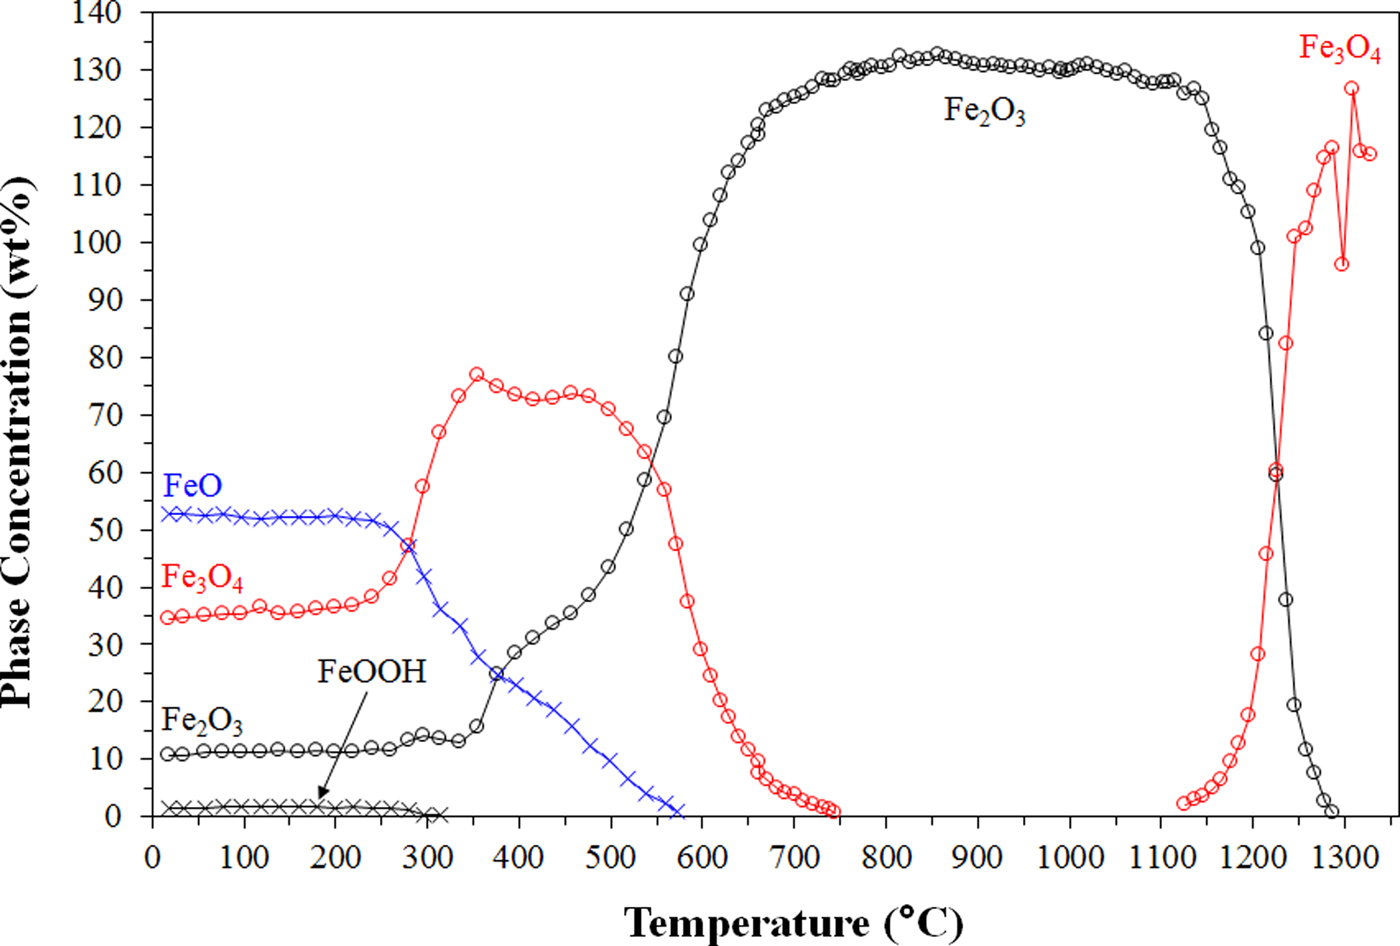
Figure 2. (Colour online) Results of Rietveld-based quantitative phase analysis, showing absolute phase concentrations as a function of temperature, for the mill scale sample.
What is striking about the QPA plot is that the calculated absolute Fe2O3 concentration at 850 °C, which is after all of the crystalline FeO and Fe3O4 has oxidised, is 133 wt% and greater than was expected (106 wt%) from the sample gaining oxygen during heating. This means that there is unaccounted-for amorphous material in the mill scale sample at room temperature, which crystallises during heating. The results of the internal standard-based determination outlined in the section IID confirm this. Since the mill scale sample exhibited negligible loss on ignition (Wang et al., Reference Wang, Pinson, Chew, Monaghan, Pownceby, Webster, Rogers and Zhang2016b) this amorphous material is considered likely to be amorphous/nanocrystalline Fe-oxide material, rather than hydrated mineral(s). This work demonstrates the power of in situ XRD, combined with the external standard approach to QPA, for gaining insights into the quantity and nature of amorphous material in mineral mixtures.
Another noteworthy feature of the data shown in Figure 1 is the shift of the FeO reflections to lower 2θ (i.e. unit cell expansion) as this phase converts to Fe3O4. This is considered to indicate that the wüstite at room temperature is non-stoichiometric (i.e. Fe1−x O), since the lattice parameter of Fe1−x O is smaller than that of FeO (Minervini and Grimes, Reference Minervini and Grimes1999). The wüstite appears to become more stoichiometric as it converts to Fe3O4 during heating. A small shift to higher 2θ (i.e. unit cell contraction) as the FeO converts to Fe2O3 is attributed to the smaller size of Fe3+ relative to Fe2+ (Shannon, Reference Shannon1976).
B. Effects of mill scale addition on SFCA-I and SFCA formation
Figure 3 shows the plot of accumulated in situ XRD data for the 21.2 wt% mill scale mixture. Reflections for Fe2O3, Fe3O4, Fe1−x O, CaCO3, α-SiO2, and Al(OH)3 were observed at room temperature. The first event during heating (note that only the events distinct from those discussed in the section IIIA are discussed here) was the decomposition of Al(OH)3 to amorphous Al-oxide, which was complete by ~300 °C. Then, CaCO3 decomposed to CaO, which was complete by ~680 °C. The first Ca-rich ferrite to form was alumina-substituted dicalcium ferrite [designated hereafter as C2(F1−x A x ) at ~800 °C, followed by CF (i.e. monocalcium ferrite, where C = CaO and F = Fe2O3] and CFA (a phase with average composition 71.7 mass% Fe2O3, 12.9 mass% CaO, 0.3 mass% SiO2, and 15.1 mass% Al2O3) (Webster et al., Reference Webster, Pownceby, Madsen and Kimpton2012) at ~960 °C. As the temperature increased further, SFCA-I and SFCA formed at ~1110 and 1160 °C, respectively. Melting, which was complete by ~1260 °C, produced a phase assemblage of Fe3O4 in a Fe2O3–(Fe3O4)–CaO–SiO2–Al2O3-rich melt. Each of these temperatures is consistent with those reported by Webster et al. (Reference Webster, Pownceby, Madsen and Kimpton2012) for the mixture SM4/5, which had the same bulk composition as the 21.2 wt% mill scale mixture analysed here, but did not contain mill scale. This suggests that the addition of mill scale has minimal effect of the formation of SFCA-I and SFCA.

Figure 3. (Colour online) In situ XRD data collected for the 21.2 wt% mill scale mixture.
Figure 4 shows stack plots of the in situ XRD collected for the 2.6, 10.6, and 21.2 wt% mixtures in the range 1100–1310 °C. Indeed, the effect of increasing mill scale concentration of the formation of the SFCA-I and SFCA phases does appear to be minimal. This is attributed, firstly, to the low impurity (i.e. Mg, Mn) content in the mill scale. Secondly, any Fe2O3 which forms through oxidation of the FeO and Fe3O4 in the mill scale only begins to convert to Fe3O4 above ~1150 °C (see Figures 1 and 2) and so no appreciable conversion of Fe2O3 to Fe3O4, which is unreactive in the context of SFCA-I and SFCA phase formation (Webster et al., Reference Webster, Pownceby, Madsen and Kimpton2013a), can occur before formation of SFCA-I and SFCA and the Fe2O3 is available for reaction to form the SFCA phases. If the pO2 the experiments were conducted under was more reducing, then the effect of mill scale addition would likely become significant, in accordance with the results of Wang et al. (Reference Wang, Pinson, Chew, Monaghan, Pownceby, Webster, Rogers and Zhang2016b).

Figure 4. Stack plots of the in situ XRD collected for the (a) 2.6, (b) 10.6, and (c) 21.2 wt% mixtures in the range 1100–1310 °C. Datasets are offset in the vertical axes for clarity. The temperature values provided are those at the start – which is when the temperatures were automatically recorded – of the datasets. Reflections for key phases are marked in (a).
IV. CONCLUSION
The thermal decomposition of mill scale, and the effect of mill scale addition on the formation and decomposition of SFCA-I and, has been investigated using in situ XRD. Application of the external standard method to the QPA of the in situ data collected during decomposition of the mill scale highlighted the applicability of this method for the determination of the nature and abundance of amorphous material in a mineral sample; the mill scale was shown to contain 33 wt% of amorphous Fe-oxide material. Increasing mill scale addition from 2.6 to 10.6 and to 21.2 wt% did not significantly affect the thermal stability ranges of SFCA-I or SFCA, nor did it significantly affect the amount of each of SFCA or SFCA-I which formed. This was attributed to the low impurity (i.e. Mn, Mg) concentration in the mill scale, and also the transformation to hematite during heating of the wüstite and magnetite present in the mill scale under ambient conditions, with the hematite available for reaction to form SFCA and SFCA-I.
ACKNOWLEDGEMENT
The authors thank Dr. Zhe Wang (University of Wollongong) for providing the mill scale sample.


