I. INTRODUCTION
The analysis of pharmaceutical formulations by powder diffraction has historically been a challenge for pharmaceutical, law enforcement and analytical laboratories. Most pharmaceutical formulations contain poorly crystalline, nanocrystalline or amorphous compounds and many active pharmaceutical ingredients (APIs) are low symmetry, highly asymmetric crystals that tend to orient during specimen preparation. The non-crystalline ingredients are often used to improve drug solubility and/or delivery.
However, there have been tremendous advances in hardware, software, and databases in the past two decades that have fundamentally changed the ability to analyze poorly crystalline and non-crystalline materials. There are new software applications that target and resolve historic pharmaceutical diffraction problems. To gauge progress, over 65 formulated prescription drugs were analyzed, excipients identified, and APIs determined. All datasets, while collected on several different instruments, utilized modern position sensitive detectors. The data were then analyzed using applications embedded in PDF-4/Organics 2018, as well as commercial cluster analysis programs. A few select formulations were analyzed both in the laboratory and at Argonne National Light Source.
II. EXPERIMENTAL
Approximately 65 formulated commercial prescription drugs were analyzed by X-ray powder diffraction (XRD) methods. The collection of drugs contained 32 of the top 200 prescription drugs sold in 2016, including five of the top ten (McGrath et al., Reference McGrath, Brichacek and Njardarson2010). Most of the other formulated drugs analyzed were high volume sales drugs in other years or top selling over the counter drugs. The complete list is shown in Table I.
Table I. Formulations by name (generic, tradename, and brand names) (left column), with the dominant XRD pattern phase and active pharmaceutical ingredient (API) identifications.

In a few cases the dominant phase in the XRD pattern is the API. Four APIs were not identified and they are noted in [brackets] and do not have reference patterns. Four APIs had close but not exact identifications, they are noted in italics* with the closest reference.
Data on these formulations was taken over a 14-year period. Datasets were periodically used to test the efficiency of the PDF-4/Organics database (ICDD, 2014a), that was created in 2001, to analyze pharmaceutical formulations. The first series of data was collected in 2004 and analysis results published in 2004 and 2006 (Fawcett et al., Reference Fawcett, Faber and Hubbard2004, Reference Fawcett, Faber, Needham, Kabekkodu, Hubbard and Kaduk2006). The data were collected using a PANalytical X'Pert Pro diffractometer and the procedures are described in these publications. These datasets were all reanalyzed in 2018 for this study (ICDD 2014a, 2014b). A collaboration with Nicholas Guiliani, of Main Line Primary Healthcare resulted in a series of formulations being tested in 2012–2013 and then a second set of formulated products was analyzed in 2017–2018. This collaboration resulted in the analysis of ~40 formulations including most of the top 200 prescription drugs listed in Table I. During the 2012–2018 timeframe it became apparent from our laboratory analyses that some formulations were more challenging than others which resulted in data collection of Centrum Performance®, Allegra® and Singulair® being taken at the Argonne National Light Source as part of an ICDD-Argonne user facility agreement. Centrum Performance® and Allegra® have a complex formulation with many phases in relatively low concentration (1–10 wt. %) while Singular® contains an amorphous API, sodium montelukast.
During the 2012–2018 timeframe, data were collected using a Bruker D2 Phaser benchtop unit. The diffractometer was equipped with a LINXEYE silicon strip detector. Tablets or capsule contents were crushed into a fine powder for data collection. The powders were front packed into a cavity mount sample holder. Minimal pressure was used to pack the samples, so that a cavity was filled with a flat surface without orienting the particles. In all cases a zero background off-cut Si crystal was used to control specimen thickness without background interference. The authors consider this an essential piece of equipment in analyzing pharmaceuticals, since pharmaceuticals are typically low absorbing and there is appreciable depth penetration. The ~1 mm depth is a compromise to have sufficient particles in the beam with good resolution.
The XRD patterns were measured using CuKα radiation (5–70° 2θ, 0.02° steps, 1.0 s per step, 0.6° divergence slit, 2.5° Soller slits, 1 mm scatter screen height). Therefore, powder patterns were collected in approximately 1 hour. The scan range was specifically selected to enhance phase identification using total pattern analysis methods (Fawcett et al., Reference Fawcett, Kabekkodu, Blanton, Crowder and Blanton2015a, Reference Fawcett, Kabekkodu, Gates-Rector, Gindhart, Blanton and Blanton2016, Reference Fawcett, Kabekkodu, Blanton and Blanton2017). The low angle limit of 5° 2θ, enabled the detection of many common silicates and stearates used in pharmaceutical formations. The upper limit, 70° 2θ, ensured that one captures all high-intensity diffraction peaks while also establishing a background that is critical for analyzing non-crystalline components.
The low angle limit of 5° 2θ may be insufficient if one is trying to determine the specific polymorphic form or hydration level of many stearates. Stearates as a material class tend to crystallize with long hydrocarbon chains along the c-axis. Many divalent metal stearates crystallize as dimers, doubling the c-axis. In pharmaceutical formulations the stearates are added at low bulk concentrations levels and primarily act as a lubricant during the manufacturing process. The Powder Diffraction File has 58 stearate material references with a major long basal spacing (00l) below 5° 2θ and a c-axis dimension between 30 and 95 Å. While reference pattern data above 5° 2θ are often sufficient for identification of a stearate, the characteristic low angle basal spacings help define specific polymorph and hydration states. To measure these low angle peaks (1–5° 2θ) it is often necessary to use smaller slits with a well-aligned diffractometer. Similarly, if the API has a large unit cell size the user would want to start the scan at an as low angle as possible.
Sample preparation is essential for obtaining good quality data and more details and explanation for pharmaceutical samples can be found in a related publication by these same authors (Fawcett et al., Reference Fawcett, Gates-Rector, Gindhart, Rost, Kabekkodu, Blanton and Blanton2019). The recently published Volume H of the International Tables of Crystallography has an excellent chapter on specimen preparation methods (Whitfield et al., Reference Whitfield, Huq, Kaduk, Gilmore, Kaduk and Schenk2019).
Throughout the period of analyses (2004–2018), diffraction scans were taken of Centrum Performance® multi-vitamin pills. These data were used as control data to ensure that the instrument, data collection software and phase identification methods were in proper operating condition. In total, data were collected on seven different diffractometer systems and analyzed by six different search/match analysis programs. The synchrotron analysis of this sample is described by Kaduk in Volume H of the International Tables (Kaduk, Reference Kaduk, Gilmore, Kaduk and Schenk2019). These tablets contain 14 phases above 0.1 wt. % concentration, with hundreds of peaks in the typical analysis range, so the data analyses test resolution as well as detection capability. The instruments varied significantly in focusing radius, slits, and types of monochromators. From the analysis of the data it was readily apparent that biggest factors were beam brilliance, use of incident beam primary monochromators, and large radius to achieve high resolution. All systems used high-efficiency position sensitive detectors. The differences in resolution and detection capability guided later experiments, such as which tablets were selected for synchrotron analysis or the occasional use of finer slits or longer analysis times.
III. DISCUSSION
As will be shown in Sections I and II, the major phase in most formulated products is various excipients used as fillers, buffers, and binders. The general strategy is to identify the major excipient first and then focus on the residual pattern for the identification of the active pharmaceutical ingredients. A barrier to this technique is that many high volume excipients are either nanocrystalline or amorphous thus not identified using databases that contain only crystalline material references or methods that analyze amorphous content by the difference. Recent developments in both database content and whole pattern fitting analyses address these issues as described below.
A. Excipients
In the formulations analyzed there was a full range (0–100 wt. %) in the concentrations of the API and the excipients. However, in only two cases out of the 65 studies was the API concentration >50 wt. %. A general finding was that the excipient phases dominate the diffraction pattern as they were usually the highest concentration phase in the formulation. Therefore, successful analysis strategies necessitate the identification of the bulk excipients, particularly when the API is part of a complex formulation, or in relatively low concentration (i.e. below 10 wt. %).
The most frequently identified excipients, shown in Table II, that were identified in the 65 formulations, are all included in a list of 22 common excipients compiled by the International Pharmaceutical Excipients Council (IPEC) Americas (IPEC, 2018). Cellulosics and sugars (lactose, mannitol) dominate the list (nine of 22 most common excipients) and they are fundamentally organic materials with a high concentration of hydroxyl (-OH) functional groups. These materials can form hydrogen bonding networks with many pharmaceutical ingredients, and are excellent binders often used in time-release formulations. Anatase is primarily a white pigment but is also used in barrier coatings. Magnesium stearate, polyethylene glycol (PEG) and talc are all lubricants and in many cases are combined with other excipients for a barrier lacquer in tableting processes. Brushite, calcium phosphate hydroxide dihydrate, is often used as a buffer. Brushite and the anhydrous form, monetite, are commonly listed as dibasic calcium phosphate. Formulation experts are very adept at combining these excipients to control API release and dissolution rates.
Table II. Frequently identified excipients in pharmaceutical formulations, and the % of formulations with the excipient identified in this study.

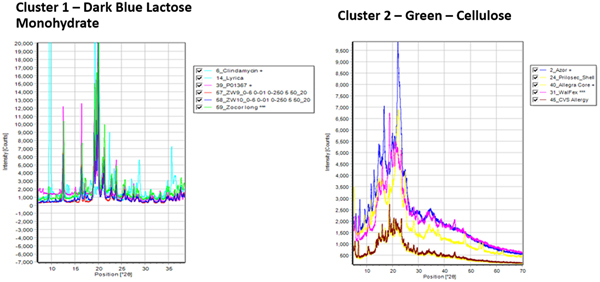
The formulation powder diffraction data were added to cluster analysis (Barr et al., Reference Barr, Dong and Gilmore2004a, Reference Barr, Dong, Gilmore and Faber2004b) and the various clusters aligned with common excipients and common excipient combinations. The cluster analysis basically uses similarity algorithms to group similar patterns in a cluster or dendrogram. The cluster analysis results, from HighScore X'Pert software, is shown in Figure 1. Microcrystalline cellulose (MCC) (62%) and alpha lactose monohydrate (41%) were by far the most common excipients identified and they were also the most common combined excipients. These two excipients each contributed to three clusters. The difference in the cellulose and lactose monohydrate cluster groups are different degrees of crystallinity exhibited by the diffraction pattern. These groupings are labeled in the cluster diagram (Figure 1). At higher levels of association in the dendrogram, a cluster plot is created with fewer cluster groups, as the lactose monohydrate and cellulose-containing clusters merge. Overall, six excipients (labels Figure 1) dominate the diffraction pattern intensity of the majority of formulations. In Table I, the dominant XRD pattern, by total diffraction intensity, of each formulation is listed and this corresponds to the members of the various cluster groups. Several patterns did not cluster and these formulations contained APIs in high concentration, each with their unique pattern (i.e. no clustering). These five APIs have the same dominant phase and API in Table I.
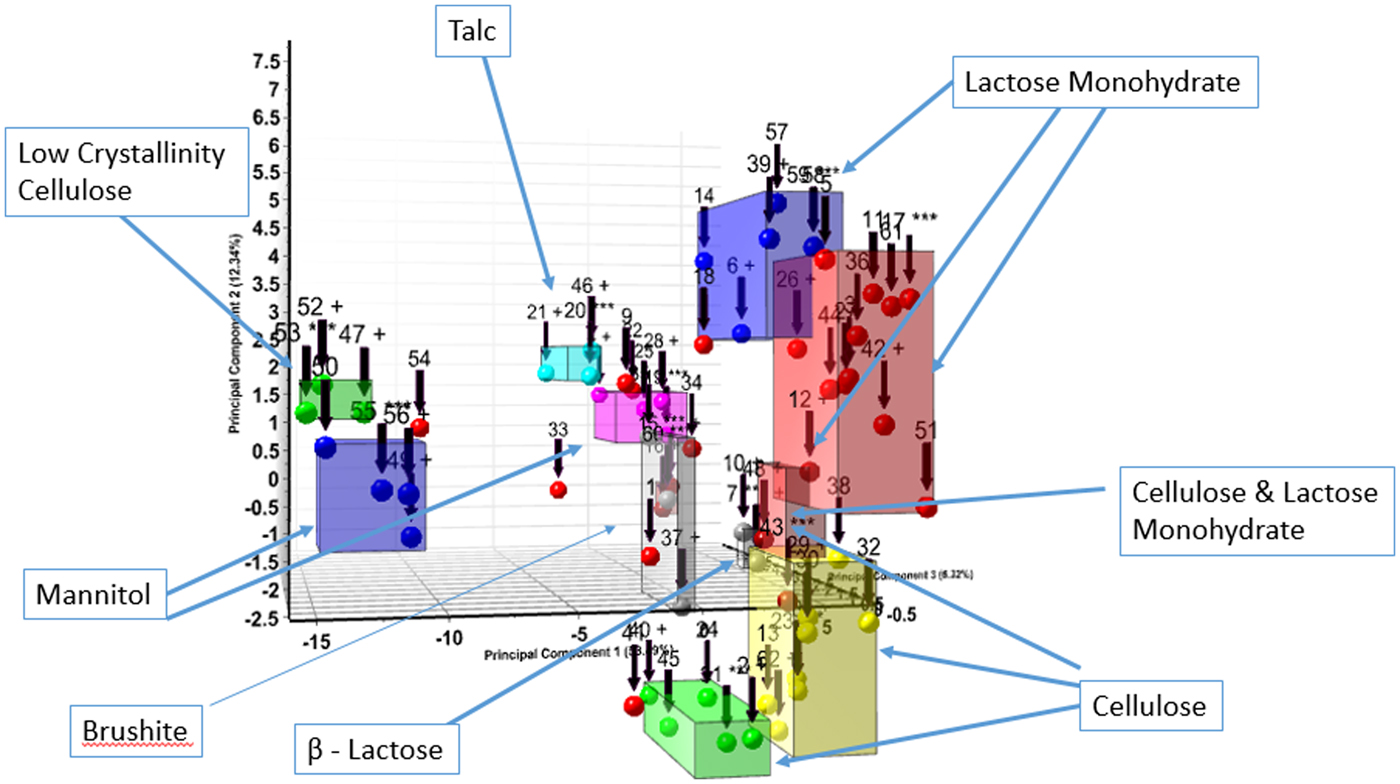
Figure 1. (Color online) Cluster analysis of formulated pharmaceutical diffraction patterns. The clustering focused on the dominant excipient present in the diffraction pattern, these are labeled.
The cluster analysis in Figure 1 and the dominant phase listed in Table I, indicate the highest concentration phases in the formulations. Excipients in particular, are required to be listed on the packaging but are not required to have listed concentrations. The distinctive patterns of lactose monohydrate and MCC, dominate cluster 1 and cluster 2, respectively, as shown in Figure 2.
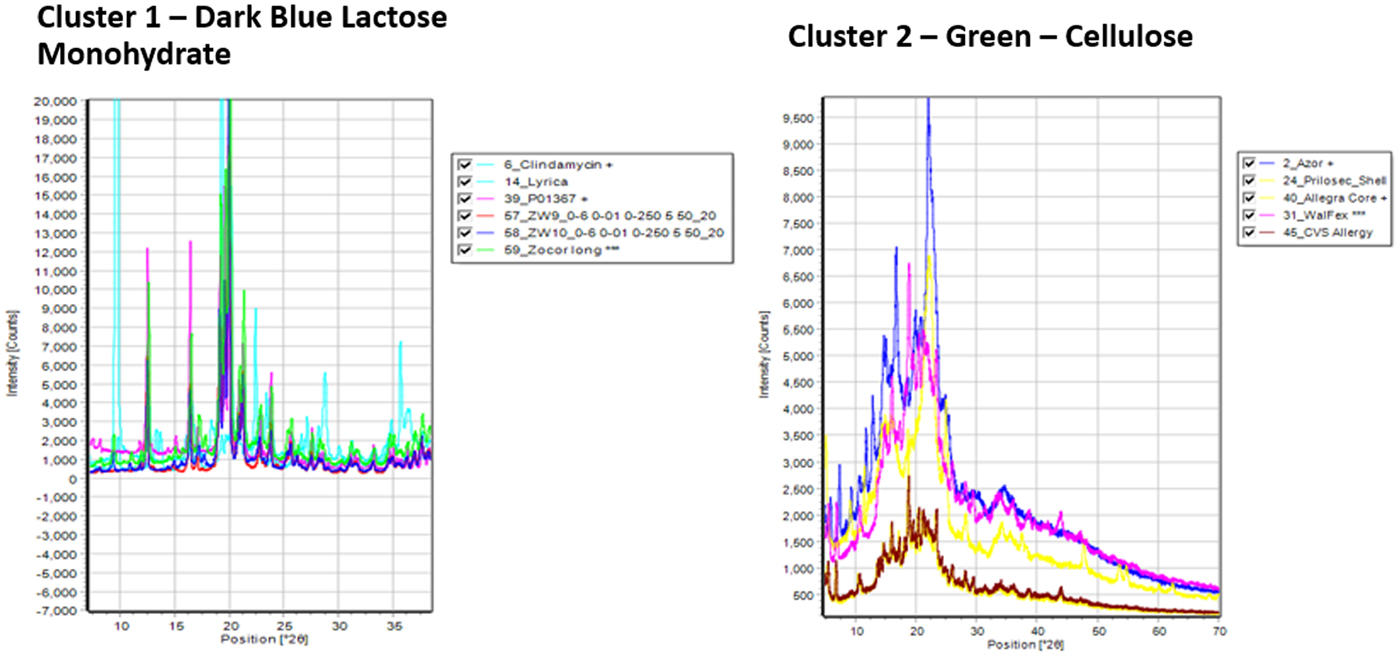
These two excipients can present a challenge in the analysis as they dominate the patterns of many formulations and need to be clearly identified. In this study cellulose Iβ was the dominant phase in 16 formulations and alpha lactose monohydrate dominated 18 formulations, the third largest group was mannitol with six formulations. These excipients were also frequently combined so microcrystalline or amorphous cellulose was actually identified in 28 formulations (43%).
For MCC and other cellulosics, the problem in analysis, is related to peak broadening because of nanocrystalline domains and amorphous domains, sometimes in combination. (Fawcett et al., Reference Fawcett, Crowder, Kabekkodu, Needham, Kaduk, Blanton, Petkov, Bucher and Shpanchenko2013). Tools such as full pattern references and similarity indexes (Faber and Blanton, Reference Faber and Blanton2008) help identify these materials. For alpha lactose monohydrate, LMH, problems can arise from peak overlap and crystallite size. The three-strong LMH peaks between 19° and 20.5° can overlap and merge as a function of crystallite size, with increased broadening at smaller sizes. This can obscure minor phases and cause shifts in the peak centroids, which in turn hinders the identification process. In fact, small, medium, and large crystallite size alpha lactose monohydrate separated into three distinct clusters. The red and blue clusters (Figure 1), corresponding to small and large crystallites, respectively. The difference is shown in Figure 3, that has representative patterns of Zocor® from the blue cluster and two smaller crystallite pattern from Benicar® hydrochlorothiazide (HCT) and Namzaric® from the red cluster. The pattern of alpha lactose monohydrate dominates in all three formulations, in Namzaric® the trio of alpha lactose monohydrate peaks from 19° to 20.5° 2θ is further complicated by additional peaks from the API, donepezil hydrochloride. In general, the formulations having smaller crystallite size alpha lactose monohydrate were more difficult to analyze.
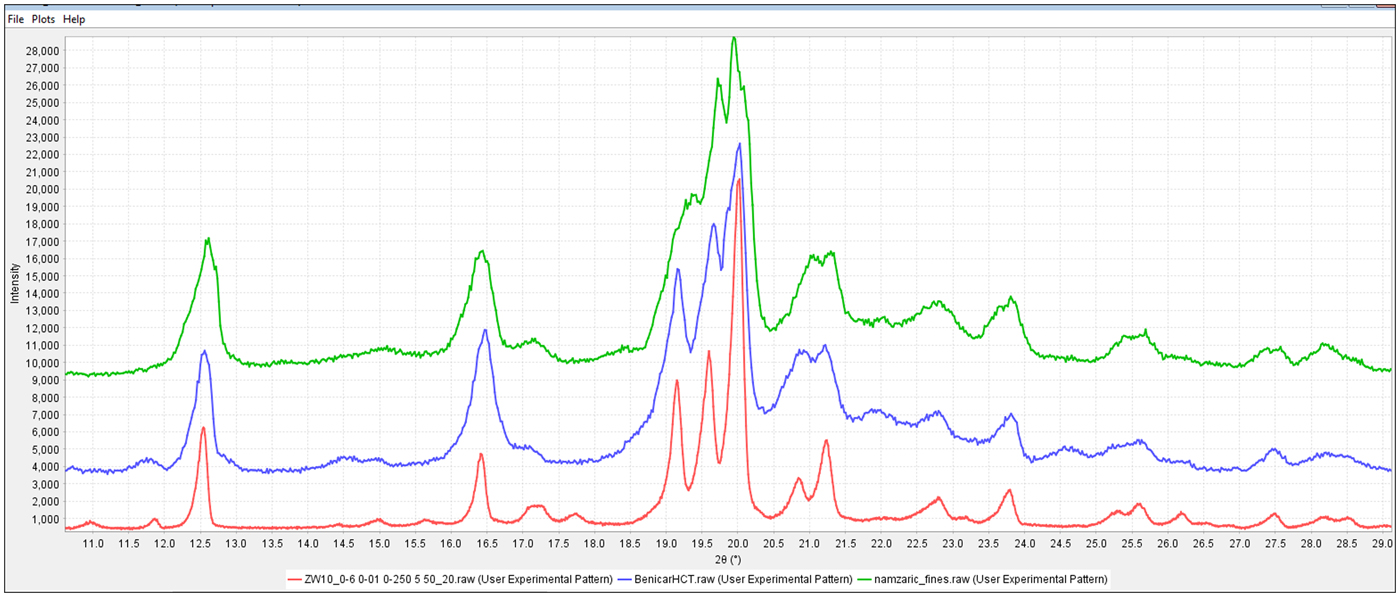
Figure 3. (Color online) Diffraction patterns of formulations from Namzaric®, Benicar® HCT and Zocor® from top to bottom, respectively. All the common high-intensity peaks are from alpha lactose monohydrate, the weaker peaks are from the API's.
Either direct measurement of the crystallite size, as incorporated in many Rietveld programs, or a crystallite size model (Scardi et al., Reference Scardi, Leoni, Lamas and Cabanillas2005, Reference Scardi, Leoni and Faber2006) can greatly help in the analysis. Full pattern analysis methods with incorporated crystallite size models (Fawcett et al., Reference Fawcett, Kabekkodu, Blanton, Crowder and Blanton2015a, Reference Fawcett, Kabekkodu, Zhong, Gindhart, Blanton and Blanton2015b) were used in all the analyses. Figure 4, shows alpha lactose monohydrate (PDF# 02-088-5179) with crystallite sizes of 500, 320, and 200 Å that could be compared to the experimental data in Figure 3. Models can be directly plotted vs. experimental data and then the residual patterns analyzed for additional excipients and APIs. In the cases of Zocor®, Benicar® HCT and Namzaric®, total pattern fitting lead directly to the identifications of simvastatin, olmesartan medoximol, and HCT and finally donepezil hydrochloride. All four of these API's are in concentrations less than 10 wt. % of the formulation and their characteristic peaks are the low-intensity peaks and shoulders in the experimental data.
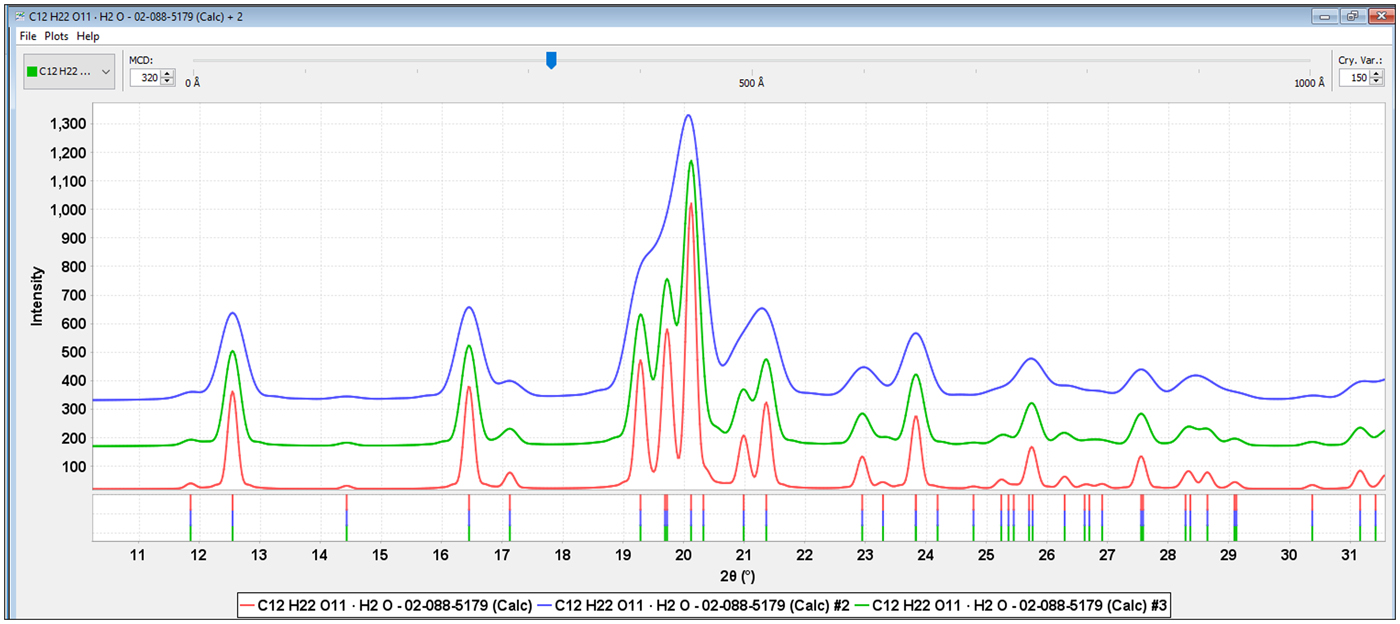
Figure 4. (Color online) Alpha lactose monohydrate calculated patterns (PDF# 02-088-5179) with 200, 320 and 500 Å crystallite sizes, from top to bottom, respectively.
The complete analysis is shown in Figure 5, for Benicar® HCT where both olmesartan medoximol and HCT have been identified and then remaining intensity was matched to MCC Iβ. Graphics programs contained in PDF-4/Organics can show these analyses several different ways, such as the stacked offsets shown in Figure 5(a), or a summation plot where all phases are added and scaled to match the experimental data as in Figure 5(b).
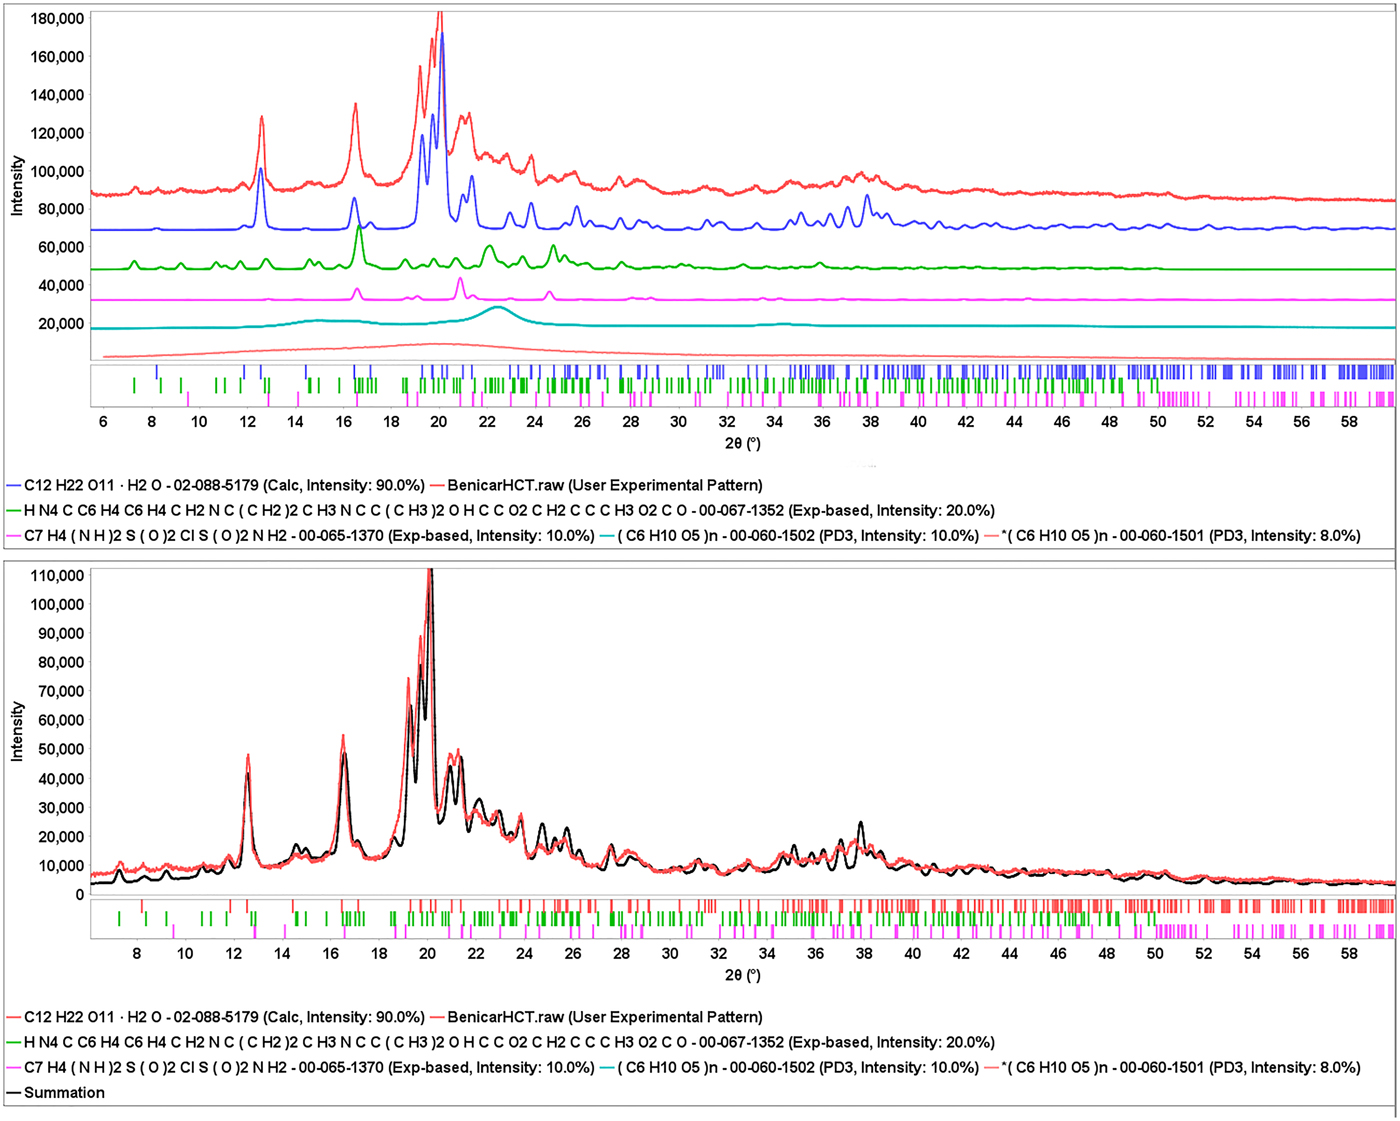
Figure 5. (Color online) The total pattern analysis of Benicar® HCT. The top plot (a) shows each identified ingredient underneath the experimental data (top, in red) in an offset plot. The bottom plot (b) shows a summation of the ingredients (black pattern) compared to the experimental data (red pattern).
In the summation plot, Figure 5(b), amorphous cellulose was also added to the match, the crystallite size of alpha lactose monohydrate was input as 300 Å, the baseline and the data were slightly offset to highlight the match. The difference plot shows a slight mismatch in the lactose monohydrate major peaks. This is not a refinement but additive patterns process. A Rietveld refinement might improve the fit even better.
The identification process demonstrated above, whereby we identify and then pattern fit the excipients, followed by a residual analysis for the detection of the API was repeated for all the formulations where the API was in low concentration. The identification of polymeric and non-crystalline excipients using experimental digital profiles was greatly assisted by the systematic inclusion of common polymers and excipients (Gates et al., Reference Gates, Blanton and Fawcett2014; Gates-Rector et al., Reference Gates-Rector, Blanton, Gindhart and Kaduk2018) in the Powder Diffraction File™. These additions enabled the identification of polyethylene glycol in Myrbetriq® and Oxycontin® as well as a number of cellulose derivations (Fawcett et al., Reference Fawcett, Crowder, Kabekkodu, Needham, Kaduk, Blanton, Petkov, Bucher and Shpanchenko2013). The gelatin in two gelcaps, Amatiza® and Perrigo Ducosate, were analyzed and the degree of crystalline order in the gelatin could be determined by comparison to recently added material references (Blanton, Reference Blanton2013). In the case of gel caps, while the gel was identified, the APIs could not be determined in their gel state. In both gel cap cases, the PDF® contains a reference pattern for the API but we could not confirm or deny whether that polymorph was in the commercial product. Similarly, povidone, another common IPEC excipient, was identified in several formulations based on recent additions to the powder diffraction file (ICDD, 2017) and the detailed analyses of Teng et al. (Reference Teng, Bates, Engers, Leach, Schields and Yang2010).
The application of pair distribution function (PDF) analysis methods to pharmaceutical materials has been clearly demonstrated by Petkov (Petkov et al., Reference Petkov, Ren, Kabekkodu and Murphy2013) and Billinge (Billinge, Reference Billinge2011). In the cases of nanomaterials and amorphous materials, PDF analyses can provide structural information (i.e. bond types and distances) and estimations on the domain size. In the case of various cellulosics (Fawcett et al., Reference Fawcett, Crowder, Kabekkodu, Needham, Kaduk, Blanton, Petkov, Bucher and Shpanchenko2013) the measured PDF domain size supported the XRD determination of crystallite size in one case and designation of an amorphous structure in another. However, the analyzed specimen of cellulose Iβ could easily be analyzed as a nanocrystalline and amorphous mix by XRD by pattern fitting methods, but not as easily deconvoluted in the PDF which was dominated by the nanocrystalline domains. The analysis of pure materials is well understood and the analysis of mixtures by PDF is an area of rapid development.
B. Active pharmaceutical ingredients
Unless the analyst has a pure sample of the API, the identification of the API requires a reference pattern. During the early stages of drug discovery and development, the APIs are not commercial, patents are being developed, and samples are generally unavailable to those working in analytical and law enforcement organizations. Once a drug is commercialized, they become available. Depending on the drug and its function, the API may be controlled and only available to licensed groups or organizations. The rules and regulations controlling API distribution and availability present a challenge to any analytical database organization trying to service the pharmaceutical and law enforcement communities. The constant flow of new drugs and formulations into the market also means that databases need to be constantly updating.
While there are several database organizations (CSD, COD, PDB etc.) that collect pharmaceutical diffraction data, the ICDD has been continually collecting pharmaceutical material references for over 75 years. In addition, the ICDD has several mechanisms for continuous monitoring and addition of new APIs. Typical of most database organizations, the ICDD monitors global published literature, obtains copyright access and extracts the diffraction data. Unlike most organizations, the ICDD also (1) extracts patent literature (2) provides for grants to obtain new data and (3) identifies new drugs and excipients on the market and has targeted research programs to get these materials in the database. The ICDD grant-in-aid programs have a > 60-year history and is a fundamental reason why there are more APIs that have been analyzed and characterized by powder diffraction than by published single crystal analyses. While most grants have been given to academic organization there has also been grants to institutes and government organizations that can analyze regulated materials. Targeted research programs are described elsewhere (Gates et al., Reference Gates, Blanton and Fawcett2014; Kaduk et al., Reference Kaduk, Crowder, Zhong, Fawcett and Suchomel2014, Reference Kaduk, Wheatley, Gindhart and Blanton2018) but in the last decade ICDD programs have specifically examined the top-selling drugs and high volume excipients. A major goal of this study was to determine the effectiveness of these programs in providing coverage of prescription drugs at this specific time. In particular, the majority of APIs have multiple polymorphic forms, some as many as 20, and we wanted to ensure that the commercial polymorphs were indeed included in the targeted references.
In Table I, are the APIs identified in this study and the cited PDF material reference which is specific to the commercial polymorph. For the 65 formulations there were 59 different APIs, some formulations had identical APIs and others had two APIs which is why the APIs do not match the number of formulations. The majority of APIs were identified through their PDF® material references, contained in PDF-4/Organics 2018, shown in Table I. In addition, there were three APIs whose data are published in Powder Diffraction and are being processed for the next PDF release. These APIs are alogliptin benzoate (Zeng et al., Reference Zeng, Wang, Xiong, Du and Lia2017), febuxostat (Kadak et al., Reference Kaduk, Wheatley, Gindhart and Blanton2018), and mirabegron (Mendoza et al., Reference Mendoza, Henao, Aparicio and Bohorquez2017) and they are all in-process as PDF materials references. The published data were used for the identification. There were eight APIs where the Powder Diffraction File did not contain a matching reference. In four of these eight formulations the diffraction pattern of the reference polymorph is similar, but not identical, to the commercial polymorph. For example, the reference diffraction pattern of fluticasone proprionate, PDF# 02-089-0882, are similar to many of the unidentified peaks in Flonase® that contains fluticasone propionate. However, the reference data were from a disordered structure measured at 150 K, so the identification is not definitive. These cases are identified in Table I using an asterisk (*) along with an italicized API brand name. In the other four cases, for two we were unable to find a suitable material reference and for another two the concentration of the API was below 1 wt. %, our detection limit with the experimental methods used. These four APIs are shown in brackets with an asterisk.
A surprising result in these analyses was that the extensive coverage and identification of both crystalline and non-crystalline excipients, described earlier, resulted in the ability to isolate diffraction peaks because of the API in complex formulations. Previously this was not possible, but in the current study we were able to identify all major excipients in every formulation studied. Having a listing of experimental peaks temporarily assigned to the experimental API, the authors could then search international patents, freely available on the internet, by using the listed API tradename on the list of ingredients in a general browser search. In five cases, this leads to the positive identification of the correct API polymorph through claims and diffraction patterns associated with the patents. Not surprisingly, the matching polymorph was usually the most stable, Form I, and the patent was often assigned to a pharmaceutical manufacturer.
This process is shown in Figure 6, the diffraction pattern of Invokana™ (red). Most of the major diffraction peaks in this pattern are because of lactose (shown in blue), the primary crystalline excipient. The broad features in the middle of the pattern match MCC Iβ. The PDF® has two polymorphic diffraction pattern references for the API, canagliflozin, but neither matches the experimental data. The starred unidentified peaks do match, claim 1 for Form I of canagliflozin (Murakami, Reference Murakami2006). The identification of β-lactose and cellulose Iβ isolated the peaks because of the API (also shown in the difference plot) which were then matched to the patent claims. In each of these cases, the appropriate patent and form were recorded and the information given to the editors of the ICDD for extraction and inclusion in the PDF database. Similar processes were used to identify the API's in Eliquis®, Jardiance®, and Savaysa™ where the API concentrations were 3, 12, and 14 wt. %, respectively. Benazepril was another case where the PDF reference polymorph diffraction pattern did not match, but Form I of benazepril hydrochloride was identified from Chinese patent 103012267B (2012). In this case characteristic low angle peaks (red stars) were easily found in a matrix of MCC (Figure 7).
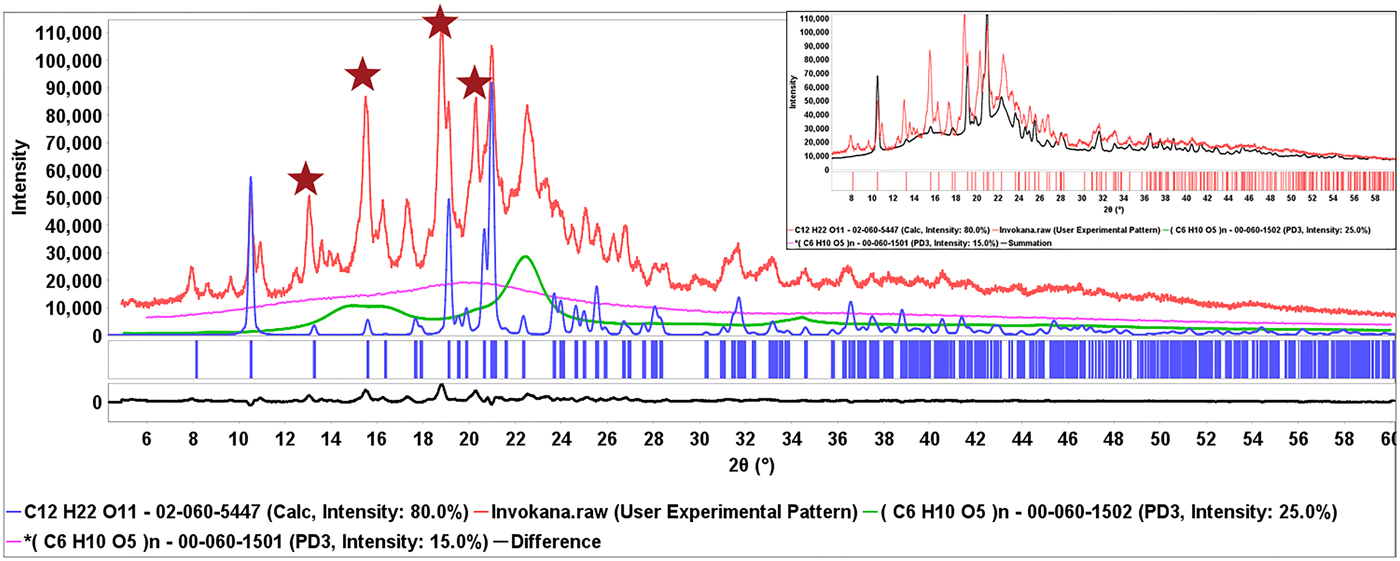
Figure 6. (Color online) Diffraction pattern from the formulation of Invokana® (red) with the reference pattern of β-lactose (blue) blue and cellulose Iβ (green). The stars denote majority intensity peaks associated with the API and cross-referenced with claim 1 of Chinese patent 101573368B (2006). The insert shows the summed pattern. A difference plot (black) is shown at the bottom of the main plot.
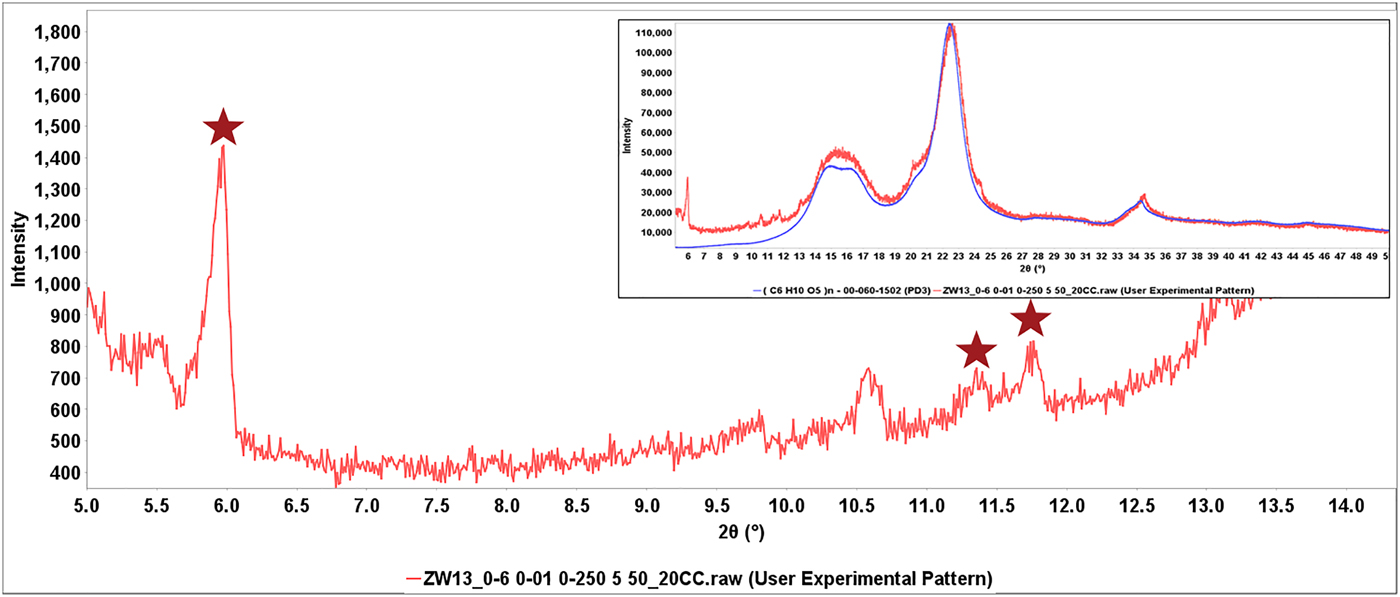
Figure 7. (Color online) Expanded low angle region of the diffraction pattern of Benazepril. The full pattern is shown in the insert with the major features matched to cellulose Iβ. In the low angle region stars correspond to peaks that match claim 1 and the Form I table of Chinese patent103012267B (Hu et al., Reference Hu, Fang, Feng and Jianyue2012).
By using direct PDF material references, published and patented data (future PDF material references), 51 out of 59 APIs were identified and another four could be reasonably assigned because of similarities to other known polymorphs (93%). Multiple commercial polymorphs were identified for fexofenadine hydrochloride, amlodipine besylate, olmestartin medoximol. Both the anhydrous and dihydrate form of nebivolol hydrochloride were found in Bystolic® and two forms of donezepril hydrochloride were found in Namzaric®. In these two specific cases there was some circumstantial evidence of in situ reaction as one polymorph was highly crystalline and the other of small crystallite size. In donezepril, microspheres and fine powder were both found in the caplet and the fine powder contained the small crystallite API. Two forms of amlopidine besylate were identified, but in another formulation the base form of amlopidine did not match the PDF reference diffraction pattern.
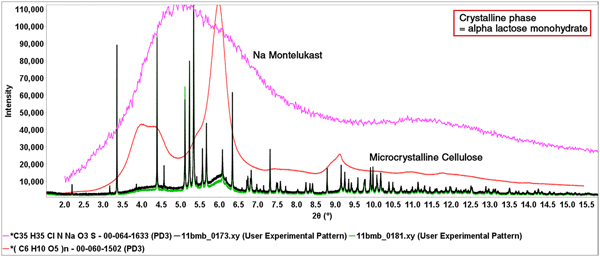
In one case the authors studied the detection on an amorphous API, sodium montelukast, in the formulation of Singulair®. The material reference pattern of sodium montelukast is PDF# 00-064-1633 and the associated PD3 experimental digital pattern was used in all the analyses. The major ingredients of Singulair® are shown in Figure 8, along with the diffraction patterns of Singulair® and Singulair® doped with 5% amorphous sodium montelukast. The data for Singular®, doped-Singulair® and the reference diffraction pattern for sodium montelukast were all collected on beamline 11-BM at the Advanced Photon Source at the Argonne National Laboratory.
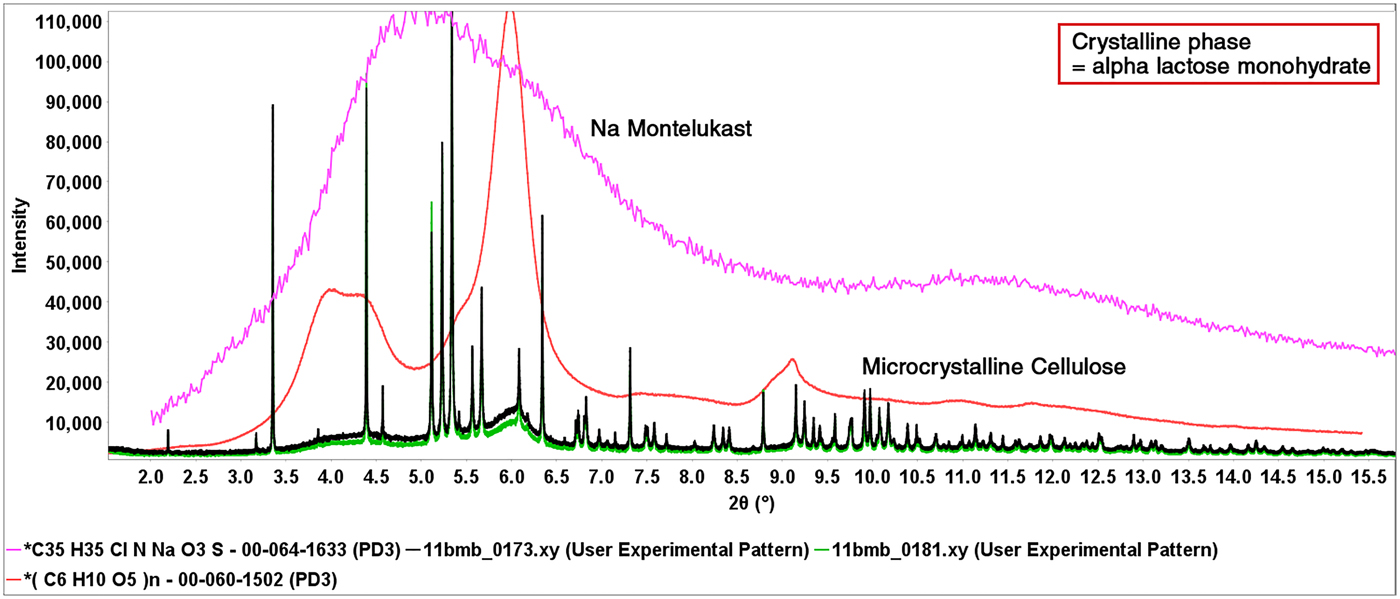
Figure 8. (Color online) Experimental powder patterns of Singulair™ (green) and Singulair™ with a 5 weight % addition of amorphous sodium montelukast (black). Also shown are the experimental (PD3) reference patterns for pure sodium montelukast (PDF# 00-064-1633) and cellulose Iβ (PDF# 00-060-1502). The references are scaled to match the experimental data and determine amounts of each phase.
A complete review and analyses were presented at PPXRD-13 (Fawcett et al., Reference Fawcett, Kabekkodu, Zhong, Gindhart, Blanton and Blanton2015b) but in this case the analyses involved the full pattern modeling of the broad features (red and green experimental data in Figure 8) caused by the combination of MCC and amorphous sodium montelukast. Using a standard addition experiment, the concentration of sodium montelukast in the formulation was calculated at 4 wt. % (listed at 5 wt. %) and a detection of 1% variation in both MCC and amorphous sodium montelukast was determined. It should be noted that “micro” in microcrystalline refers to the chopped fiber size, while the diffraction pattern is of nanocrystalline cellulose Iβ, where nano refers to the size of the crystallites (subunits of a microfiber which is a subunit of the fiber). This experiment was conducted to demonstrate the ability to detect low bulk concentrations of nano and amorphous materials using pattern fitting methods.
It is interesting to compare patterns of alpha lactose monohydrate (Figure 3) and cellulose (Figure 7), to data taken on the synchrotron (Figure 8). Very high resolution is achieved on the synchrotron, by using monochromatic radiation and elimination of most types of instrumental broadening, which benefits the identification of alpha lactose monohydrate as the peaks do not overlap and exactly match the reference diffraction pattern. For cellulose the diffraction pattern is governed by the materials small crystallite size, instrumental broadening is only a minor component, so the laboratory and synchrotron patterns are similar.
The complete analyses of all 65 formulations are shown in Appendix A. It should be mentioned that in every case the exact dosage was recorded as well as the drug manufacturer. The authors identified several cases where excipient formulations were changed with dosage. In order to reproduce results once needs to compare both manufacturer and dose.
C. Functional formulations
In the context of this publication functional formulations are design features such as extended release or rapid dissolution functionality, meant to control dosage rate with time. In the formulations studied, Myrbetriq®, Namzaric®, Nexium®, Prilosec OTC®, Pristiq®, and Seroquel XR® were packaged as extended release formulations. Pain relief formulations, OxyContin® and tramadol as well as the gout treatment, Uloric®, were packaged as controlled dose formulations. For these formulations the tablet shell or encapsulated ingredients were physically separated from the tablet interior or capsule, usually by crushing the tablet and sieving the contents, this usually separated flakes from the coating from interior fines (Figure 9) and both were separately analyzed. It helped in the separation that the coatings were frequently colored.
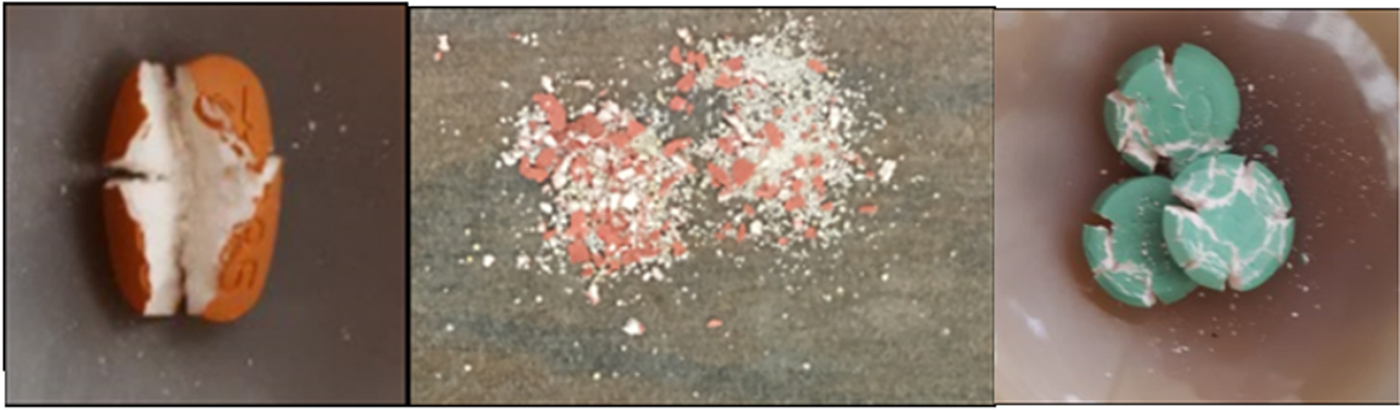
Figure 9. (Color online) Hard coatings (colored) on extended release tablets of Myrbetriq®, Prilosec OTC® and Uloric®, patients are instructed to “swallow whole, do not crush or chew the tablet !”.
A common phase in many tablet coatings used for extended release is talc (Rowe et al., Reference Rowe, Sheshkey and Quinn2009). Talc is often combined with MCC or hydroxypropylcellulose to form a hard lacquer coating on the tablet exterior. In tablets of Uloric® an impact hammer was required to break up the tablet during specimen preparation. The label instructions guide the patient to swallow the tablet whole. Similar instructions were made for OxyContin® where the tablet coating was hydroxypropylcellulose, anatase and PEG. PEG was also used in an extended release tablet for Myrbetriq®. Anatase and magnesium stearate trihydrate combine with binders (gypsum) for another type of extended release coating in Prilosec OTC®. These hard coatings can be designed to provide a specific controlled dissolution in biological fluids.
Diffraction patterns and phase identification of Myrebriq® and Uloric® are presented in a related publication by the same authors (Fawcett et al., Reference Fawcett, Gates-Rector, Gindhart, Rost, Kabekkodu, Blanton and Blanton2019). The patterns of PEG (Myrebriq®) and talc (Uloric®) are easily visible in experimental datasets of the whole tablet and those of the tablet coating. PEG is also used in the formulation of OxyContin. In this case the PEG binds tightly to the oxycodone preventing the oxycodone to be ground into a fine powder and reducing illicit uses (i.e. snorting) of this painkiller.
Several formulations were contained in capsules, furthermore the interior of the capsules often contained round pellets (Figure 10) having a mixture of excipients and API. Spherical pellets based on MCC, hydroxypropyl cellulose, and alpha lactose monohydrate (LMH) were identified and there are suppliers who claim that MCC and LMH spheres help with rapid dissolution and controlled dose delivery when bound with the API. We particularly noted the formulation of Linzess® since linaclotide cellulose microspheres were used and Jardiance® where a LMH micro chip morphology was observed. These two morphologies provide substantially more surface area than other spheres in encapsulated formulations. The packaging on Linzess® mentions the linaclotide coated beads. Linzess® is used to treat constipation, hence a need for speed!
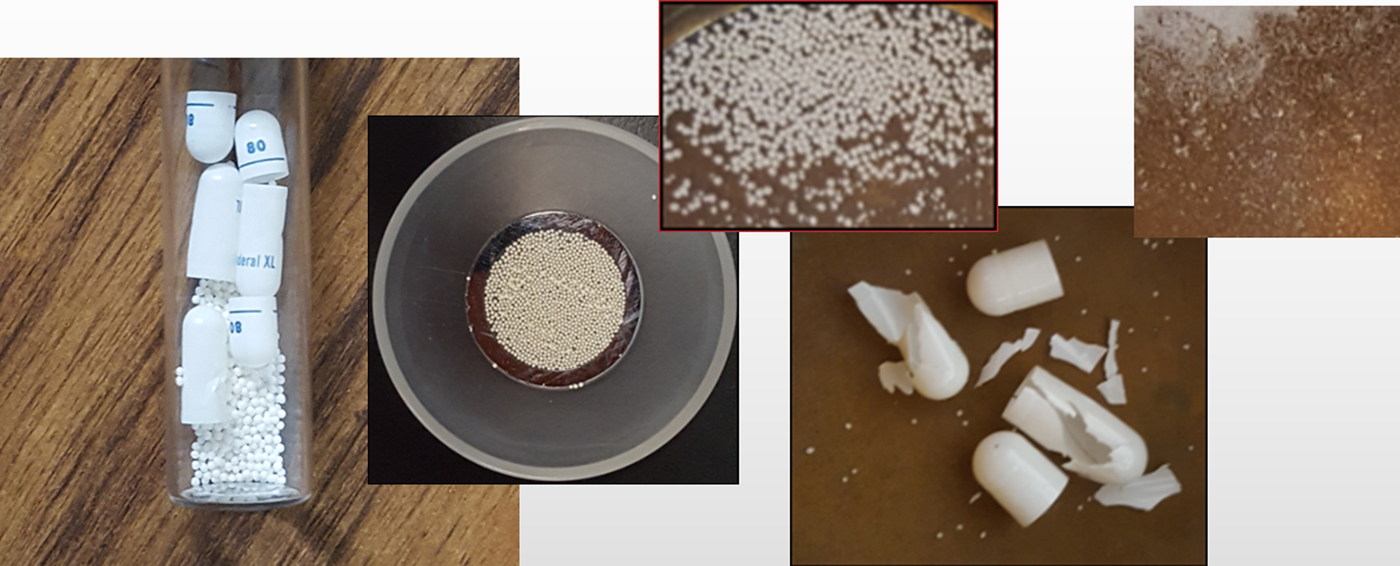
Figure 10. (Color online) Composite photograph of spheres contained in capsules from left to right of Inderal® XL, Nexium®, Namzaric®, Linzess®, and Jardiance®. The spheres varied in size with the Linzess® spheres described as microspheres by the manufacturer.
D. Comparison to published ingredients
For all formulations the identified phases corresponded to ingredients listed per FDA labeling regulations (United States Code of Federal Regulations, Code 21, Title 21, 2017). However, these regulations do not specify polymorphs and/or hydrates, neither do they require concentrations of the excipients to be listed on the label. The value of the diffraction analysis is that it clearly identifies the major phases in the highest bulk concentration and these are usually the phases controlling major physical properties.
The cluster analysis highlights the high concentration excipients such as mannitol, alpha lactose monohydrate, β-lactose, talc, and MCC since they dominate the diffraction pattern. Other common excipients, such as anatase and magnesium stearate dihydrate are typically in concentrations of only a few weight percent, are easily identified (Appendix A) but are minor contributions to the total diffraction pattern.
The diffraction analyses are also specific to the polymorphic forms in the solid state. Febuxostat has over 20 known polymorphs (Qiu et al., Reference Qiu, Li, Sheng and Zhu2015) but Form I is the correct polymorph identified in the commercial product, Uloric®. Most of the active pharmaceutical ingredients analyzed, have multiple polymorphs, and the diffraction analyses identify the specific polymorph used in each formulation.
Water content is another consideration. Many ingredients, both excipients and APIs, have either molecularly bound or absorbed water. Very common excipients such as cellulosics and sugars have absorbed water content. Azor®, Centrum Performance®, Savaysa™ tablets, containing cellulose and mannitol, were ground, placed in a drying oven for 40 h at 75°C, and had between 2 and 5% weight loss. We would expect similar weight losses on most of the formulations containing hydrophilic excipients. The hydration state of many excipients and APIs varied, and our analyses often found multiple hydrates in the same formulation. Packaging usually is designed to provide a controlled humidity environment, however, the ingredients themselves can be a source of water.
While the ICDD has been adding material references of amorphous pharmaceuticals and excipients, the analysis by powder diffraction requires careful specimen preparation and use of whole pattern methods since the incoherent scattering profile over a large angular range is used for identification. As a result, amorphous materials are not as easily observed and measured as other phases, especially in low concentration (below 10 wt %) and are not amenable to identification by the typical automated search/match methods in current use. In this publication we tried to show the value of using full pattern methods. The analysis of Singulair® demonstrates how low concentrations of an amorphous API or excipient can be analyzed (Fawcett et al., Reference Fawcett, Kabekkodu, Zhong, Gindhart, Blanton and Blanton2015b). Similar methods were used to identify povidone in Allegra®. Amorphous hydroxypropylcellulose and ethylcellulose were easily identified as a major phases in Pristiq®, Nexium®, and Inderal® XL respectively and gelatin was identified in gel caps of Amatiza® and Docusate.
In the current study we did not identify low concentration amorphous phases with our typical specimen preparation and routine analysis (i.e. 1 h scan on a 300 W benchtop diffractometer). To identify amorphous ingredients at lower concentration one has to examine subtle changes in broad scattering profiles and be able to separate these from the background. Three strategies were useful for low concentration non-crystalline materials (1) longer scan times, (2) synchrotron sources, and (3) physical separation. The first two strategies are methods to enhance the signal, in the third strategy the analyte of interest was concentrated on the tablet shell or in the powder core. In Appendix A, our list of identified ingredients included low concentration amorphous phases in the cases where we employed one or more of the above strategies.
The analysis of formulations did produce some unexpected results. For example, when analyzing capsules of Namzaric® there was both spheres and fine powder within the capsule. The fine powder contained only one of the two APIs, Donepezil hydrochloride Form III, and both the API and excipient alpha lactose monohydrate were of smaller crystallite size than the same ingredients in the spheres. The crystallite size of the API was 350 Å in the spheres and 80 Å in the powder. This suggests that there may have been recrystallization post-encapsulation. Donepezil hydrochloride polymorphic forms are susceptible to humidity conditions (Aher et al., Reference Aher, Tarur, Sathe, Naidu and Sawant2007). We also found many cases where the reference polymorphic form in the ICDD database (ICDD, 2017) did not match the commercial formulation. This was critical information since it initiated an editorial review process to find and identify the correct polymorph for inclusion in the database as in the cases of Invokana® (Figure 6), benazepril (Figure 7), Uloric®, and the base form of amlopidine.
E. Pattern fitting
There are many whole pattern fitting methods that can be applied to pharmaceutical analyses. Rietveld methods offer the advantages of highly sophisticated analyses, fundamentally based on molecular structure, that can precisely quantitate phases, as well as provide information on crystallite size and orientation. The pattern fitting methods used here are visual and simpler in design and concept, which is both a strength and weakness of the method. A strength is the ability to distinguish between nanocrystalline and amorphous materials and incorporate multiple amorphous and nanocrystalline patterns into a single analysis. Amorphous material identification is phase specific, and not calculated by difference. The simplicity reduces chances for many types of operator error that are common in Rietveld analyses. Another strong advantage is that phase identification requires a pattern, but not necessarily a crystal structure so the method is inclusive of all types of non-crystalline materials that are common in pharmaceutical analysis. A method weakness is that whole patterns are scaled vs. individual peaks, so the method is less sensitive to orientation, lattice defects and perturbations (i.e. stress/strain) and micro absorption effects, all of which influence precision and accuracy in quantitative phase analysis. Volume H of the International Tables for Crystallography (Madsen et al., Reference Madsen, Scarlett, Kleeberg, Knorr, Gilmore, Kaduk and Schenk2019) has an excellent chapter on quantitative phase analysis that describes the pros and cons of various whole pattern fitting methods. The advantage of the method described in this publication is for total phase identification.
One of the intents of this publication was to demonstrate the application of the pattern fitting method for the phase analysis of formulated products that contain non-crystalline ingredients.
5. CONCLUSIONS
Advances in hardware, application software, and databases have significantly enhanced formulation analyses of pharmaceuticals. In this study a significant number of common pharmaceutical formulations were analyzed. All solid-state bulk concentration excipients were identified using material references in PDF-4/Organics 2018, independent of their crystalline state! Nanomaterials and amorphous materials were identified using full pattern fitting methods. Approximately 93% of the active pharmaceutical ingredients and their polymorphic forms were positively identified.
Having extensive coverage of the excipients helped identify several low concentration APIs by using a few characteristic peaks. Full pattern matching methods helped to identify specific peaks that could be cross-referenced to patent claims. Crystallinity and orientation issues, a historic nemesis, were identified and analyzed with appropriate application software using pattern fitting analysis. The phase identifications provided insight into drug design and functionality.
ACKNOWLEDGEMENTS
The authors would like to thank Nicholas A. Giuliani and Main Line Healthcare Primary Care, Concordville, PA, USA, for providing many of the tablets and capsules used in this study. The authors would like to acknowledge the support of Rigaku, Bruker-AXS, Proto and PANalytical in providing access to laboratory and benchtop diffractometers, and to Argonne National Laboratories for laboratory access to the synchrotron light source. Jim Kaduk, Cam Hubbard, Silvina Pagola, Mathew Suchomel, Cyrus Crowder and Fangling Needham each contributed their expertise in preparing specimens and collecting data on one or more formulations. The authors would also like to thank Simon Bates, Ann Newman, Robert Dinnebier, Arnt Kern, Raj Suryanarayanan, Shawn Yin, Detlief Beckers and Fabia Gozzo, expert instructors for pharmaceutical workshops at PPXRD, for their helpful instruction, advice, and discussions on pharmaceutical analysis. Use of the Advanced Photon Source at Argonne National Laboratory was supported by the U.S. Department of Energy, Office of Science, Office of Basic Energy Sciences, under Contract No. DE-AC02-06CH11357.
SUPPLEMENTARY MATERIAL
Experimental X-ray diffraction powder patterns from five pharmaceutical formulations are included in the supplementary materials. These data represent a range in difficulty for pharmaceutical formulation phase identification analysis. A document with methods and results for these data sets is provided.
The supplementary material for this article can be found at https://doi.org/10.1017/S0885715619000253