I. INTRODUCTION
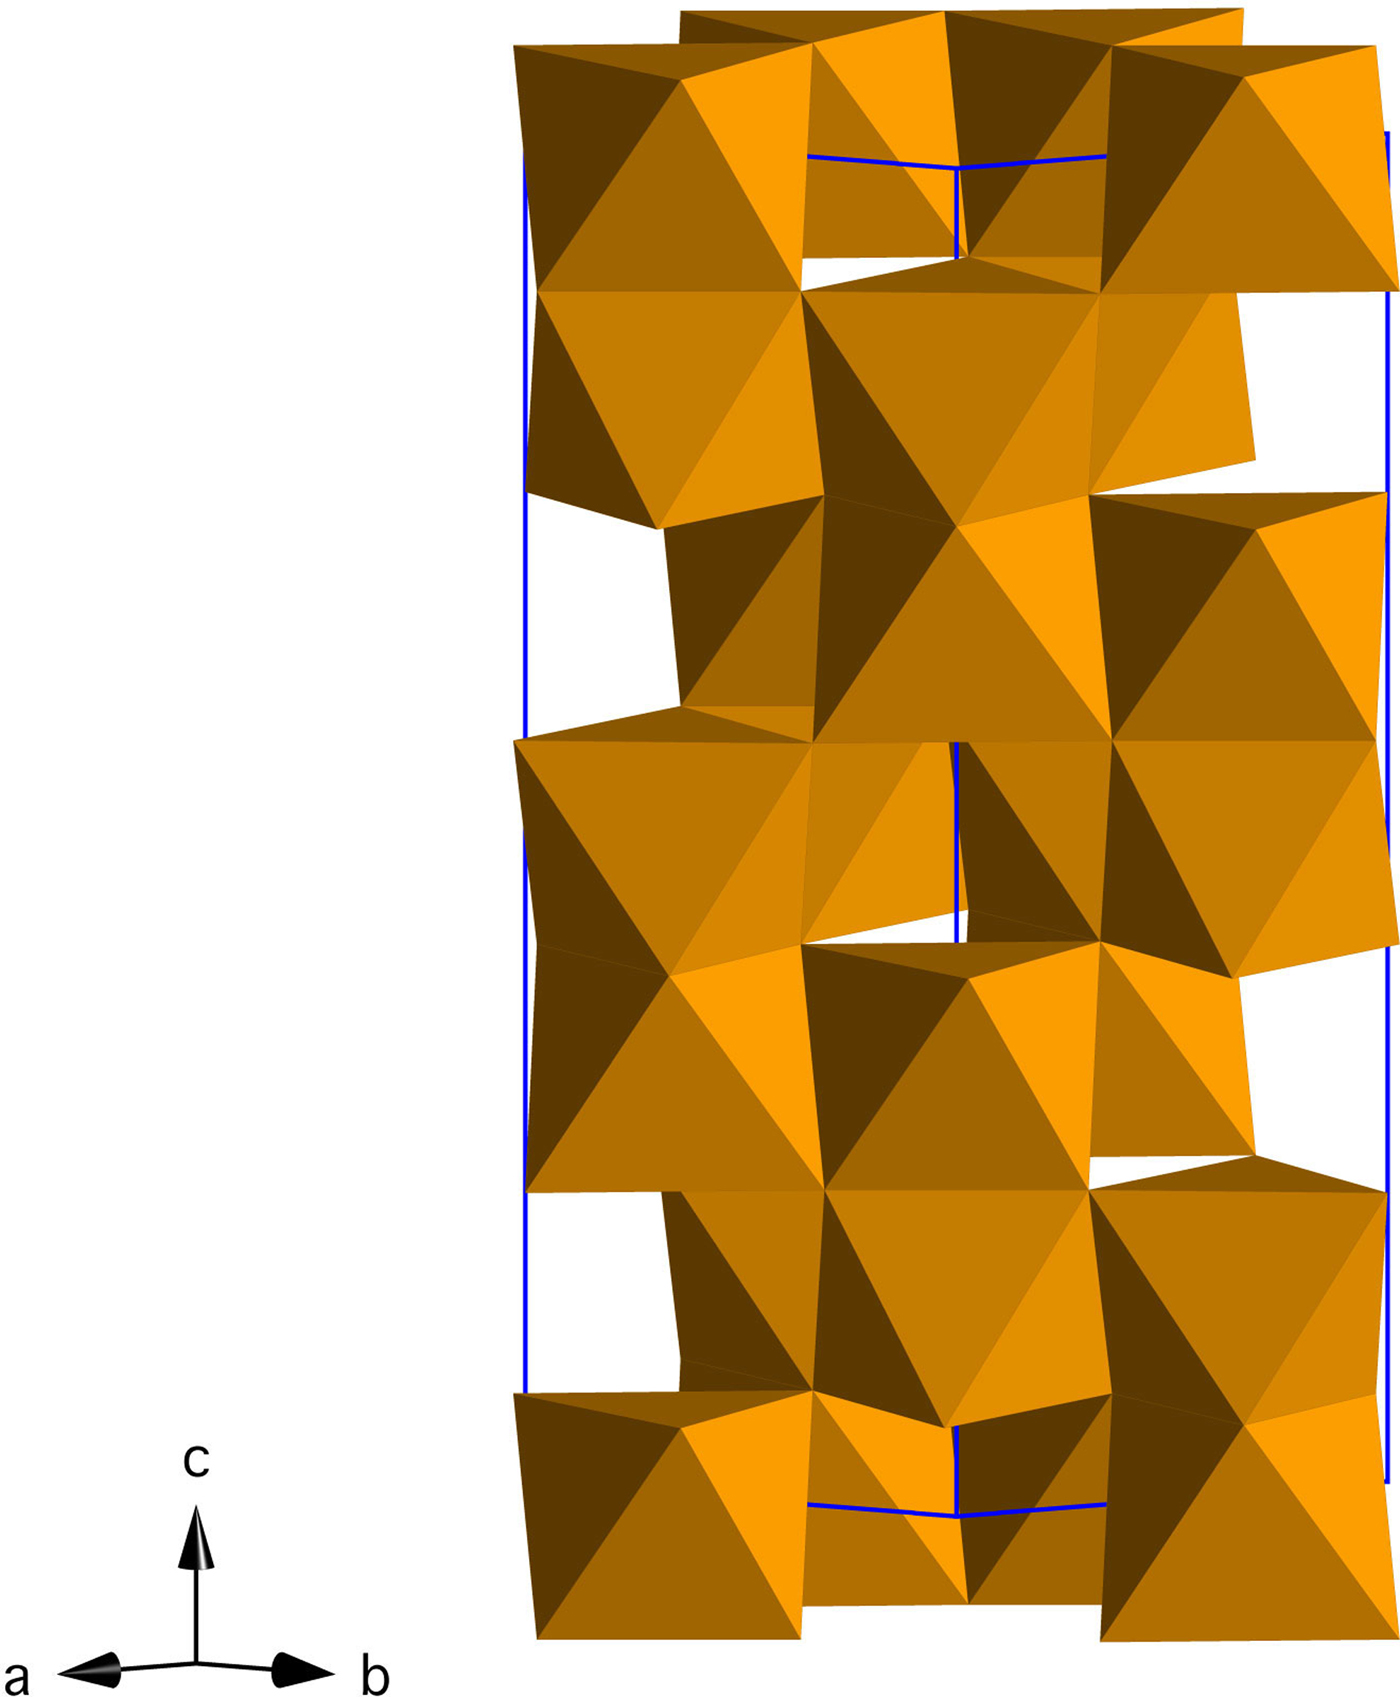
Iron oxides and oxyhydroxides are abundant in terrestrial environments, where they play a central role in iron cycling, trace metal mobility, and redox processes (Cornell and Schwertmann, Reference Cornell and Schwertmann2003; Jickells et al., Reference Jickells, An, Andersen, Baker, Bergametti, Brooks, Cao, Boyd, Duce and Hunter2005; Boyd and Ellwood, Reference Boyd and Ellwood2010). Hematite (α-Fe2O3, space group R-3c; Figure 1) is the most stable iron oxide phase in moderately to highly oxidizing environments, and because of its abundance and low cost, it is exploited in numerous applications (e.g. photoelectrodes, magnetic materials, anodes for Li batteries) (Cornell and Schwertmann, Reference Cornell and Schwertmann2003; Willard et al., Reference Willard, Kurihara, Carpenter, Calvin and Harris2004; Tartaj et al., Reference Tartaj, Morales, Gonzalez-Carreño, Veintemillas-Verdaguer and Serna2011; Wang et al., Reference Wang, Chen and Lou2012; Wheeler et al., Reference Wheeler, Wang, Ling, Li and Zhang2012; Bora et al., Reference Bora, Braun and Constable2013; Hou et al., Reference Hou, Wang, Yang, Fang, Zhang, Wang, Lu, Hu, Zhao and Yang2013; Ma et al., Reference Ma, Zhang, Chen, Li and Han2013; Reddy et al., Reference Reddy, Subba Rao and Chowdari2013; Cheng et al., Reference Cheng, Jiang, Jin, Lin, Zeng and Zhang2014).

Figure 1. (Color online) Crystal structure of hematite (Fe2O3) in the hexagonal setting (R-3c).
One of the most commonly employed manufacturing protocols for hematite involves crystallization from precursor akaganeite [β-FeO(OH,Cl); space group I2/a; Figure 2], which has a hollandite-like structure. In akaganeite, edge-linked octahedral chains form tunnels along (010) that are supported by Cl− or similarly sized anions, such as F− or OH− (Weiser and Milligan, Reference Weiser and Milligan1935; Mackay, Reference Mackay1960; Chambaere and De Grave, Reference Chambaere and De Grave1984; Post and Buchwald, Reference Post and Buchwald1991; Cai et al., Reference Cai, Liu, Gao, Navrotsky and Suib2001; Cornell and Schwertmann, Reference Cornell and Schwertmann2003; Post et al., Reference Post, Heaney, Von Dreele and Hanson2003a). Based on a Rietveld analysis of powder X-ray diffraction data, Post and Buchwald (Reference Post and Buchwald1991) report that Cl fills ~2/3 of the tunnel sites. In natural settings, akaganeite primarily forms in Cl-rich environments, such as meteoritic brines, acid mine drainage soils, and metallic iron corrosion sites (Mackay, Reference Mackay1962; Holm et al., Reference Holm, Dowler, Wadsten and Arrhenius1983; Buchwald and Clarke, Reference Buchwald and Clarke1989; Refait et al., Reference Refait, Ouahman, Forrières and Génin1992; Bland et al., Reference Bland, Kelley, Berry, Cadogan and Pillinger1997; García et al., Reference García, Morales, Arroyave, Barrero and Cook2003; Reguer et al., Reference Reguer, Dillmann and Mirambet2007; Gao and Schulze, Reference Gao and Schulze2010a, Reference Gao and Schulzeb; Bibi et al., Reference Bibi, Singh and Silvester2011; Fonseca et al., Reference Fonseca, Bastos, Baggio-Saitovitch and Sánchez2012; Masa et al., Reference Masa, Pulisova, Bezdicka, Michalkova and Subrt2012; Guo and Barnard, Reference Guo and Barnard2013; Kampf et al., Reference Kampf, Mills, Nestola, Ciriotti and Kasatkin2013; Kuebler, Reference Kuebler2013). In addition, akaganeite was recently identified in Martian mudstones, where its formation is suggestive of hydrothermal conditions (Grotzinger et al., Reference Grotzinger, Sumner, Kah, Stack, Gupta, Edgar, Rubin, Lewis, Schieber and Mangold2014; McLennan et al., Reference McLennan, Anderson, Bell, Bridges, Calef, Campbell, Clark, Clegg, Conrad and Cousin2014; Ming et al., Reference Ming, Archer, Glavin, Eigenbrode, Franz, Sutter, Brunner, Stern, Freissinet and McAdam2014; Vaniman et al., Reference Vaniman, Bish, Ming, Bristow, Morris, Blake, Chipera, Morrison, Treiman, Rampe, Rice, Achilles, Grotzinger, McLennan, Williams, Bell, Newsom, Downs, Maurice, Sarrazin, Yen, Morookian, Farmer, Stack, Milliken, Ehlmann, Sumner, Berger, Crisp, Hurowitz, Anderson, Des Marais, Stolper, Edgett, Gupta and Spanovich2014).
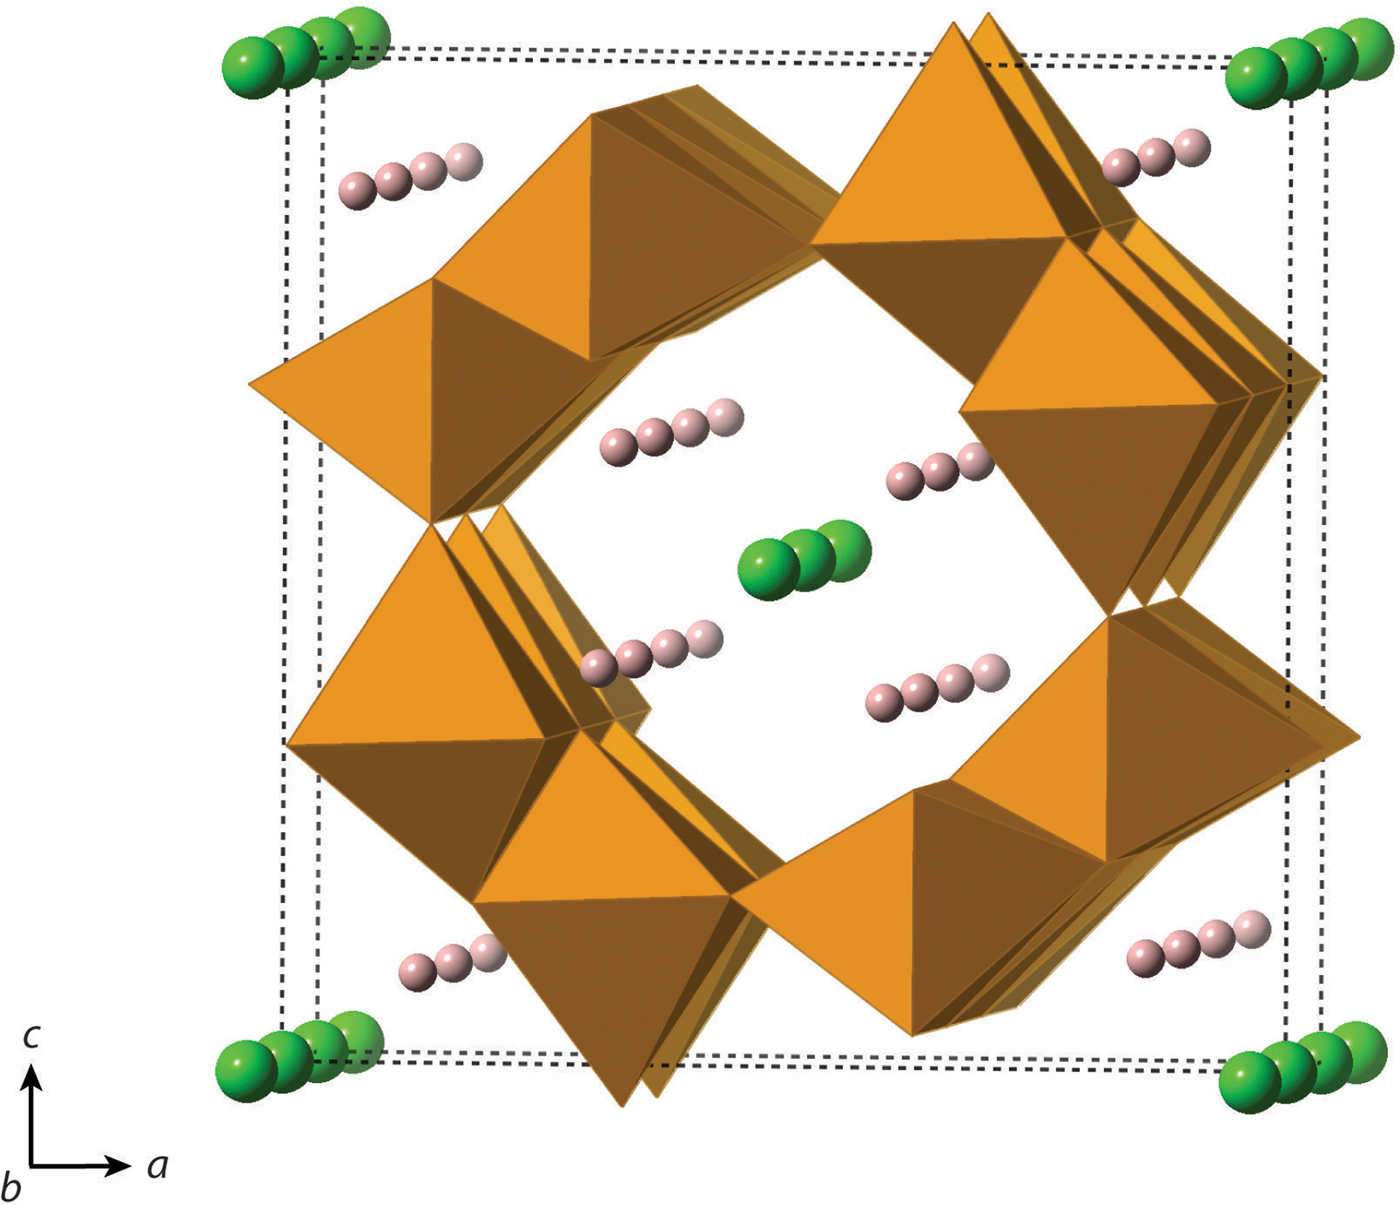
Figure 2. (Color online) Crystal structure of akaganeite, β-FeO(OH,Cl) (I2/m). Cl− is represented by green atoms, and H+ is represented by pink atoms.
Akaganeite itself offers many technological applications because of its large surface area, non-toxicity, and facile synthesis. For instance, akaganeite has been used as a battery anode, as a catalyst for biomedical applications, as an adsorbent for soil remediation, and for CO2 capture (Willard et al., Reference Willard, Kurihara, Carpenter, Calvin and Harris2004; Tabuchi et al., Reference Tabuchi, Katayama, Nukuda and Ogumi2009a, Reference Tabuchi, Katayama, Nukuda and Ogumib; Dutcher et al., Reference Dutcher, Fan, Leonard, Dyar, Tang, Speicher, Liu and Zhang2011; Lammers et al., Reference Lammers, Murphy, Riendeau, Smirnov, Schoonen and Strongin2011; Ali, Reference Ali2012; Chen et al., Reference Chen, Shen, Chen, Wang, Chen and Wang2013; Fütterer et al., Reference Fütterer, Andrusenko, Kolb, Hofmeister and Langguth2013; Kou and Varma, Reference Kou and Varma2013; Kumar et al., Reference Kumar, Bhatnagar, Hogland, Marques and Sillanpää2014). Thus, akaganeite synthesis is the focus of much research.
A widely used technique for the precipitation of akaganeite and hematite involves hydrothermal synthesis in ferric chloride solutions (Matijević and Scheiner, Reference Matijević and Scheiner1978; Bailey et al., Reference Bailey, Brinker and Mecartney1993). The hydrothermal transformation from akaganeite to hematite allows for tailored formation of particles of specific sizes, structures, and morphologies (Wang et al., Reference Wang, Song, Zhao and Yang2008; Li et al., Reference Li, Yu, He and Xu2009; Bora et al., Reference Bora, Braun, Erni, Fortunato, Graule and Constable2011; Geng et al., Reference Geng, Tao, Li and Wei2012; Yang et al., Reference Yang, Xu, Sun, Zhang and Gao2012; Rao et al., Reference Rao, Su, Yang, Wang, Zhen and Ling2013). Consequently, much research has focused on the particle size and morphological evolution of akaganeite and hematite particles in the absence and presence of shape-controlling additives.
The details of the hydrothermal structural transformation from akaganeite to hematite are not well documented, and ex situ structural analyses may not accurately represent the reaction mechanisms. For example, Peterson et al. (Reference Peterson, Heaney, Post and Eng2015) described a lower symmetry hematite phase, “monoclinic hydrohematite” (space group I2/m), from in situ hydrothermal time-resolved X-ray diffraction (TR-XRD) experiments at 200 °C. In that study, we were not able to isolate this phase ex situ, and we suggested that the stability of monoclinic hydrohematite particles might be extremely sensitive to changes in hydration state and temperature. Thus, the in situ nature of our TR-XRD experiments allowed us to capture a phase that is less accessible through dry heating experiments. Furthermore, the structure of Fe (hydr)oxides can be directly impacted by post-synthesis treatments. For instance, Ellis et al. (Reference Ellis, Giovanoli and Stumm1976) found that akaganeite specimens are depleted in Cl after washing with water and are more susceptible to electron beam damage when viewed by TEM. Likewise, Ishikawa and Inouye (Reference Ishikawa and Inouye1975) altered the Cl content of akaganeite specimens by washing with different solutions for variable periods of time.
In Peterson et al. (Reference Peterson, Heaney and Post2016), we presented a kinetic analysis of the hydrothermal nucleation and growth of akaganeite and its transformation to hematite. In the present paper, we describe the changes in crystal structure that accompany these reactions using TR-XRD and Rietveld analysis. To our knowledge, this is the first continuous study of the crystallographic changes that occur during the hydrothermal formation of akaganeite and its transformation to hematite. We focused our analyses on a preparation method described by Matijević and Scheiner (Reference Matijević and Scheiner1978) for the formation of akaganeite and subsequent hematite transformation to study the effects of temperatures between 100 and 200 °C. We used synchrotron diffraction with a sealed autoclave cell to conduct TR-XRD experiments in situ. The data presented are part of a larger study of the transformation of akaganeite to hematite (Peterson et al., Reference Peterson, Heaney and Post2016).
II. EXPERIMENTAL METHODS
A. Sample preparation
All hydrothermal crystallization experiments were performed with solutions containing 0.45 M FeCl3 and 0.01 M HCl, prepared by dilution with deionized water of a 3 M FeCl3 stock solution made with FeCl3·6H2O (ACS reagent, JT Baker, Phillipsburg, NJ, USA) and 1 M HCl (ACS reagent, Fisher Scientific, Fair Lawn, NJ, USA) (Matijević and Scheiner, Reference Matijević and Scheiner1978). Final solutions were passed through 0.05 µm Millipore filters and stored in sealed Nalgene bottles. For each hydrothermal precipitation experiment, ~7 µl of the 0.45 M FeCl3 solution were loaded into 1.0 mm-outer diameter quartz glass capillaries (Charles Supper Company) and sealed with high-temperature epoxy (302–3 M, Epotek). The reaction vessel can play a major role in determining particle properties and reaction kinetics (Hamada and Matijević, Reference Hamada and Matijević1982; Kandori et al., Reference Kandori, Tamura and Ishikawa1994; Demopoulos, Reference Demopoulos2009), and solution volumes, capillary lengths, and amount of headspace were kept as similar as possible to ensure temperature uniformity during heating and to minimize variations among samples. The starting and final pH of the solution was ~1.4 and 1.0, respectively.
B. Synchrotron X-ray diffraction
The in situ TR-XRD experiments were conducted at the GeoSoilEnviroCARS (GSECARS) 13-BM-C beamline at the Advanced Photon Source (APS), Argonne National Laboratory (ANL). The X-ray wavelength was 0.8265(8) Å, and the detector distance was 95.165 mm. Because of low precipitate yield during in situ experiments, capillaries were tilted at 60° from the horizontal plane to allow for precipitate sedimentation to the bottom of the capillary (Figures 3 and 4). The beam was aimed near the capillary base, enabling the capture of the initial precipitation of akaganeite from solution and the phase transformation to hematite. Each sample was rotated about Φ (parallel to the axis of the capillary) by 1° per second during exposure to promote solution mixing and to minimize preferred orientation effects in the X-ray diffraction patterns. Video images of the capillary solutions revealed vigorous convection of the solutions throughout the heating experiments, suggesting that the solutions were well-mixed and homogeneous.
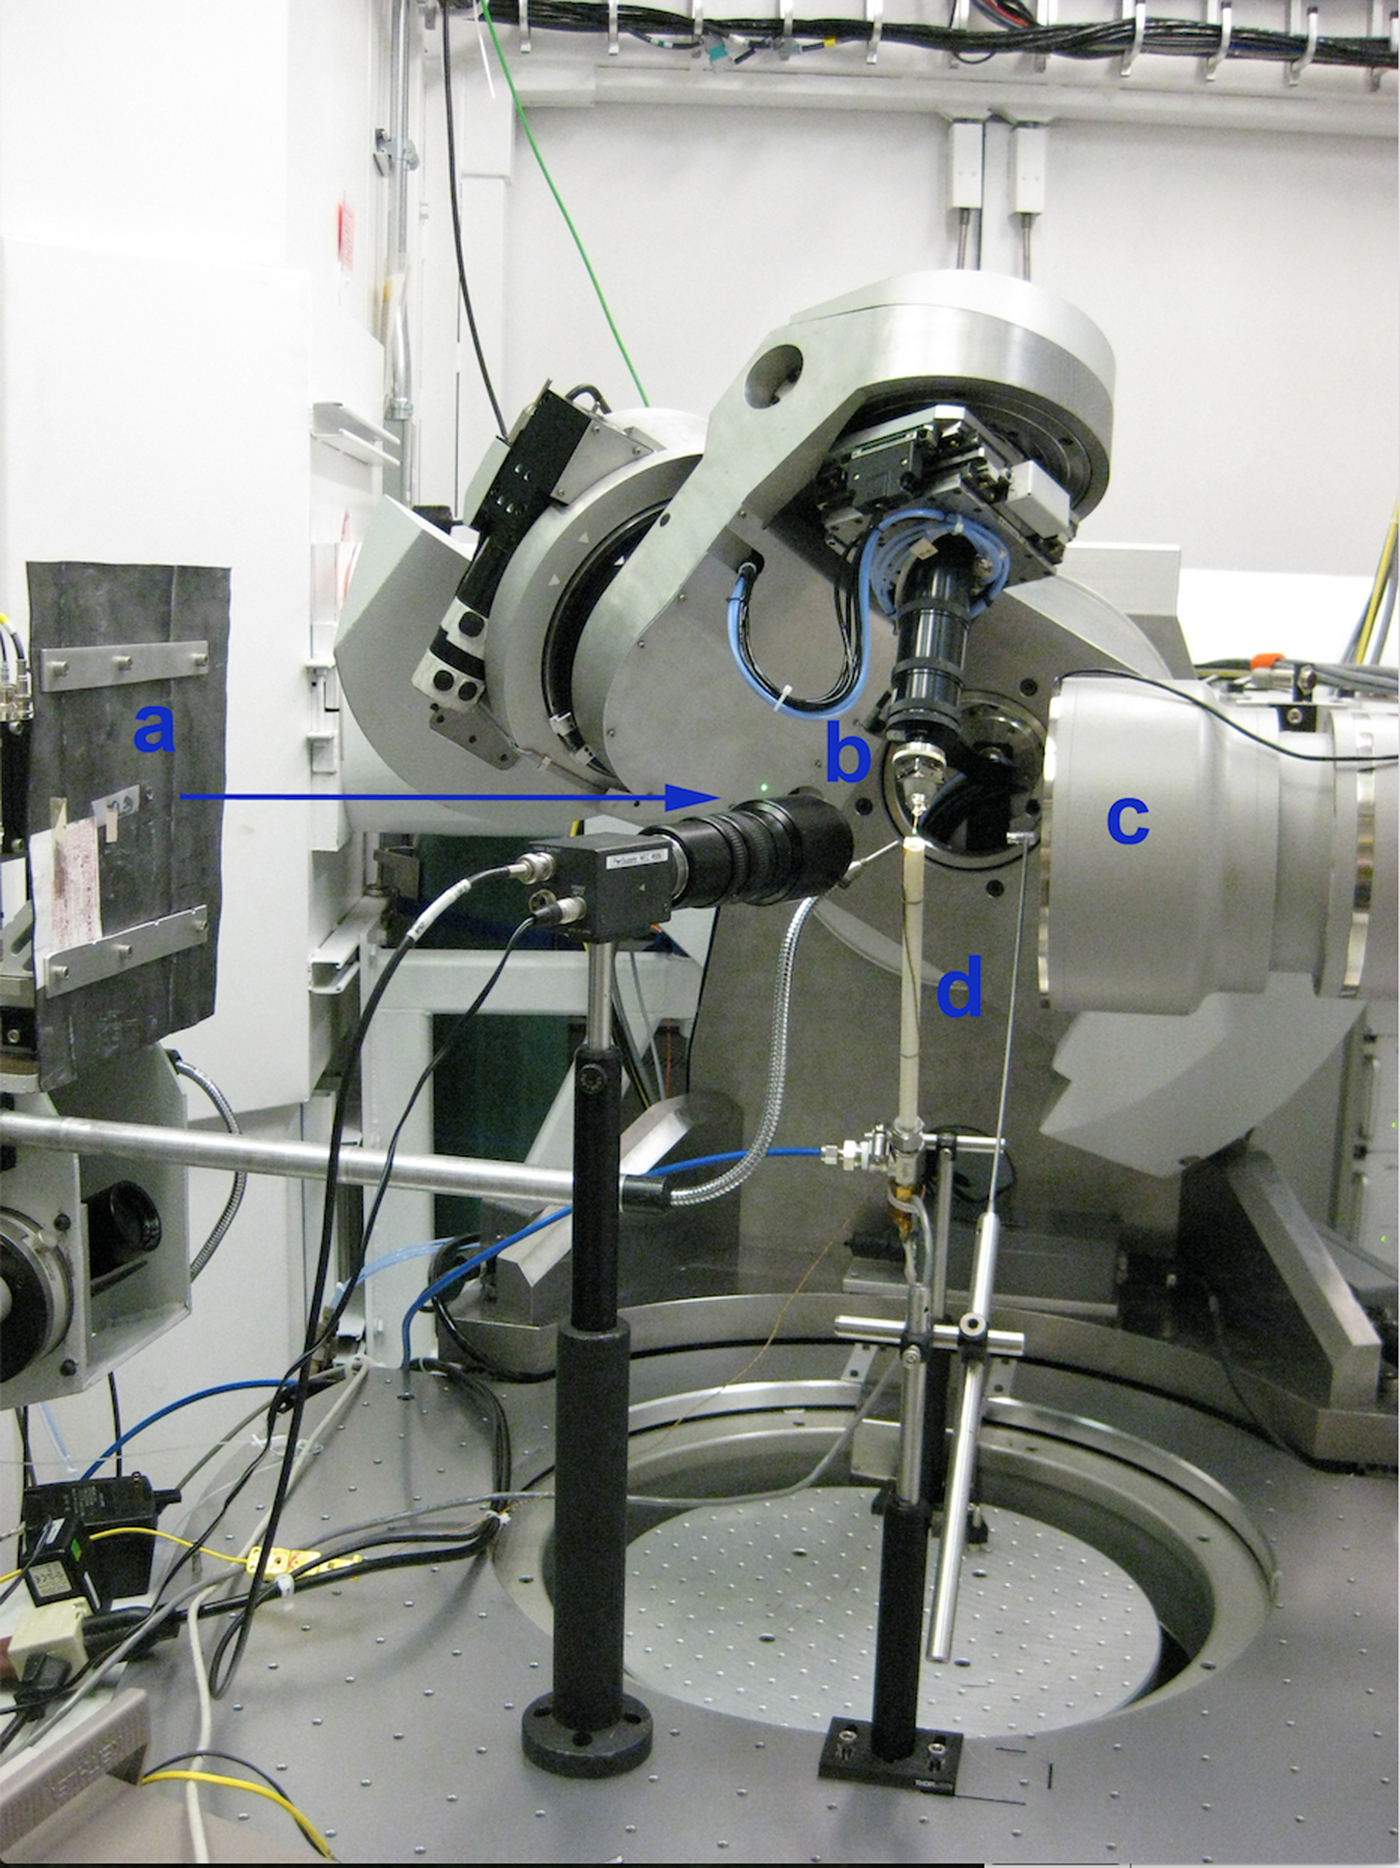
Figure 3. (Color online) Experimental setup at APS. (a) The X-ray beam is aimed at the base of the capillary (b), which is tilted at 60° from the horizontal plane. (c) Area detector. (d) The forced gas heater is positioned beneath the capillary.
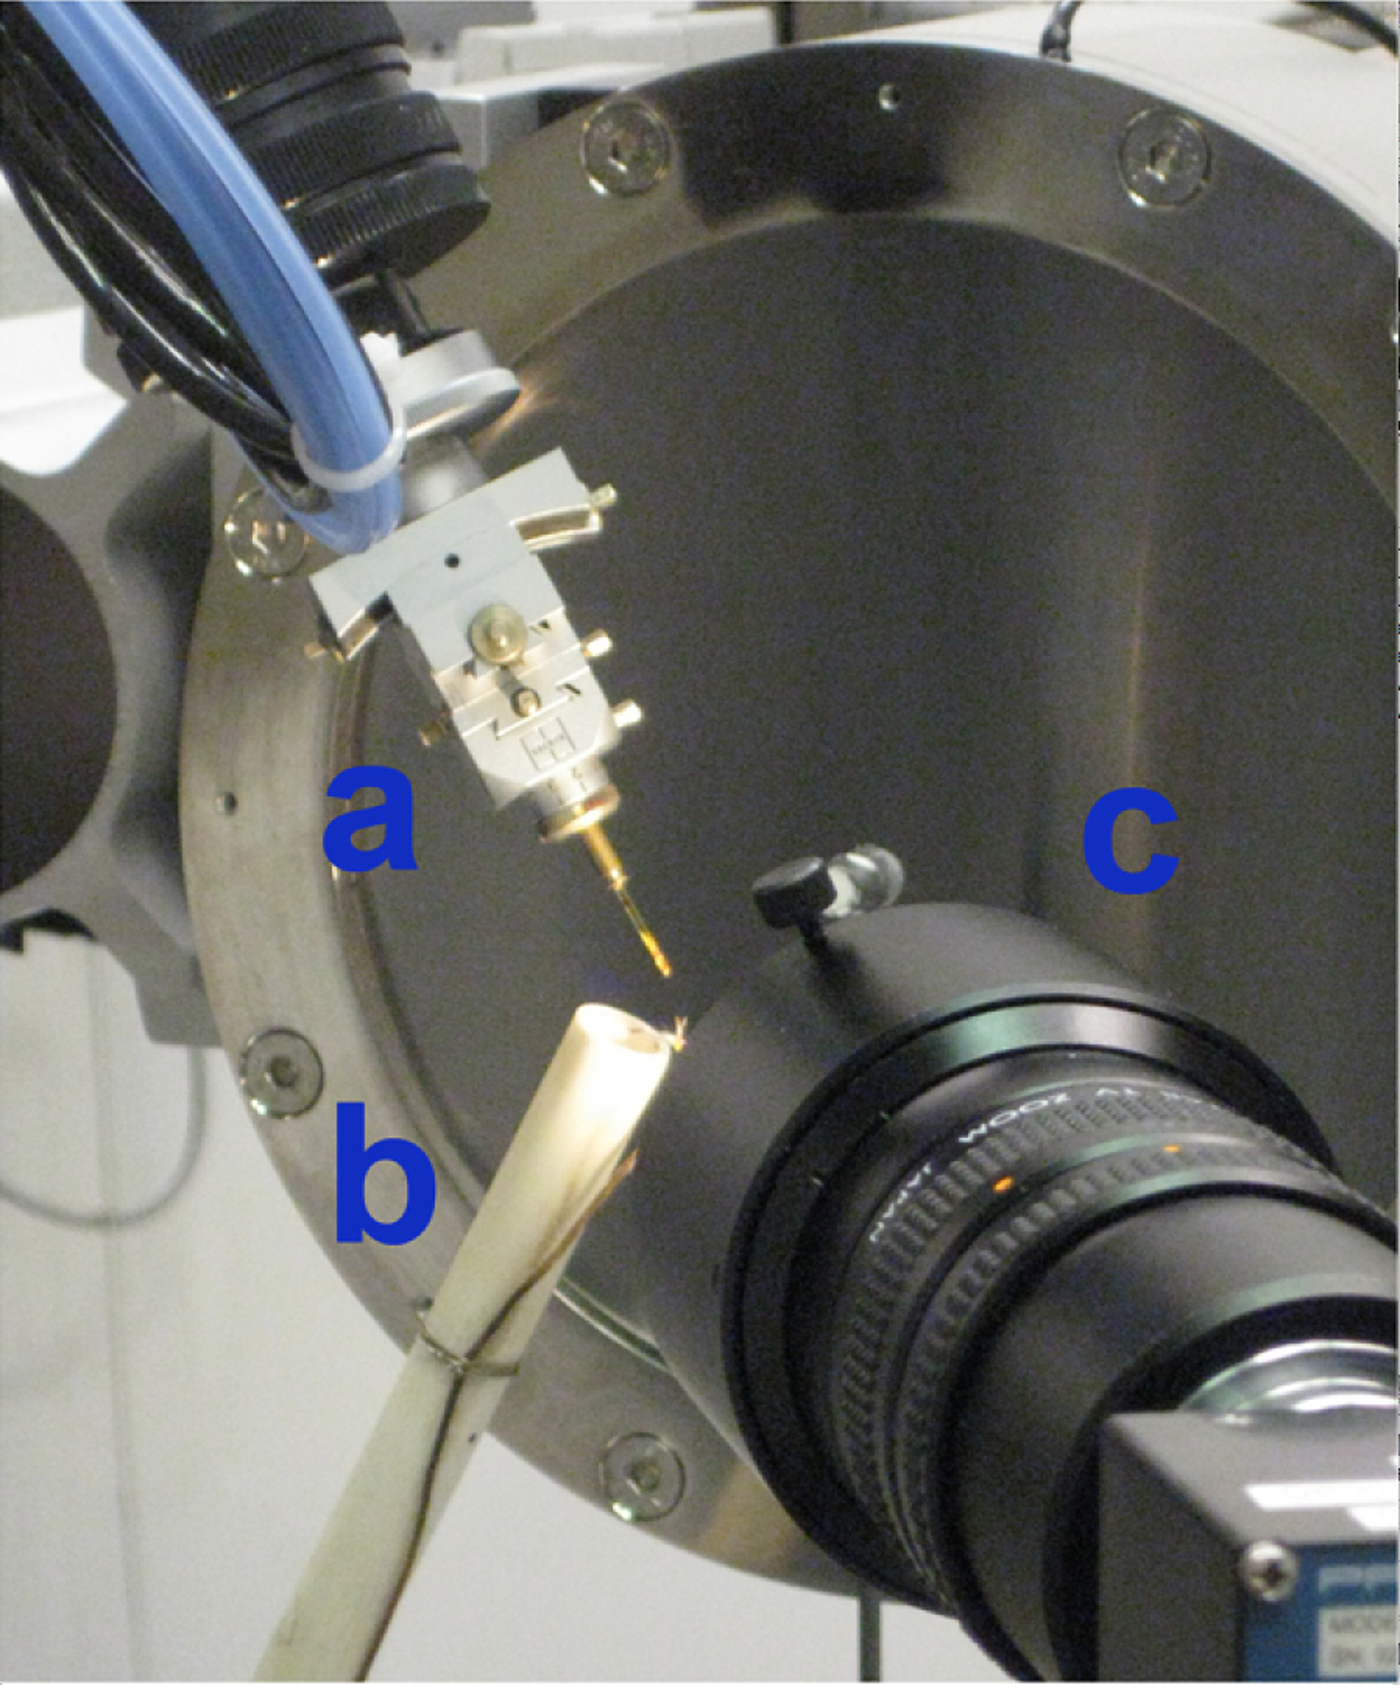
Figure 4. (Color online) Experimental setup at APS. (a) The capillary is tilted at a 60° angle from horizontality. (b) The heater is oriented nearly normal to the capillary. The diameter of the outer cylinder sleeve and the capillary length are both ~1 cm to ensure the entire sample volume was heated. A video camera (c) is placed near the capillary to collect video footage of the precipitation of akaganeite and transformation to hematite.
A forced-gas heater was fabricated at APS by winding Ni coils around an inner ceramic tube with an applied DC voltage using a Sorensen 33 V × 33 A (Model XHR 33-33) power supply to achieve resistive heating. This assembly was encased in an outer ceramic sleeve, and He gas was forced through the interior of the heated cylinder. The diameter of the outer cylinder sleeve and the capillary length were both 1 cm to ensure that the entire sample volume was heated (Figure 4). The heater was oriented approximately normal to the capillary, and a type K chromel–alumel thermocouple was situated adjacent to the capillary and monitored with a Keithly 2700 Multimeter. The actual temperature was calibrated by monitoring two phase transformations of RbNO3 (Alfa Aesar, 99.8%, metals basis) loaded in a 1.0 mm quartz glass capillary and heated from 25.7 to 250 °C. Based on this standardization, we estimate that the temperature measured by the thermocouple was within ±1.5 °C of the actual temperature.
For our experiments, capillary solutions were heated to final temperatures of 100, 150, 175, and 200 °C. Solution heating began after the diffraction pattern of the starting solution at room temperature was completed. Experimental temperatures were reached within 2 min, and were maintained within ±0.25 °C using the EPICS controller software. TR-XRD patterns were collected every 25–40 s using a MAR165 CCD camera for run times ranging from 10 to 160 min. Full-circle images were integrated into intensity vs. 2θ plots using the program Fit2D with a polarization factor of 0.99 (Hammersley et al., Reference Hammersley, Svensson, Hanfland, Fitch and Hausermann1996). Duplicate runs at temperatures of 150, 175, and 200 °C showed excellent agreement. The similarity in the calculated induction times (39.2 ± 2.8 s) and induction temperatures (122.7 ± 4.5 °C) for experiments between 150 and 200 °C indicated that both the heating rate and solution temperatures were reproducible (Table I).
C. Structure refinement
Rietveld structure refinements were performed using the EXPGUI interface of the General Structures Analysis System (GSAS) program (Toby, Reference Toby2001; Larson and Von Dreele, Reference Larson and Von Dreele2004). The akaganeite structure parameters were taken from Post et al. (Reference Post, Heaney, Von Dreele and Hanson2003a). For experiments at 175 °C and below, the R-3c hematite structure parameters were taken from Blake et al. (Reference Blake, Hessevick, Zoltai and Finger1966). The monoclinic hydrohematite parameters used in experiments at 200 °C were taken from Peterson et al. (Reference Peterson, Heaney, Post and Eng2015). Background, scale, peak profile, and unit-cell parameters were initially allowed to vary. Backgrounds were best fitted using a Chebyshev polynomial with 10–12 profile terms. Peak profiles were modeled using a pseudo-Voigt function described by Thompson et al. (Reference Thompson, Cox and Hastings1987). After these parameters had converged, Fe, O, and Cl atomic positions, hematite Fe occupancies, and akaganeite Cl occupancies were refined. Soft constraints were imposed on akaganeite and monoclinic hydrohematite Fe–O bond lengths.
Akaganeite Fe–O bond lengths were constrained to distances close to those provided in Post and Buchwald (Reference Post and Buchwald1991) and Post et al. (Reference Post, Heaney, Von Dreele and Hanson2003a) (1.91–2.15 Å). Soft constraints in the range of 1.90–2.17 Å were imposed on Fe–O bond lengths for monoclinic hydrohematite when both akaganeite and monoclinic hydrohematite phases were present. The bond restraint weighting factor was gradually reduced during the refinements. Lastly, all parameters were allowed to refine simultaneously and the weighting factor was set at to zero, except for akaganeite bond length restraints, which were set to one. Refining isotropic temperature factors generated negative values, and therefore, in all TR-XRD refinements, we fixed temperature factors to those provided in Post et al. (Reference Post, Heaney, Von Dreele and Hanson2003a) for akaganeite and to those determined from the structure refinement of an R-3c hematite standard. We prepared this standard using the same ferric chloride solution as was employed for the in situ TR-XRD experiments (0.45 M FeCl3 and 0.01 M HCl). The solution was sealed in a Teflon-lined bomb and heated to 150 °C in a convection oven for 1 h. The final goodness-of-fit parameters for the refinement of the standard hematite were: χ 2 = 0.8290, R wp = 0.0099, and RF2 = 0.0095. The 2θ range for all refinements was 15.4° to ~36° (d-space range: 1.3–3.1 Å); low-angle data were removed because of the large background scattering from the capillary glass and water. Representative refinements for hydrothermal single-phase akaganeite and hematite as well as a mixed-phase assemblage are presented in Figure 5 and Table II.
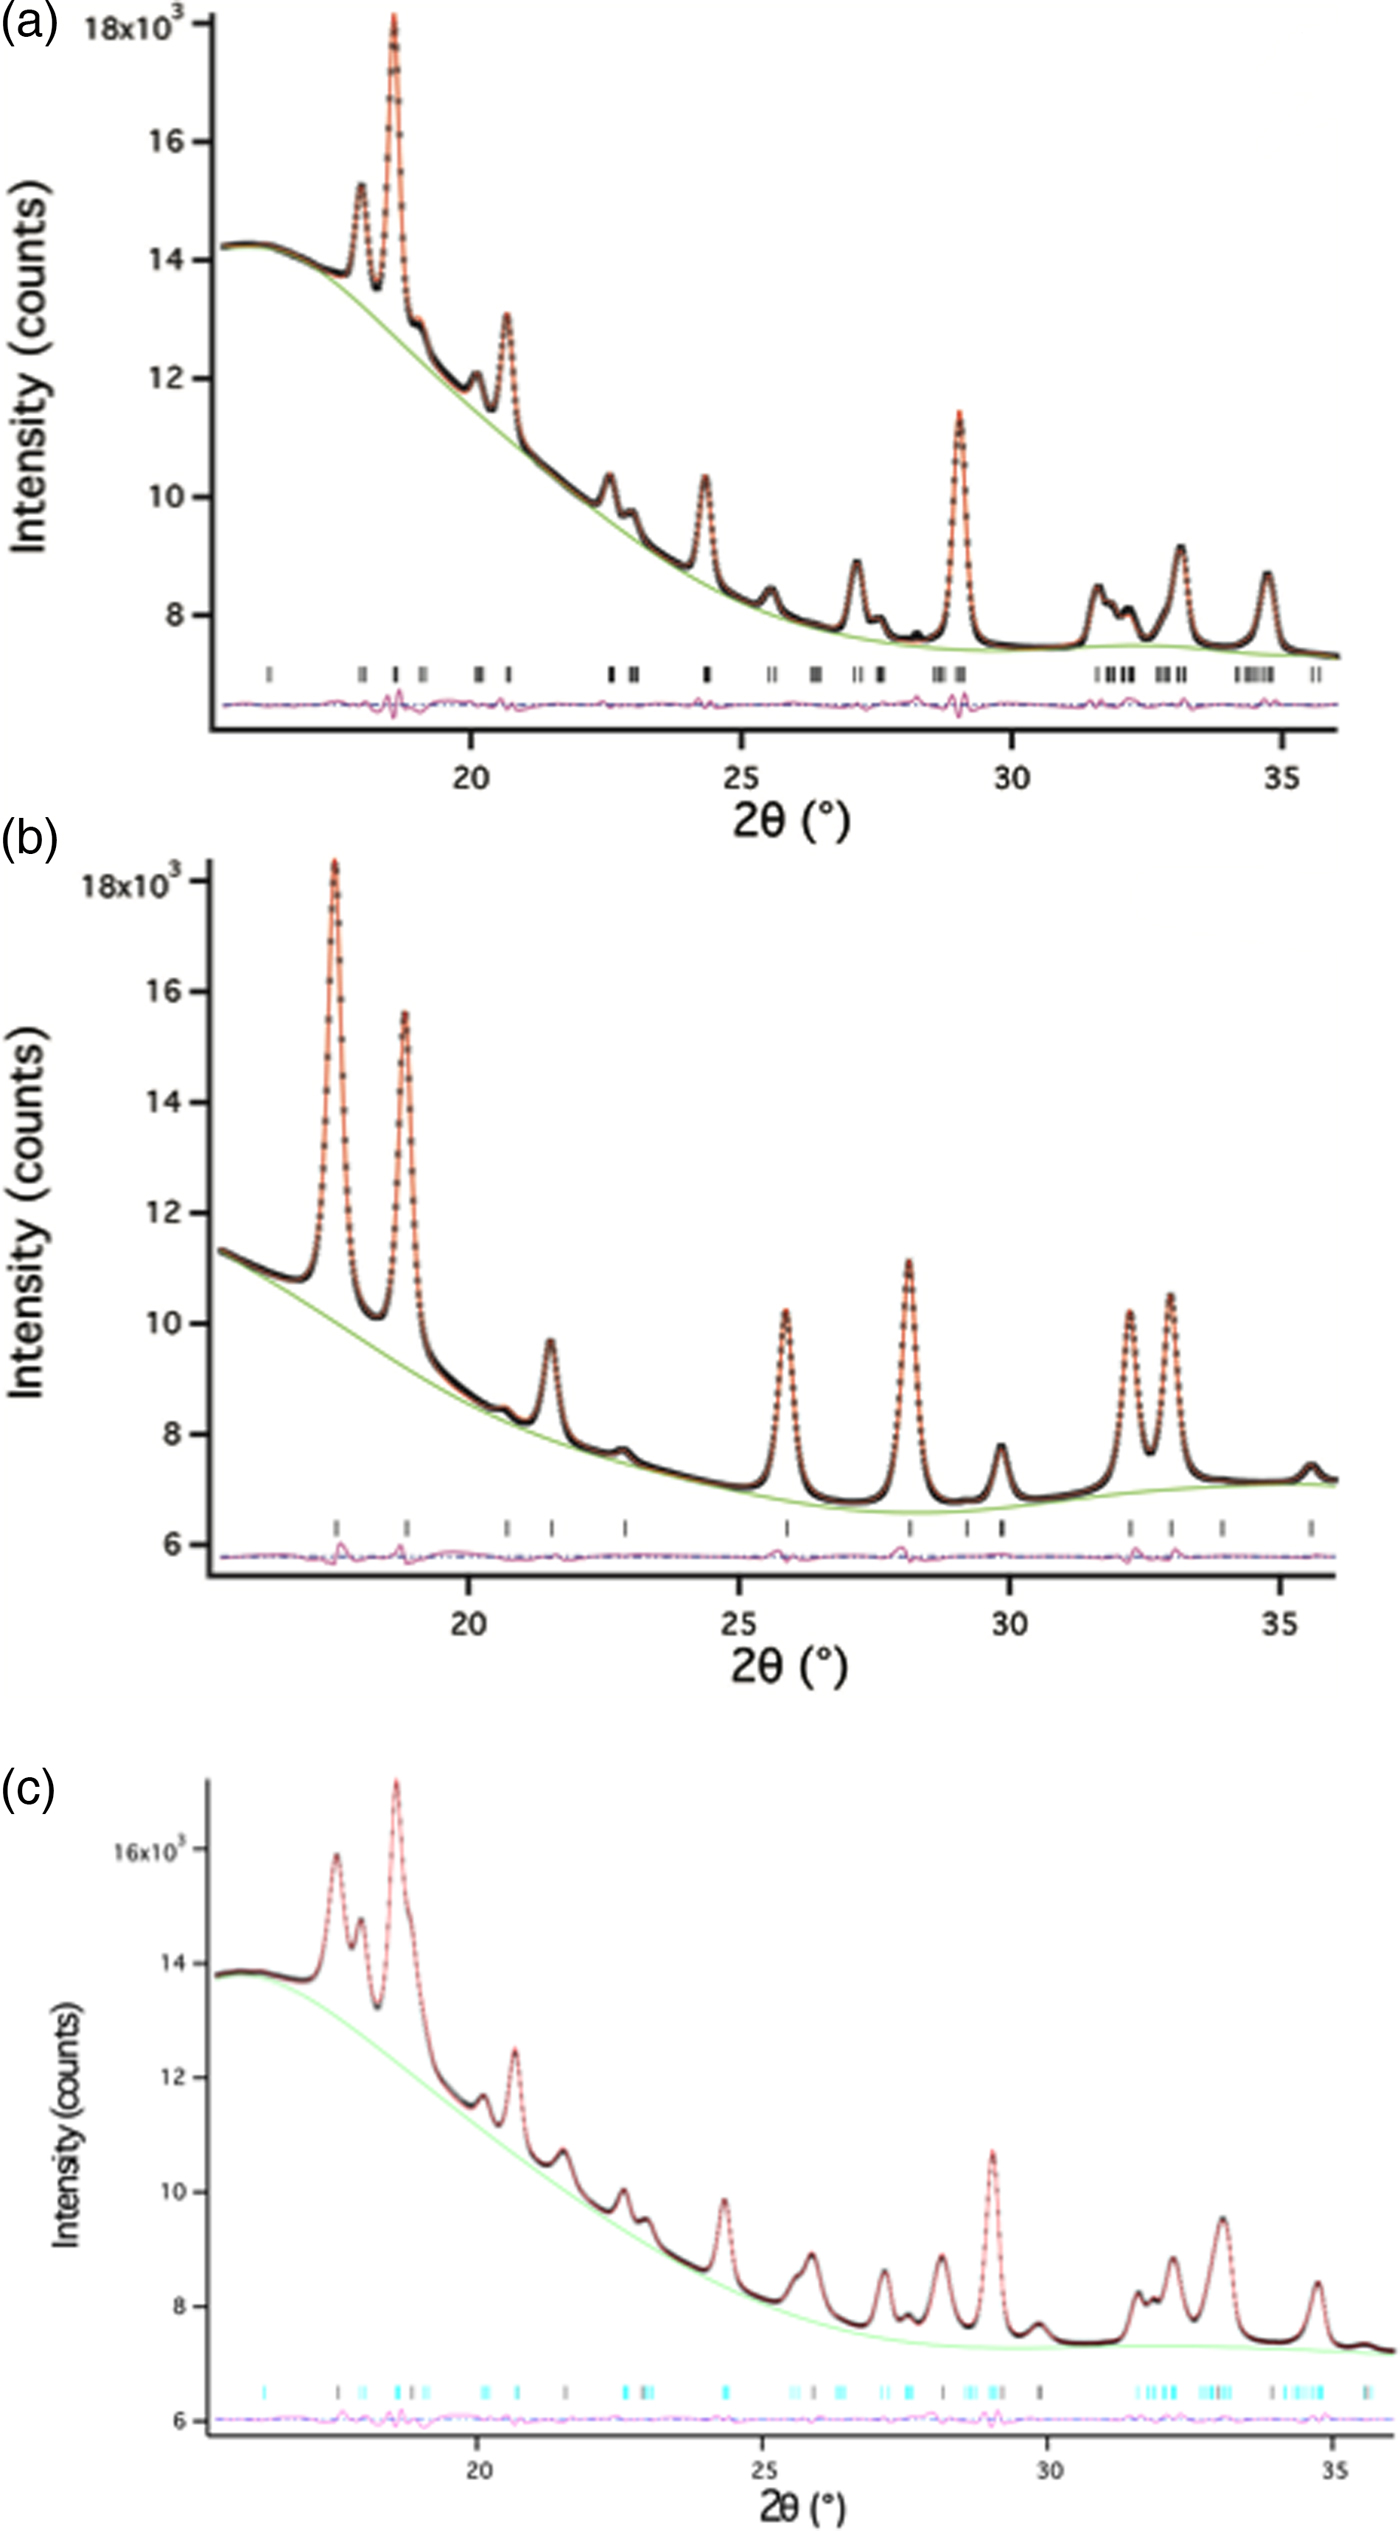
Figure 5. (Color online) Representative Rietveld refinements of (a) akaganeite, (b) hematite, and (c) a mixture of akaganeite and hematite. The data are from an experiment at 175 °C. The data and fits are represented by: observed data (black x’s), calculated (red line), differences (pink line), and reflections for each phase (horizontal black lines).
The changes in phase abundance, α, were calculated by normalizing GSAS refined scale factors obtained for each phase:
 $$\alpha = \displaystyle{{S_{\rm t}} \over {S_{\max}}} $$
where S t is the scale factor at a given time and S max is the maximum scale factor value for the particular experiment. Crystallite size, p (Å), was calculated using Rietveld analysis through the following relation:
 $$p = \displaystyle{{18\,000\,K\lambda} \over {\pi X}}$$
where K is the Scherrer constant (0.94) and X represents the Lorentzian broadening contribution to peak widths, which is represented in GSAS by the profile parameter “L x” (Larson and Von Dreele, Reference Larson and Von Dreele2004).
III. RESULTS AND DISCUSSION
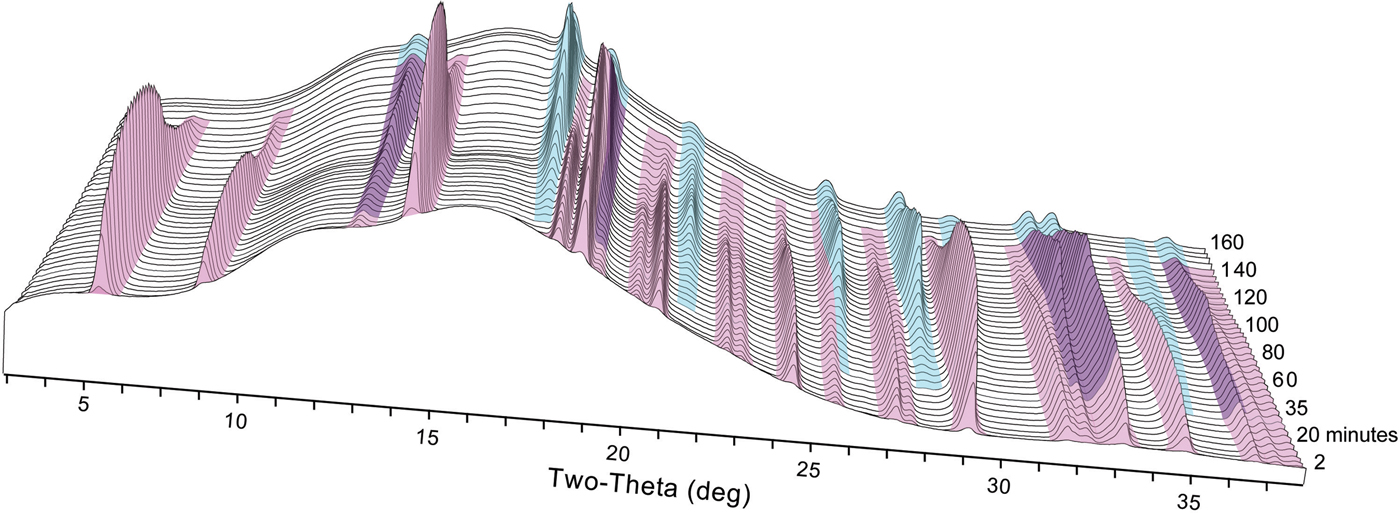
We observed the nucleation, growth, and dissolution of akaganeite and transformation to hematite using synchrotron TR-XRD during experiments with temperatures of 150, 175, and 200 °C (Figure 6). At 100 °C, we were able to detect only the nucleation and growth of akaganeite because of the slow transformation kinetics, which can take approximately a week to yield hematite (Matijević and Scheiner, Reference Matijević and Scheiner1978). All induction times, onset of dissolution, and completion of dissolution times are presented in Table I.

Figure 6. (Color online) Representative time series of X-ray diffraction patterns collected at 150 °C. Akaganeite peaks are colored pink, and hematite peaks are colored blue.
Table I. Nucleation temperatures, induction and dissolution times, as determined by JMAK kinetic analyses and heater calibration for akaganeite and hematite.

a t heater: extrapolated time of heater initiation (see Peterson et al., Reference Peterson, Heaney and Post2016).
b t 0: induction time calculated from the beginning of XRD data collection (t = 0).
c t 0, adj: induction time corrected for t heater.
d Average values of T nuc., t 0, adj were calculated using 150–200 °C data.
A. TR-XRD experiments
As described in Peterson et al. (Reference Peterson, Heaney and Post2016), temperature, rather than induction time, drove the nucleation of akaganeite when the temperature was 150 °C or higher. Our TR-XRD data showed that the onset of akaganeite nucleation occurred immediately after the heater attained a temperature of ~123 °C (Table I). This temperature was reached within ~40 s for all samples. For our experiments at 100 °C, which is below the 123 °C threshold, the induction time for akaganeite nucleation was 9 min.
Hematite nucleation was first detected just before or coincident with the onset of akaganeite dissolution at all temperatures. The refined akaganeite phase abundances attained between 98 and 100 wt% of their maximum values at the moment of the first detectable hematite precipitation. On the other hand, the complete dissolution of akaganeite seemed to be closely related to temperature. At 200 °C, akaganeite was fully dissolved at an earlier stage relative to the abundance of hematite than at 150 and 175 °C. Specifically, during the experiments at 150 and 175 °C, akaganeite was no longer detected when hematite reached ~85% of its ultimate abundance. During the 200 °C experiment, however, akaganeite had disappeared once the hematite phase abundance reached 57 wt% of its final abundance. Our kinetic analyses reported in Peterson et al. (Reference Peterson, Heaney and Post2016) revealed that the rate constants of akaganeite dissolution and hematite precipitation were approximately equal during the experiments at 150 and 175 °C. However, at 200 °C, the rate of akaganeite dissolution was twice as large as the rate of hematite precipitation.
B. Structural changes during crystallization and dissolution
Rietveld analyses of time-resolved data showed that unit-cell parameters varied with temperature and with extent of reaction, although the changes in unit-cell parameters were subtle (Figures 7–10). The data points in these graphs are larger than the errors reported by GSAS, but as concentrations diminished, the peak-to-background intensities decreased and the real error is suggested by the scatter in the data. Since the XRD patterns with abundances below 5 wt% could not be reliably refined, only unit-cell data for akaganeite and hematite phase abundances above ~5 wt% are included. For purposes of comparison, the monoclinic unit-cell parameters for the hydrohematite generated at 200 °C are recast using a pseudo-hexagonal unit cell.
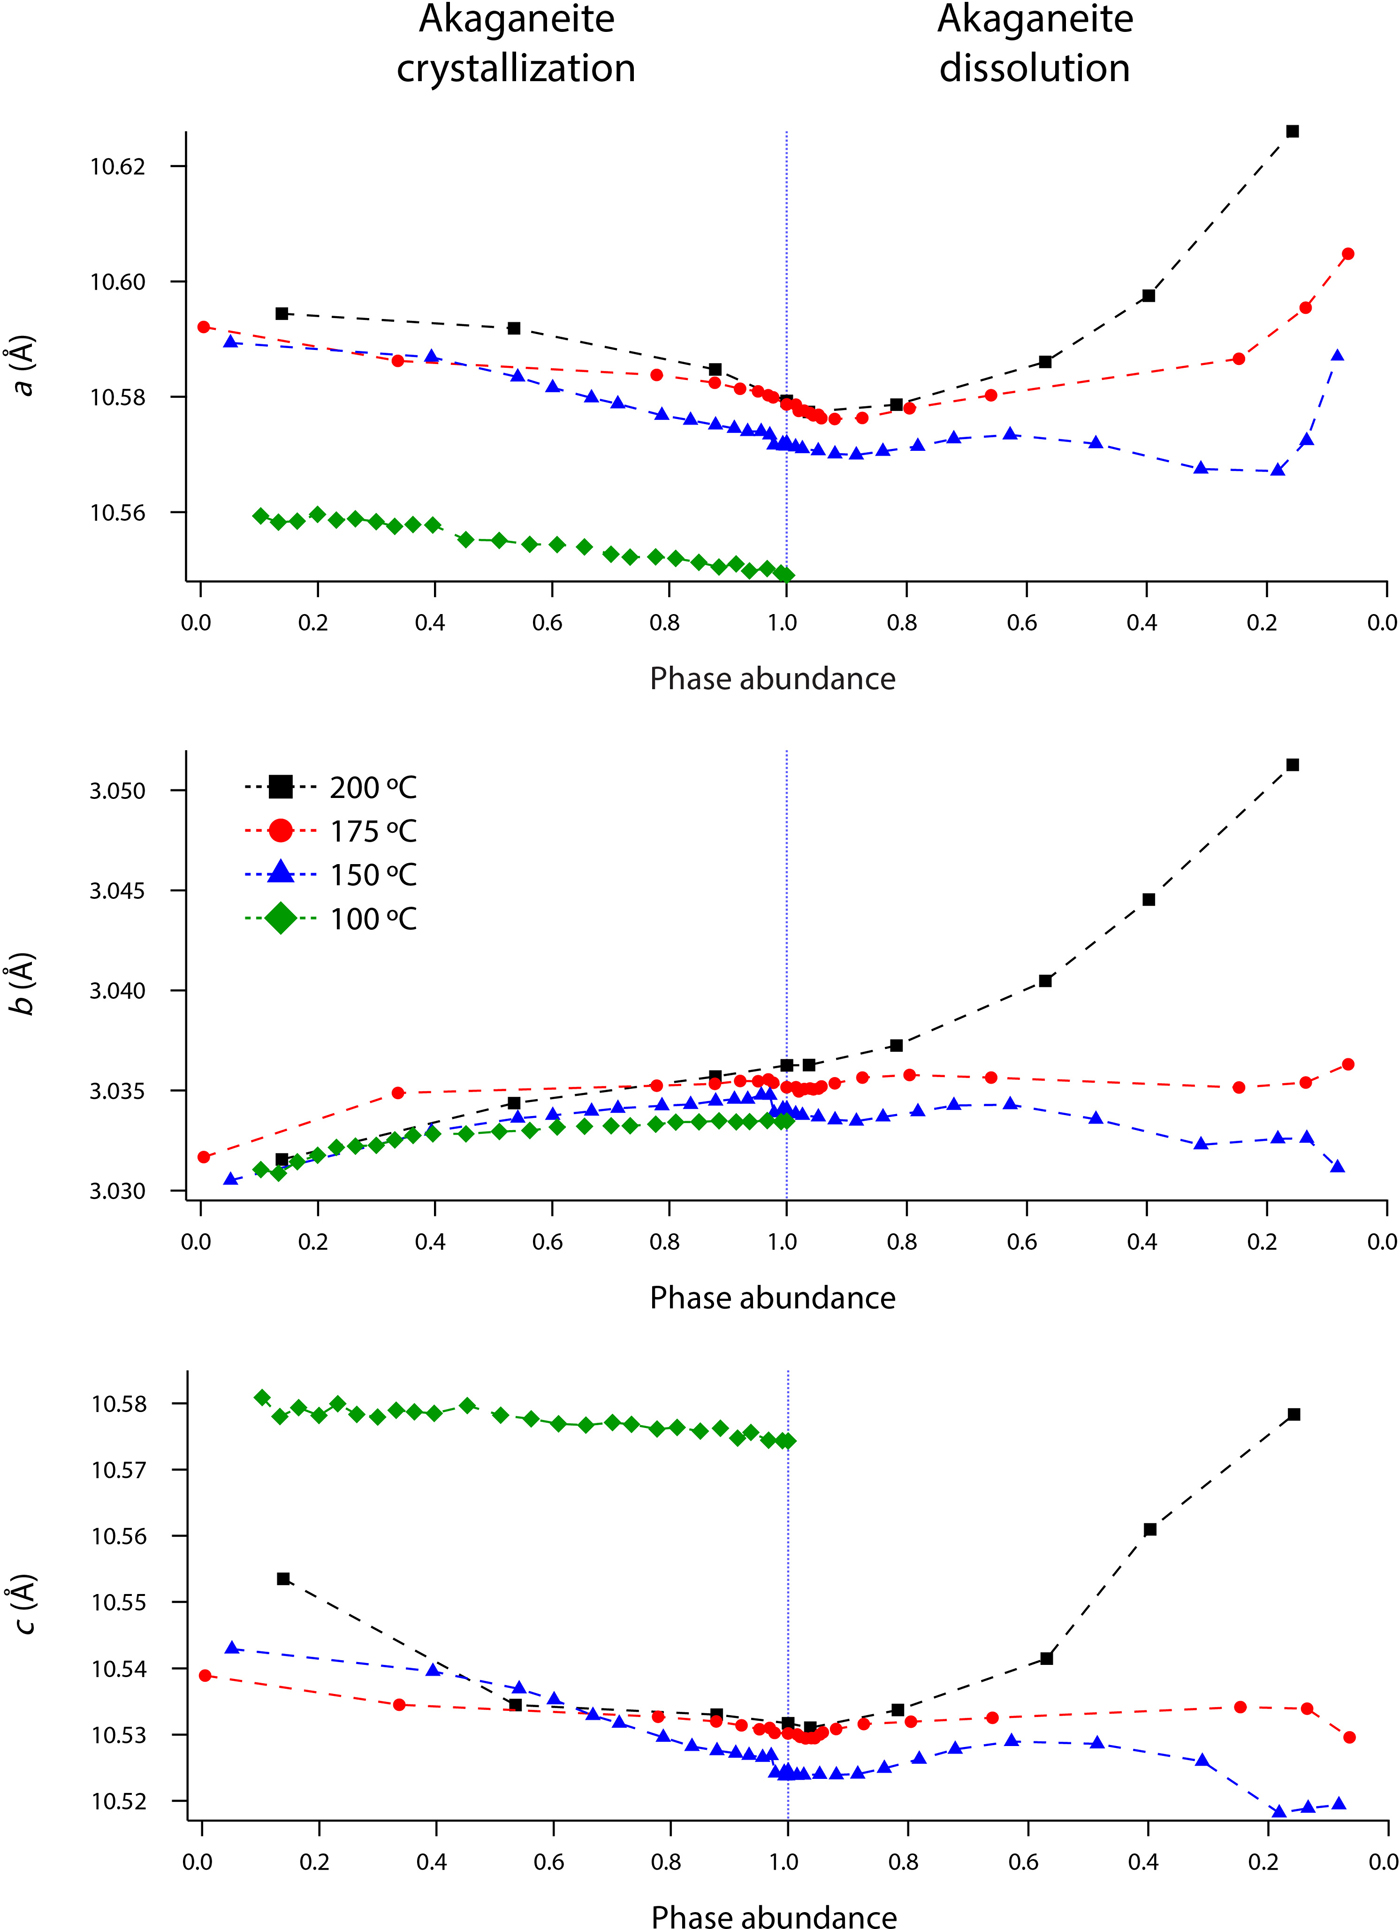
Figure 7. (Color online) Changes in akaganeite a, b, and c at 100 (green diamonds), 150 (blue triangles), 175 (red circles), and 200 °C (black squares) as a function of akaganeite phase abundance.
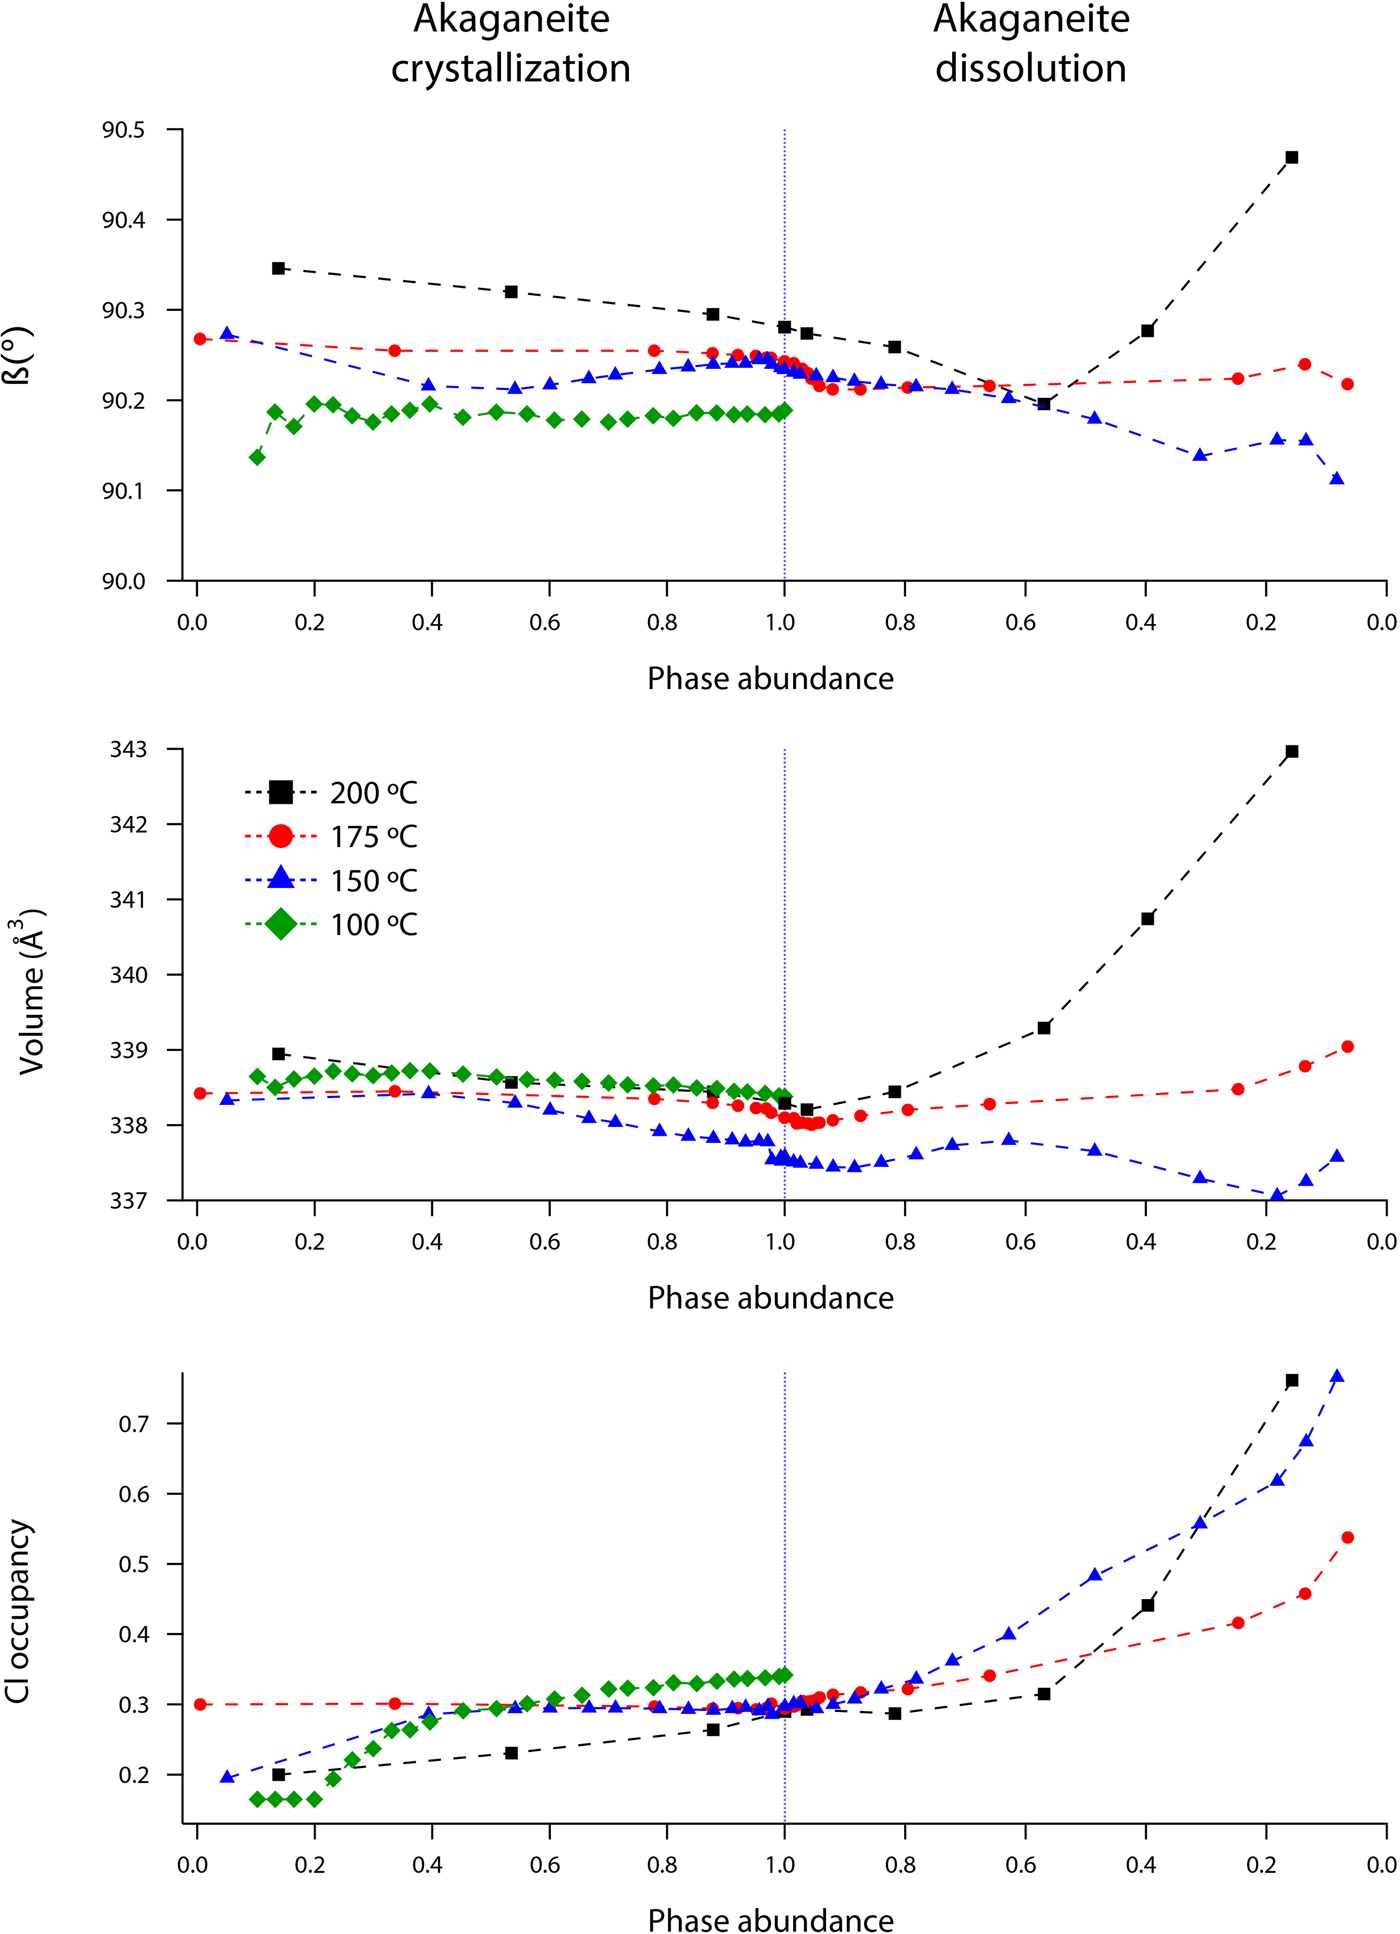
Figure 8. (Color online) Changes in akaganeite β, volume, and Cl occupancy at 100 (green diamonds), 150 (blue triangles), 175 (red circles), and 200 °C (black squares) as a function of akaganeite phase abundance.

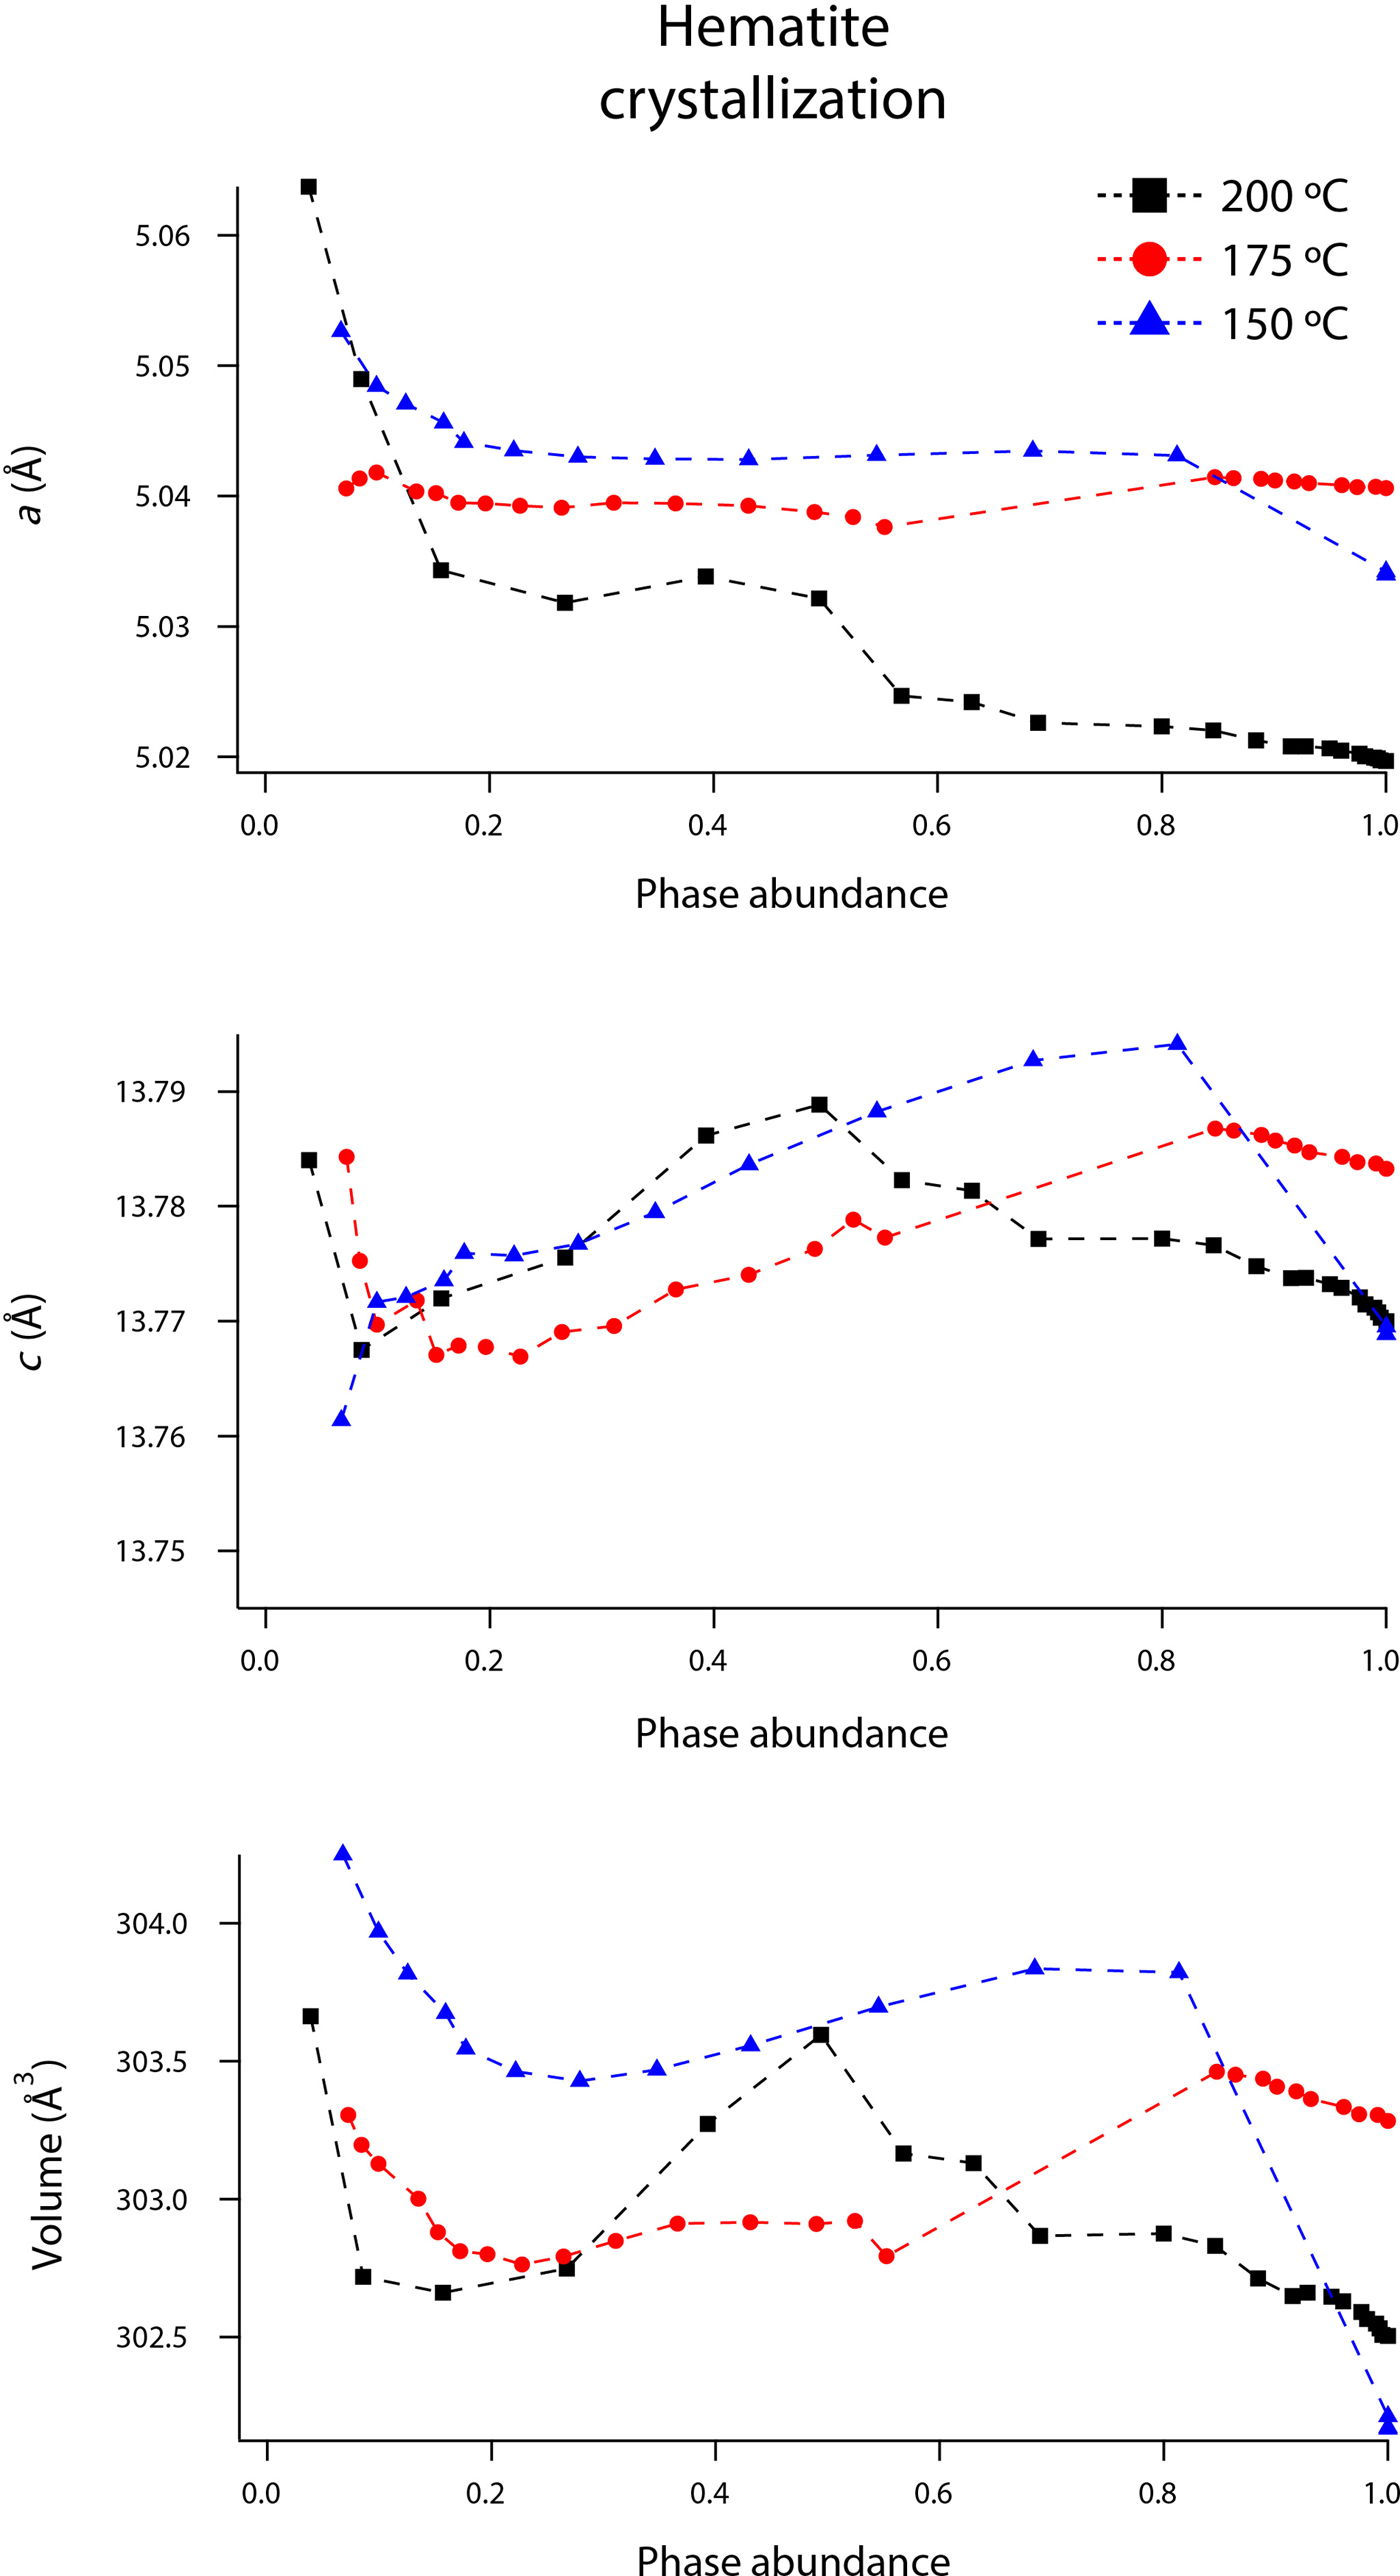
Figure 9. (Color online) Changes in hematite a, c, and volume at 150 (blue triangles), 175 (red circles), and 200 °C (black squares) as a function of hematite phase abundance.
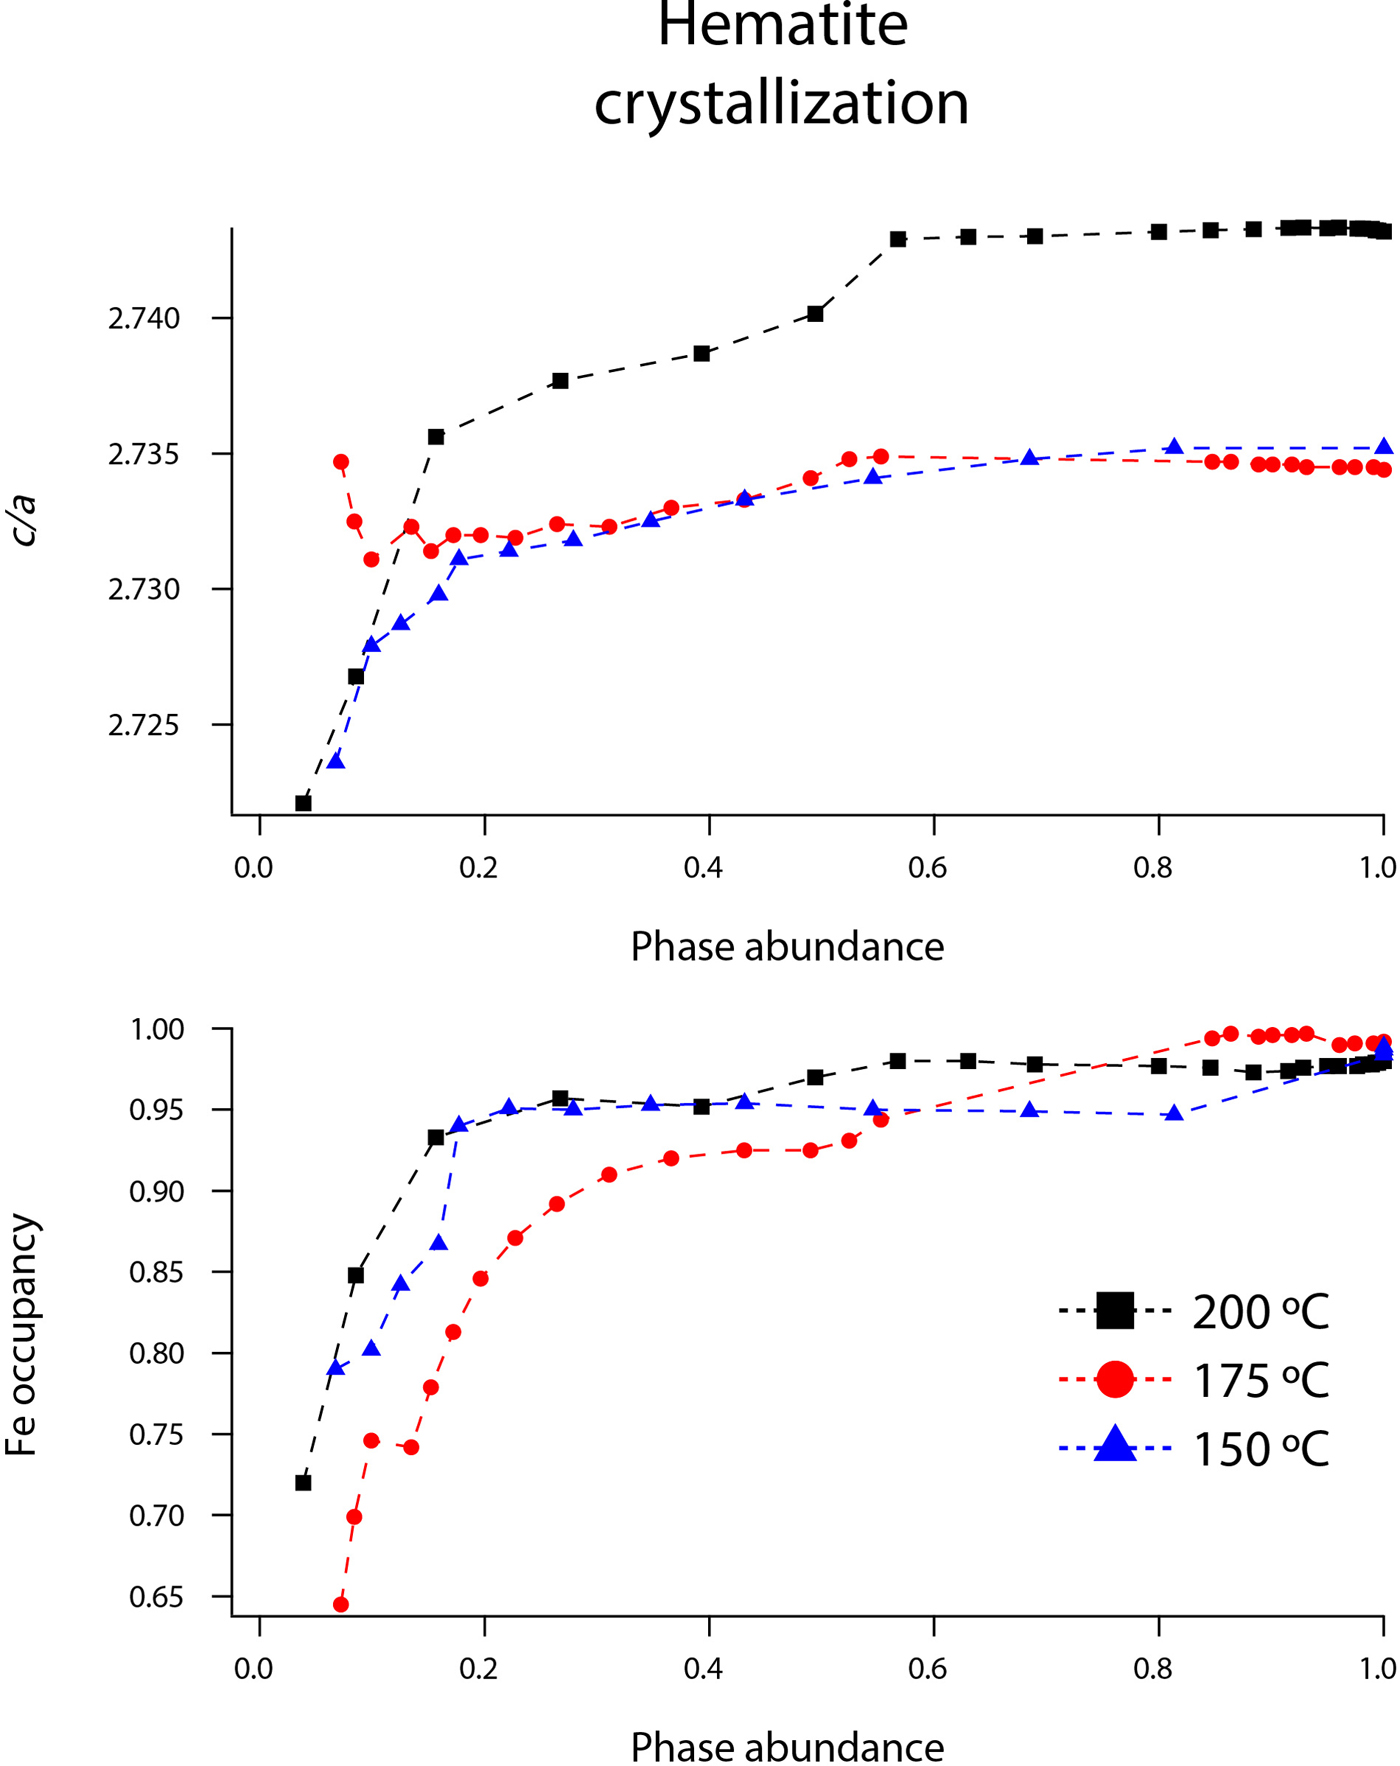
Figure 10. (Color online) Changes in hematite c/a and Fe occupancy at 150 (blue triangles), 175 (red circles), and 200 °C (black squares) as a function of hematite phase abundance.
1. Structural changes during crystallization and dissolution of akaganeite
Akaganeite nanocrystals exhibited measurable structural changes following nucleation, and again after the onset of dissolution. At all temperatures (100–200 °C), the first akaganeite crystallite diameters were ~30 nm. The akaganeite a- and c-axes contracted and the b-axis increased during crystal growth, and this behavior continued even into the early stages of akaganeite dissolution (with <10 wt% of the akaganeite dissolved) (Figures 7 and 8). The contractions of a and c were counterbalanced by the expansion of b, and the unit-cell volume was constant within an error at 100 °C and decreased only by up to ~0.3% for the higher temperature runs. The Cl occupancy for the first particles for which refinement was feasible was ~0.2, and that value slightly increased and stabilized at ~0.3 for all temperatures.
Interestingly, dissolution was marked by a more significant structural evolution: the unit-cell volume increased as all of the unit-cell edge lengths slightly expanded. One explanation for this volume increase may be tied to an unexpected change in the fractional occupancy of the Cl site within the tunnels. As the akaganeite dissolved, the refined occupancy of Cl in the tunnels increased dramatically from ~0.3 to an average final refined occupancy of 0.75 ± 0.02, and manually lowering the Cl occupancy worsened the fit. For example, for a refined Cl occupancy of 0.71, RF2 = 0.0137, whereas a forced Cl occupancy of 0.3 for the late-stage dissolution of akaganeite yielded a higher RF2 of 0.0272. The refined Cl occupancy of ~0.3 for akaganeite before the onset of dissolution is very close to the value of 0.34 reported for akaganeite in a meteoritic corrosion crust (Post and Buchwald, Reference Post and Buchwald1991). This Cl concentration agrees well with the value of 1.25 Cl per unit cell that Post and Buchwald (Reference Post and Buchwald1991) measured by electron probe microanalysis.
The Cl anions are located within the hollandite-like tunnels of akaganeite, displaced slightly from (0,0,0), and an occupancy of 0.34 indicates that roughly two-thirds of the tunnel sites are occupied. A subsequent study of the same sample using neutron diffraction (Post et al., Reference Post, Heaney, Von Dreele and Hanson2003a) yielded a slightly higher Cl occupancy (0.42, or ~1.6 Cl anions per unit cell), but the authors discounted this refined value based on the effects that different isotopes of Cl would exert on neutron scattering. Thus, our refined occupancy for Cl when akaganeite was at its most abundant in our experiments (~0.30) matches well with the most reliable published measurement for a natural specimen.
A refined value of 0.5 for the occupancy of Cl indicates that all of the tunnel sites are filled. Thus, as akaganeite dissolved (and the particles were smaller), Cl might have preferentially fractionated into the crystal rather than the fluid up to the theoretical limit of what akaganeite could accommodate. However, our refined Cl occupancies were consistently greater than the theoretical limit of 0.5 during akaganeite dissolution. Ishikawa and Inouye (Reference Ishikawa and Inouye1975) suggested that water might partially replace Cl within the akaganeite tunnel. Previous studies using IR spectroscopy and XRD only revealed trace quantities of water molecules existing within the tunnel sites (Keller, Reference Keller1970; Post and Buchwald, Reference Post and Buchwald1991; Post et al., Reference Post, Heaney, Von Dreele and Hanson2003a). In their neutron diffraction study, Post et al. (Reference Post, Heaney, Von Dreele and Hanson2003a) determined that the three H sites were partially occupied, with fractions ranging from 0.3 to 0.5. An increase in Cl during dissolution would have to be accompanied by a concomitant increase in the H content of the final akaganeite nanocrystals to maintain charge balance, since our refinements did not reveal a decrease in the occupancy of the Fe sites.
In light of the refined values for Cl occupancy beyond the theoretical limit, another explanation may involve Fe migration into tunnel sites during akaganeite dissolution. For example, Post et al. (Reference Post, Heaney and Hanson2003b) examined the thermal decomposition of the Mn oxide todorokite, which has a 3 × 3 octahedral tunnel structure, and they found strong evidence that Mn migrates into todorokite tunnel sites during its thermal decomposition to the closest-packed hausmannite structure. Perhaps as akaganeite transforms to the closest-packed hematite structure, Fe3+ cations similarly migrate to tunnel sites as an intermediate step in the framework reconstruction, presumably with the loss of H to maintain charge balance.
2. Fe–O bond behavior
Akaganeite has two distinct Fe1 and Fe2 octahedral sites, each having three shorter Fe–O bonds and three longer Fe–OH bonds. Based on Rietveld analysis of neutron diffraction data, Post et al. (Reference Post, Heaney, Von Dreele and Hanson2003a) calculated Fe–O bond lengths of 1.944–1.985 Å for the shorter bonds, and Fe–OH bond lengths of 2.054–2.130 Å for the longer bonds. Their average Fe–(O,OH) bond length is 2.01 Å for the Fe1 site and 2.05 Å for the Fe2 site.
Our refined akaganeite bond lengths were in good agreement with those of Post et al. (Reference Post, Heaney, Von Dreele and Hanson2003a). During crystallization, the average Fe1–OH and Fe1–O bond lengths increased by ~0.03 Å (from 2.08 to 2.11 Å and 1.98 to 2.01 Å, respectively) as the akaganeite abundance approached its maximum value. These values were consistent for all temperatures. Also during crystallization, the Fe2–OH distances decreased by ~0.02 Å, and Fe2–O bond lengths decreased by ~0.04 Å. During dissolution, average Fe1–OH and Fe1–O distances decreased by 0.03 and 0.04 Å, respectively. The Fe2–OH distances decreased by ~0.02 Å, and Fe2–O bond lengths increased by ~0.05 Å. Our Cl–Cl distances remained ~3.035 Å, regardless of the Cl occupancy and refined Cl anion positions. This value is lower than the expected distance of ~3.8 Å, but similar to the distance of 3.03 Å determined by Post and Buchwald (Reference Post and Buchwald1991).
3. Structural changes during the growth of hematite
Hematite is hexagonal with space group R-3c (Figure 1). The structure contains a framework of hexagonally closest packed O2− anions along (001), and Fe3+ cations occupy two-thirds of the octahedral interstices (Blake et al., Reference Blake, Hessevick, Zoltai and Finger1966; Cornell and Schwertmann, Reference Cornell and Schwertmann2003). When hematite forms in solution or via an iron oxyhydroxide intermediate, it can retain variable amounts of water and OH groups within its structure. The water and OH groups substitute for O2− anions, and are accompanied by Fe vacancies for charge balance. These hydrated hematite phases are often referred to as “protohematite” or “hydrohematite” (Wolska, Reference Wolska1981; Wolska and Schwertmann, Reference Wolska and Schwertmann1989; Dang et al., Reference Dang, Rancourt, Dutrizac, Lamarche and Provencher1998; Gualtieri and Venturelli, Reference Gualtieri and Venturelli1999; Burgina et al., Reference Burgina, Kustova, Isupova, Tsybulya, Kryukova and Sadykov2000a, Reference Burgina, Kustova, Tsybulya, Kryukova, Litvak, Isupova and Sadykovb).
Our refined unit-cell parameters for the growing particles of hematite are consistent with the initial formation of OH-rich, Fe-deficient hematite phases at all temperatures. During the experiments at 150, 175, and 200 °C, the hematite a-axes contracted throughout the experiments (Figures 9 and 10). The hematite c-axes expanded until the late stages of akaganeite dissolution (~60% of akaganeite dissolved), and then the c-axes contracted during the rest of the experiment. The coupled a- and c-axis contraction is frequently described in the protohematite and hydrohematite literature, and is explained as a consequence of OH loss and filling of Fe vacancies (Dang et al., Reference Dang, Rancourt, Dutrizac, Lamarche and Provencher1998; Cornell and Schwertmann, Reference Cornell and Schwertmann2003). The replacement of vacancies by Fe with increasing particle size and maturity is also reflected in the increase in refined Fe occupancies from an average of 0.72 to nearly full occupancy. If H+ is charge balancing the Fe3+ deficiencies, then the water content for the initial crystals of hematite in our experiments was ~12 wt%, which is similar to that of akaganeite and goethite (Cornell and Schwertmann, Reference Cornell and Schwertmann2003; Post et al., Reference Post, Heaney, Von Dreele and Hanson2003a).
The structure of hematite consists of trigonally distorted octahedra, which contain three longer Fe–O face-sharing bond lengths (2.116 Å) and three shorter unshared Fe–O bond lengths (1.945 Å) (Blake et al., Reference Blake, Hessevick, Zoltai and Finger1966). Fe–Fe distances (2.900 Å) between face-sharing octahedra along c are shorter than edge-sharing octahedral Fe–Fe distances (2.971 Å) within the octahedral layers. At all temperatures, Fe–O face-sharing bond lengths increased and unshared Fe–O bond lengths decreased throughout the experiments.
On the other hand, Fe–Fe distances between face-sharing octahedra increased during our experiments at 200 °C, but they decreased when crystals evolved at 150 and 175 °C. We believe this difference is real and not attributable to experimental artifacts, as it was reproduced in duplicate experiments. Most likely, this behavior is linked to the formation of a lower symmetry hematite phase during our 200 °C experiments, as indicated by distinct peak splitting in our diffraction data. In our recent study, we presented a refined structure for this phase, described as monoclinic hydrohematite (space group I2/m) (Peterson et al., Reference Peterson, Heaney, Post and Eng2015). Monoclinic hydrohematite was not evident in our 150 and 175 °C experiments, although the concentrations of Fe vacancies were similar at all temperatures. Peterson et al. (Reference Peterson, Heaney, Post and Eng2015) attribute the monoclinic phase to the accelerated reaction kinetics at 200 °C.
IV. CONCLUSION
We used TR-XRD to track the hydrothermal nucleation and growth of akaganeite and its transformation to hematite during in situ experiments between 100 and 200 °C. During the crystallization of akaganeite, our Rietveld analyses demonstrated that the unit-cell volume remained essentially constant, with a small (0.3%) contraction at the higher temperatures. Cl occupancy increased from 0.2 and stabilized at 0.3. However, the onset of akaganeite dissolution and hematite precipitation was accompanied by a reversal of these trends. The akaganeite unit cell expanded and Cl occupancy rapidly increased to ~0.72, greater than the theoretical limit of 0.5. We suggest that Cl sites might be partially filled by Fe3+ migration into the tunnel during the breakdown of the akaganeite structure as it transforms to hematite. Rietveld analyses supported the incipient formation of an OH-rich, Fe-deficient hydrohematite that over timescales of minutes evolved to stoichiometric hematite. We suggest that these transformations describe the crystallographic maturation of akaganeite and hematite in both synthetic and natural hydrothermal systems.
Table II. Representative unit-cell parameters and refinement results for akaganeite and hematite.
ACKNOWLEDGMENTS
This work was made possible by the National Science Foundation Grants EAR11-47728 and EAR1552211 and the Center for Environmental Kinetics Analysis (CEKA), an NSF- and DOE-sponsored Environmental Molecular Sciences Institute (CHE-0431328). GeoSoilEnviroCARS is supported by the National Science Foundation, Earth Sciences (EAR-1128799) and Department of Energy, Geosciences (DE-FG02-94ER14466). The Advanced Photon Source is supported by the US Department of Energy, Office of Science, Basic Energy Sciences, under Contract No. W-31-109-Eng-38. The authors thank Joanne Stubbs and Nancy Lazarz at GSECARS BM-13, as well as Tim Fisher and Claire Fleeger Parasida for their invaluable assistance in data collection at the beamline.