I. INTRODUCTION
Silica is one of the most important compounds on the earth, mostly in combination with bases in silicates but also as free silica. This free silica can be amorphous or crystalline. Quartz is the most prevalent form of crystalline silica; its concentration in the earth's crust is evaluated at approximately 12 and 17% of surface rock (Smith, Reference Smith1997). The other natural polymorphs of crystalline silica are cristobalite, tridymite, coesite, stishovite, and melanophlogite. All these forms are potentially toxic, but only quartz, cristobalite, and tripoli (a microcrystalline form of silica) are regulated by the Regulation respecting occupational health and safety (RROHS, Québec, 2011). Inhalation of crystalline silica dust constitutes a health hazard for workers exposed to it. Depending on the level and duration of exposure, the resultant progressive respiratory disorders can vary from shortness of breath, cough, and thoracic pain to silicosis. Silicosis is a progressive and irreversible pulmonary fibrosis; it may continue to evolve even if the worker is removed from duty and silica exposure ceases (Schwarz and King, Reference Schwarz and King2009). It is particularly important to focus on prevention because there is no cure as yet. Regulations on workplace atmospheres and marketed products require analytical methods for compliance. The detection and quantification of respirable crystalline silica are well established and different analytical techniques are standardized. These procedures are legally accepted and can be used for evaluating respirable crystalline silica in workplace environments.
In the Regulation respecting occupational health and safety (RROHS), a note accompanying the regulation of several other compounds states that it can be applied to dust containing no asbestos and not more than 1 wt% crystalline silica. It is therefore necessary to quantify crystalline silica in bulk materials, and, for the note to be applied, a quantification limit less than 1 wt% is needed. This regulation applies in the province of Québec, though many countries already have their own regulation about silica's concentration in bulk materials, and concerns every form of crystalline silica. This study concentrates on quartz, as by far it is the most prevalent form.
Although this issue has been known for several years and despite the fact that several studies on this subject have been conducted, there is still no standardized procedure for the quantification of crystalline silica in bulk samples. Many analytical methods have been proposed (Till and Spears, Reference Till and Spears1969; Bish and Post, Reference Bish and Post1993; Miles, Reference Miles1999), but they usually apply to a certain type of matrix in particular; in fact, the wide variety of matrixes encountered is one of the greatest difficulties in quantitative analysis. This is particularly true in the context of health and safety in workplace environments. Although requests come from diverse environments, the response given must be accurate and the procedure used must have legal status. Another factor in the development of analytical methods is the need for a simple and rapid procedure.
This study attempts to develop a simple routine procedure for the quantification of quartz in bulk materials, including a large variety of matrixes and with a quantification limit less than 1 wt%. The method has been developed in view of its possible application to routine analysis; cost, time, and expertise needed are therefore factors taken into consideration in evaluating the method.
An intensive literature review led to the conclusion that X-ray diffraction is probably the most suitable technique to achieve the objectives of this study. It allows differentiation of the various silica polymorphs, and quantification is not affected by the presence of other silicates. It is nondestructive, and sample preparation is simpler than in many other techniques. First, to avoid the problems associated with this technique, the use of Rietveld refinement applied to the diffraction pattern was included in the project, and the possibility of automation also seemed very promising. Another advantage was the possibility of adding an internal standard, which allows determination of the amorphous phase. It is then possible with only one analysis to give complete composition quantification. However, it is most important to determine whether this technique can be applied to every matrix possibly encountered and whether a single standard procedure can be developed.
II. EXPERIMENTAL
A. Samples
Many standard mixtures were prepared to simulate real samples, but it was impossible to cover all possible cases. Some of these samples were composed of NIST standard materials because this allows the chemical and crystallographic purity to be known, and therefore the quantitative results can be compared for every phase present. Information about the products used in the samples can be found in Table I; sample compositions are given in Table II.
Table I. Chemical and mineral products used.

Table II. Sample compositions.

Samples were prepared by weighing each phase to a tenth of a milligram on an analytical balance, mixing all the phases, and then grinding the sample according to the grinding procedure described below. The internal standard was then added and the sample was homogenized by mixing.
All the Somar products are natural; their chemical and crystallographic purity are not really well characterized and therefore they were used just to simulate a matrix effect on the quantification of quartz in samples E13 and E18. In every sample, the quartz used for quantification is NIST SRM 1878a; it is natural but heat-treated to optimize purity. The standard SRM 2686a is synthetic. The standards SRM 674b are also heat-treated, but it is not specified whether they are natural or synthetic. The amorphous silica used to simulate amorphous content is also synthetic.
Quartz and amorphous content concentrations were varied in samples to cover a large range of concentration; the number of phases in samples was also varied. The nature of the phase was chosen because they often accompanied quartz in a field sample, because they presented problematic phenomena that could affect quartz quantification, or to evaluate their possible use as internal standard.
1. Particle size
Earlier studies (Jenkins et al., Reference Jenkins, Fawcett, Smith, Visser, Morris and Frevel1986; Bish and Post, Reference Bish and Post1989) suggest that a particle size between 2 and 10 µm is optimal for quantitative phase analysis. To achieve this kind of size, the sample is first reduced to a powder by grinding for 7 min in an automatic mortar grinder. Generally, the size of the majority of particles obtained by this procedure is around 1 µm, but the distribution remains really large, and some particles are still bigger than 300 µm. Then, 3 g of the sample is milled again with a McCrone micronizing mill for 1 min in 20 ml of methanol. The sample recovered by successive washings with methanol is subsequently dried in a laboratory oven at 100 °C for ~1 h. This procedure allows particle sizes of ~0.69 µm to be produced, depending on the hardness of the phases encountered. The number of large particles is greatly reduced by this procedure, but the distribution remains large without sieving.
Three compounds were used to characterize the size of the particles obtained. Alumina, with a hardness of 9 on the Mohs scale, was used to evaluate the impact of milling on a very hard compound. Quartz, with a value of 7 on the Mohs scale, was of course used because it is the compound involved in this study. Finally, a mixture of concrete sand, comprising mainly containing quartz, anorthite, and microcline, was used to represent the multiphase field samples. The size of the particles was evaluated using a Beckman-Coulter LS 200 particle size analyzer, and the reliability of the results obtained was verified by scanning electron microscopy (SEM) with a JEOL JSM-7600F. Table III shows that mortar grinding provided comparable results regardless of whether it was used for 7 or 14 min; to preserve maximum crystallinity of the sample, the 7-min procedure was favored. Note that micronization of the sample does not reduce the size of the small particles but contributes greatly to reducing the size of the large particles, which reduces the size of the distribution. These procedures seem to be well adapted to Rietveld analysis, sometimes requiring great precision, sometimes slightly less. The results can be interpreted differently depending on the value observed. It is difficult to state with certainty that the size of particle sought is achieved with such large distributions. However, the results of the micronized samples suggest that a great majority of particles correspond to the expected size. Considering the time constraints applied to the method, an excellent compromise can be achieved, a good diffraction pattern quality can be obtained, many particles can be irradiated for a better statistical value, and a reasonable milling time can be acquired.
Table III. Particle size statistics for seven samples in different milling procedures.

The mean particle size obtained with this procedure was below the ideal range mentioned. Below 2 µm, an extinction phenomenon becomes more important, but to obtain a sample with particle sizes between 2 and 10 µm, sieving would be required; this would modify the composition fraction of the final sample and the result would not be representative of the sample.
2. Internal standard
The first choice for an internal standard is corundum, if it is already present in the sample to be analyzed or if the peak position causes overlapping with the sample peak, rutile will then serve as the internal standard. The internal standard needs to have a well-known amorphous content and the particle size should be similar to that of the sample. The mass attenuation coefficient should also be a factor in the choice of an internal standard; it should be as close as possible to that of the analyte (Asahi et al., Reference Asahi, Matsudaira, Kobayashi, Nakayama and Nakamura2010). In our study, as quartz is the compound of interest (μ = 34.84 cm2 g−1 for CuKα), corundum was the first choice because its mass absorption factor is really close to that of quartz. The addition of the standard phase is what allows quantification of the amorphous phases and is now a common practice in the analysis of many materials such as cement (Guirado et al., Reference Guirado, Galí and Chinchón2000; De La Torre et al., Reference De La Torre, Bruque and Aranda2001) or even NIST materials (Cline, Reference Cline1992; Winburn et al., Reference Winburn, Grier, McCarthy and Peterson2000). The use of an internal standard allows a quantitative result in total weight percentage from a single XRD analysis without the need for other analyses, and this is advantageous because time is a very important criterion. Zincite is another option if both corundum and rutile cannot be used as the internal standard.
These three products are commercially available at very high certified chemical and crystallographic purities. The masses of the sample and internal standard are weighed to a tenth of a milligram on an analytical balance. The mass of the crystalline internal standard is then calculated with the certified percent crystallinity. This value will be used for Rietveld refinement. The internal standard is added to the sample and it is homogenized in two steps: the sample and the internal standard are mixed together with a manual mortar and the resulting mixture is again mixed for about 15 min in a three-dimensional manual powder mixer. The resulting powder is then placed on the specimen holder for analysis. The quantity of internal standard is always ~10 wt%. This proportion is generally used with good results (Winburn et al., Reference Winburn, Grier, McCarthy and Peterson2000; Gonzalez et al., Reference Gonzalez, Lorbieke, McIntyre, Cathcart, Brownfield and Winburn2002) and does not create too large a dilution of the phases at low concentration.
3. Specimen holder
X-ray diffraction on powder allows the use of a large selection of specimen holders, each with its advantages and disadvantages. In the literature, the favored sample mounting method for Rietveld quantitative analysis is the spray-drying method (Jenkins and Snyder, Reference Jenkins and Snyder1996). This method is very useful when the relative intensities must be precise; however, it requires the acquisition or construction of a “spray dryer” as well as much more time for sample preparation, which is not favorable in the context of daily routine analyses. For these reasons, the back-loaded method was chosen in the context of these analyses. This method gives the most reproducibility for routine analyses: it is simple, rapid, and also reduces the preferential orientation. It also allows recovery of the unaltered sample, which is very useful when other analyses must be performed.
B. Data measurement
XRD data were collected on a PANalytical Cubix Pro diffractometer with a sample spinner and a position-sensitive detector using CuKα 1 radiation in Bragg–Brentano geometry (θ–θ). Data were collected between 5° and 80° 2θ in steps of 0.02° for 50 s per step at room temperature. The PANalytical X'celerator detector using real-time multiple strip technology allows sensitive analysis in very short collection times. Soller slits of 0.04 rad were used in the incident and diffracted beams. Between the tube and the sample, a divergence slit was set at ¼° and an antiscattering slit at ½°. A nickel filter was used on the diffracted beam to eliminate CuKβ radiation. Tube operating conditions were at 45 kV and 40 mA. The sample was spun at 1 s rev−1 in the plane of the surface during XRD analysis. An attempt was made to obtain a compromise between good resolution, good intensity, and a reasonable acquisition time.
C. Rietveld refinement and pattern treatment
The software used for data analysis and Rietveld refinement was HighScore Plus from PANalytical. In all cases, the background noise was determined manually. PDF-2 databases from the ICDD and ICSD for HighScore Plus software were used to identify the phases; only index quality (I) or star (S) patterns were used. Tests were performed to determine whether or not it was preferable to refine background noise. The results demonstrated that quantification was generally more accurate when background noise was not refined, even if the fit agreement indices were increased. The reduction in the number of refined parameters also allowed the refinement to be simplified and to have a more accurate idea of the quality of the model. Indexes R 1, wR 2R bragg, and Goof (goodness of fit) were used as indicators. Values below 10 were expected for R 1 and R bragg, below 15 for wR 2, and below 4 for Goof. R sigma was used to assess whether the quality of the data was sufficient. R bragg was used to detect more easily the more problematic phases that the model does not describe well. The value of Goof is greatly influenced by the number of refined parameters and, as a result, it is not considered very reliable. Generally, visual inspection combined with the values of the agreement indices obtained allows a good evaluation of the model. As the goal is to find an automatic refinement routine for quantifying quartz in any type of matrix until low concentrations are obtained in the absence or presence of amorphous material, several tests were carried out on a wide range of samples. For all the refinement tests, a Pseudo Voigt profile function and the Newton–Raphson nonlinear least-squares fit type were used.
III. RESULTS AND DISCUSSION
A. Acquisition and refinement
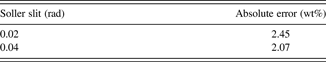
The first step in the development of our method was to ensure that diffraction patterns of sufficient quality are obtained to allow subsequent application of Rietveld refinement. As one of the objectives was to determine low concentrations of quartz, obtaining sufficient intensity was also a criterion. Thus, the optical path did not include a monochromator. For better resolution and greater accuracy, tests were performed with Soller slits of 0.02 and 0.04 rad to evaluate whether the loss in intensity from a reduction in the slits was very important and whether the gain in resolution was significant.
Since the refinement routine was not yet optimized, several routines were applied to the different patterns acquired. As Table IV shows, contrary to the starting hypothesis, better resolution did not increase the accuracy of fit, and the accuracy in the measurements was reduced. In addition, the loss of intensity was very significant. A sample (E14) containing less than 1 wt% quartz (Figure 1) showed that it was very difficult to detect quartz with a slit of 0.02 rad and that it was totally undetectable in a sample (E19) of 0.1 wt% quartz.

Figure 1. (Color online) Comparison of the diffraction patterns obtained in the analysis of a polycrystalline sample containing 0.83 wt% quartz with Soller slits of 0.02 and 0.04 rad.
Table IV. Average absolute error in the quantification of quartz in relation to the Soller slits used.a
a The absolute error presented and the average of the absolute errors calculated on 19 samples for the 0.04-rad Soller slit and 18 samples for the 0.02-rad Soller slit following eight different refinement routines.
A Soller slit of 0.04 rad was therefore used to optimize the method. The other optical path and diffractometer adjustments were determined in a more intuitive way or by following the supplier's instructions.
The irradiated surface was optimized for better counting statistics. When the amount of powder is sufficient, a 27-mm-diameter sample holder is used; when necessary, a smaller one, 16 mm in diameter, can be used. If the amount of powder is still insufficient, automatic quantitative Rietveld analysis will not be applied. Rietveld analysis is possible with a zero background plate and variable slits; however, the conversion of the diffraction pattern would greatly complicate the analysis, and this is not desirable because time is an important criterion.
As the primary aim of the study was to develop an automated refinement procedure, several different routines were tested on the 19 samples. In total, 18 different routines were tested, but only four have been presented here. Table V gives details of the refinement steps for the different routines presented.
Table V. Details of the four tested refinement routines.

The first parameter refined, the scale factor, represents the relative intensity of a phase (Snyder, Reference Snyder1992). By definition, the measured intensity of the strongest line of each phase should be used to calculate the scale factor, but in the software used (X'Pert HighScore), it is determined by a least-squares fit through all matching reference pattern lines. This should help counteract texture effects to some extent, but does not exactly follow the original definition.
Specimen displacement is another important parameter in the refinement process. It can be caused either by a misalignment of the goniometer or by an uneven sample surface. It results in a change in the measured value of d and a decrease in the diffraction intensity (Hurst et al., Reference Hurst, Schroeder and Styron1997).
The lattice parameters were also refined in the suggested procedure. As almost all the samples encountered contained only well-known phases, the variation in lattice parameters was not really large but still had a non-negligible impact on the quantitative results. A large amount of natural material was analyzed and the lattice parameters were different for the same phase from different samples.
An important parameter of the ray profile is the width at mid-height. In general, this parameter increases with the angle, and, most of the time, this evolution can be described by a tan θ second-degree polynomial (Caglioti polynomial) (Caglioti et al., Reference Caglioti, Paoletti and Ricci1958). In a Rietveld refinement, parameters U, V, and W are refinable. They vary in relation to the instrument's resolution and according to the microstructural characteristics of the analyzed sample (Guinebretière, Reference Guinebretière2006). The instrument's contribution to the value of these parameters can be determined if a very high quality pattern is used for the calibration. The sample's contribution can then be calculated by the refinement. Refining all these three values at the same time makes the refinement unstable. In the case of an automatic refinement, only one is refined, namely W. Its impact on fit is more important than that of the other two, so the integrated area is a better evaluation for quantification, even if the value determined cannot be logically interpreted without further refinement of U and V parameters.
These 18 different routines were tested by including and excluding background noise refinement. In all cases, the average absolute error was greater but all the quality indices were better. For this reason, the chosen procedure does not include background noise refinement, and thus the quantifications obtained are more accurate and the quality indices reflect the quality of the model by being less influenced by a large number of parameters.
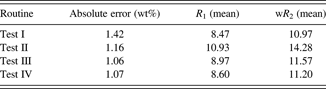
Table VI shows that test III and IV routines gave very similar results, and test IV allowed visual observation of a great similarity between the diffraction pattern and the model; thus, we used this refinement procedure for our method.
Table VI. Average absolute error in the quantification of quartz in relation to the applied refinement routinesa and agreement indices.

a The absolute error presented and the average of the absolute errors calculated on 19 samples with the 0.4-rad Soller slit.
No correction was applied for microabsorption or extinction because the size of the particles in the sample must be known precisely for these corrections to improve the model; otherwise, it could worsen the result (Madsen et al., Reference Madsen, Scarlett, Cranswick and Lwin2001). Thus, a general milling procedure described before was established to achieve a particle size that reduces to a minimum the effects of microabsorption and extinction. As several phases are generally present in the samples, it is normal to expect a larger distribution of particle sizes than for samples containing only one phase.
B. Limit of detection
To ensure the applicability of the method, the limit of detection (LOD) was studied. A literature review rapidly determined that there is no standard way to calculate the LOD in X-ray diffraction. It is generally taken for granted that an LOD of 0.1 wt% is achieved for bulk samples that are free of interference. However, it is impossible for our method to make this assumption because of the large variety of matrixes encountered and the major possibility of interference at one of the planes of quartz. Two methods were therefore used to attempt to evaluate the LOD.
The first method is the one proposed by Jenkins and Snyder (Reference Jenkins and Snyder1996). The equation below defines the net counting error (n), where N p is the integrated intensity of the peak and background and N b is the background intensity.
![\left[{\sigma \left(n \right) = \displaystyle{{100\left[{\left({N_p + N_b } \right)^{1/2} } \right]} \over {N_p - N_b }}} \right].\eqno\lpar 1\rpar](https://static.cambridge.org/binary/version/id/urn:cambridge.org:id:binary:20160309074032584-0598:S0885715612000036_eqn1.gif?pub-status=live)
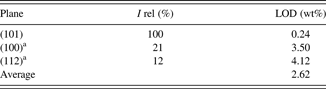
The lower detection limit 2σ (95% probability) was calculated with 19 samples using the data of the three most intense diffraction peaks: (101) d = 3.342 Å, (100) d = 4.257 Å, and (112) d = 1.8179 Å.
The results obtained, showed in Table VII, take into account only the quality of the acquired diffraction pattern and the intensity of the planes used; they do not consider pattern treatment and the application of Rietveld refinement using the complete diffraction pattern. They therefore indicate the sensitivity of the instrumentation used. However, these calculations made it possible to observe that the LOD was greatly increased in samples containing more than 80 wt% amorphous materials, which is reasonable, considering the significant increase in the background noise signal in this type of sample, causing a major reduction in the signal/noise ratio.
Table VII. Calculated limit of detection (LOD) for the three most intense diffraction peaks of quartz.

aOnly 18 samples were used for these calculations because the last one was not sufficiently concentrated for these planes to be detected.
To take into account the entire procedure applied to the sample to quantify it, another method for calculating the LOD was used. The method used by Német et al. (Reference Német, Sajó and Demeter2010) was reproduced with our samples.
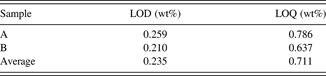
Two samples containing close to 1 wt% quartz were used. The general method consists of taking a sample containing a quantity of the compound that is assumed to be close to the LOD value, which is then quantified seven times by repeating each of the steps in the method every time. The standard deviation between the values obtained is then used to calculate the LOD by multiplying the standard deviation by 3.3 and by 10 to obtain the limit of quantification. This calculation uses the quantification values found by the application of the Rietveld method, thus including the intensities of the complete pattern. The calculation was done with a sample (E12) containing two crystalline phases and one amorphous phase, with 0.94 wt% quartz and 89.13 wt% amorphous phase, and another sample (E14) containing five crystalline phases and one amorphous phase, with 0.83 wt% quartz and 6.08 wt% amorphous phase.
The samples were removed between acquisitions, remixed, and then remounted in the specimen holders. The background noise was determined for each of the patterns to calculate the variations caused by the experimenter. This calculation technique seems to be more representative of the actual sensitivity of the developed method as it includes all the analytical steps, particularly the Rietveld refinement. The results obtained, as shown in Table VIII, make it possible to state that samples of concentrations of 1.0 wt% quartz or more can be detected and quantified with the proposed method and the instrumentation used.
Table VIII. Limit of detection (LOD) and limit of quantification (LOQ) calculated for the complete method on samples A and B.

IV. CONCLUSION
The development of this quantitative analysis method and the evaluation of its limits have led to several conclusions. The method respects the criteria needed for a routine analysis, namely being simple, rapid, and easy to execute. The quartz in simulated matrixes containing 0.1–82.0 wt% quartz could be determined with a good accuracy in matrixes of variable composition. The limits of detection and quantification calculated for the entire method are encouraging with regard to the possibility of obtaining a reliable result for samples of low concentration. However, certain limitations are proposed by this study, including mainly the impossibility of analyzing samples presenting an important phenomenon of microabsorption, consisting of one or more crystalline phases of unknown structures, or containing more than a dozen crystalline phases. For samples presenting any of these characteristics, a more thorough analysis becomes necessary, and systematic automation is impossible. Although the Rietveld method was simplified as much as possible for this procedure, it is still important that it be used by an experimenter who can detect inconsistent results for the phases present, interpret the quality indicators (R p, R wp, and Goof) correctly, and develop an appropriate initial model for each of the patterns encountered. As these limits are clearly identified, it becomes possible to perform an automated Rietveld analysis on majority of the samples encountered.
The method developed in this study can be useful in certain cases but the primary objective is not totally achieved because it does not apply to all types of samples. Problematic samples must be studied further to allow their analysis to be accurate as well as simple and rapid. When this problem will be overcome, more testing of natural field samples will need to be done to evaluate the impact of the microstructural default of quartz in quantification.
ACKNOWLEDGMENTS
The authors thank the Association Québecoise pour l'Hygiène, la Santé et la Sécurité du Travail (AQHSST); Claudette Dufresne, Catheline Pelletier, and Sébastien Gagné of Institut de recherche Robert-Sauvé en santé et en sécurité du travail (IRSST) for the technical support and good advice; PANalytical application specialists Dr. Jennifer Anderson, Dr. Thomas Dortmann, and Dr. Thomas Degen; Dr. Gilles L'espérance and all the members of the Centre for Characterization and Microscopy of Material, the CM2 de l'École Polytechnique de Montréal; Dr. Joel Reid of ICDD; Dr. Thomas N. Blanton of the Eastman Kodak Company; Dr. Susan Quick of Pennsylvania State University; and all the Rietvelders for their invaluable help and advice.