


I. INTRODUCTION
A recent study (Lee, Reference Lee2011; Censi and Martino, Reference Censi and Martino2015) estimated that more than half of the pharmaceutical compounds exhibit solid-state polymorphism. Polymorphism is defined as the ability of a chemical entity to crystallize into different structures where the atoms, ions, or molecules are packed differently within the crystal lattice (Kavuru et al., Reference Kavuru, Grebinoski, Patel, Wojtas and Chadwick2016). The polymorphic form of the active pharmaceutical ingredient (API) is closely connected with its bioavailability, bioactivity, compressibility, dissolution, shelf life, and stability (Kim and Kim, Reference Kim and Kim2009). Probable differences in the bioavailability of these polymorphic forms have provoked imposition of stringent regulatory requirements on identification and specification of polymorphs for a particular drug substance as part of the quality assurance process. The relevance of the pharmaceutical polymorph analysis is constantly growing (Tiwari et al., Reference Tiwari, Chawla and Bansal2007). Regulatory bodies such as FDA (Food and Drug Administration) and the International Conference on Harmonization (ICH) Q6A guidelines provide the guidance on when and how to select suitable drug polymorph or the alternatives for the product development, monitoring its stability, so as to ensure quality maintained (Raw et al., Reference Raw, Furness, Gill, Adams, Holcombe and Yu2004). Additionally, a precise knowledge of the stability of the crystal forms and their relationship is very critical for API development and formulation in order to avoid undesired surprises in the late stages of development (Tammaro et al., Reference Tammaro, Saturnino, D'Aniello, Vigliotta and Vittoria2015). In this connection, the importance of quantification of polymorphs in pharmaceutical compound is not in doubt. Thus, an accurate identification and quantification of the solid-state form is a requirement in the production of modern day pharmaceuticals.
Linezolid (Figure 1), chemically known as (S)-N-[[3-(3-fluoro-4-morpholinylphenyl)-2-oxo-5-oxazolidinyl] methyl] acetamide, is the first synthetic agent in the oxazolidinone class of antibacterial drugs, abbreviated as LZD. The drug acts as antibacterial agent for the treatment of infections caused by various Gram-positive bacteria, including methicillin-resistant Staphylococcus aureus and vancomycin-resistant enterococci (Birminghan et al., Reference Birminghan, Rayner, Meagher, Flavin, Batts and Schentang2003; Maccaroni et al., Reference Maccaroni, Alberti, Malpezzi, Masciocchi and Vladiskovic2008). Recently, it was discovered that solid LZD could exist in different polymorphic forms, such as crystalline forms I and II (Bergren, Reference Bergren2003), form III (Rao and Reddy, Reference Rao and Reddy2010), form IV (Aronhime et al., Reference Aronhime, Koltai, Braude, Fine and Niddam2008), and many others (Aronhime et al., Reference Aronhime, Koltai, Braude, Fine and Niddam2006). Form III is the mixture of the forms II and IV. Form II was obtained as needles and form IV is in the form of irregular plate crystals (Aronhime et al., Reference Aronhime, Koltai, Braude, Fine and Niddam2008). Crystal forms with platelet shape have better flowability than crystals with needle shape. Crystals with plate shape are more advantageous than those with needle shape for injection. A suspension of plate-shaped crystals may be injected through a smaller needle with greater ease than a suspension of needle-shaped crystals (Byrn et al., Reference Byrn, Pfeiffer and Stowell1999). Moreover, the most thermodynamically stable form is usually chosen for pharmaceutical use (U.S. Food and Drug Administration, 2000), of which the crystalline form IV is the thermodynamically stable form of LZD. Therefore, LZD form IV is chosen as the main crystal form for pharmaceutical use. The two discussed forms (forms II and IV) are enantiotropically related to each other. Transition from form II to IV occurs at high temperature approximately 120 °C and reversible transitions from form IV to II occur at high humidity, suspension, or grinding (Maccaroni et al., Reference Maccaroni, Alberti, Malpezzi, Masciocchi and Vladiskovic2008). During the manufacture and storage, if the drug substance (form IV) contains even small amount of form II there is a polymorphic conversion tendency toward form II. Obviously, the polymorphic conversion of LZD may take place during manufacturing processes of a drug tablet, including granulation, compression, coating, and drying, especially when a small amount of solvent, such as water and alcohol, is present. Hence, in order to control polymorphic form during manufacturing and storage processes of drug substance and products, analytical methods must identify and quantitate different crystal forms; and it is essential that these methods can measure very small amounts of polymorphic content accurately.
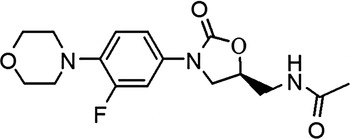
Figure 1. Molecular structure of LZD.
A number of analytical techniques have been explored for physical characterization of pharmaceutical solids such as powder X-ray diffraction (PXRD), thermal methods, FT-Raman, infrared (mid- and near-infrared spectrometry [IR]), and solid-state nuclera magnetic resonance (NMR) spectroscopy (Chieng et al., Reference Chieng, Rades and Aaltonen2011; Virtanen and Maunu, Reference Virtanen and Maunu2010). Each technique has advantages and drawbacks for quantitative analysis in terms of sample preparation, measurement time, and sensitivity. Small sample sizes, rapid analysis, and non-destructive sample preparation with the new-generation X-ray detectors and unique X-ray diffraction (XRD) patterns with improved detection limits make XRD the preferred technique for the analysis of polymorphic composition in mixtures (Yarasteh et al., Reference Yarasteh, Deng, Hwang, Kim and Wong2009). Quantitative analysis using PXRD data can be performed using different regression methods based on the analysis of single peak or whole profile fitting (Rietveld method) (Sheikhzadeh et al., Reference Sheikhzadeh, Rohani, Jutan and Manifar2007). All of these methods are based on the principle that the intensity of diffraction peak for a component in a mixture is related to the concentration of that component in the mixture. A number of different peak parameters can be used for single peak method analysis: peak height and peak area or their ratio. However, these decisive parameters are strongly influenced by potential source of errors such as homogeneity of the phase distribution in the powder, preferred orientation, instrumental, and operational errors because of inherent nature of the sample, instrument, and sample preparation parameters. Whole powder diffraction pattern analysis is also used for quantitative analysis. If crystal structures of all phases in the specimen are known, the Rietveld method can be directly applied for phase quantification (Ried and Hendry, Reference Ried and Hendry2006; Német et al., Reference Német, Sajó and Demete2010).
The aim of this work was to establish a reliable analytical method to evaluate LZD form II content in drug substance and tablet formulation. This method allows us to test the polymorphic purity. To the best of our knowledge, no efforts have been made in published literature to quantify mixtures of LZD form II in LZD form IV or products. At first, we focused our work on the study of quantification of form II in form IV of drug substance by using PXRD. Later, we have applied the corresponding methods to tablet formulation. Instrument and sample preparation method have been optimized in order to minimize errors. The PXRD quantification method has been developed for polymorphic forms of LZD, validated and checked for assay errors.
II. MATERIALS AND METHODS
A. Materials
Pure LZD forms II and IV were obtained from Zhejiang Huadong Pharmaceutical Co., LTD. Both forms were of high chemical purity [>99.5% determined by HPLC (high-performance liquid chromatography)], and were verified by differential scanning calorimetry (DSC) and PXRD. LZD form II crystallizes in an orthorhombic cell with a = 6.536 Å, b = 9.949 Å, c = 24.807 Å, and space group P212121. LZD form IV belongs to the triclinic crystal system with space group of P1 and its unit-cell parameters are a = 6.5885 Å, b = 10.977 Å, c = 12.919 Å, α = 69.313°, β = 88.17°, and γ = 74.23°. The space group is P1 (Tanaka and Hirayama, Reference Tanaka and Hirayama2008). Excipients besides the active drug substance commonly used in the tablet formulation were also provided by Zhejiang Huadong Pharmaceutical Co., LTD. The excipients were sodium lauryl sulfate, povidone, anhydrous citric acid, sodium hydrogen carbonate, lactose, silica, and magnesium stearate.
B. Characterization of LZD polymorphs
1. DSC
The DSC analysis was carried out on a TA DSC Q100 differential scanning calorimeter at the heating rate of 10 °C min−1 under a nitrogen flow 50 cm3 min−1. A temperature range of 35–250 °C was scanned. The DSC temperature axis was calibrated in an aluminum pan with indium standard sample (melting point 156.6 °C, heat of fusion 28.45 J g−1). The calibrated temperature accuracy was ±0.02 °C, and the calorimetric accuracy for the heat of fusion was ±0.11%. Data were processed using the TA Universal Analysis software.
2. PXRD
The PXRD analyses were measured on Rigaku D/Max-2550PC diffractometer using a rotating-anode Cu-target X-ray generator operated at 40 kV and 250 mA. The incidence CuK α X-ray beam was monochromatized by a vertical graded multilayer mirror to remove the Kβ radiation and to obtain a parallel beam with a width of 0.8 mm. The scans were run from 3.0 to 40.0° 2θ, with a step size of 0.02° and counting time of 4 s for each step. Data were processed using the MDI-Jade version 7.0 software. Rietveld Refinement was carried out using Jade from the published single-crystal data.
C. Preparation of standard mixture samples
The pure LZD forms II and IV were padded through a 300 mesh sieve for uniformity of the particles. The mixing procedure emphasized in the lower concentrations of form II, although it covers the entire concentration range. Samples were prepared by mixing them in a mortar and sieving to get homogeneous mixtures. Tablet samples, claimed to contain 2/3 of the active component, were ground in a mortar with a pestle and sieved to obtain a homogeneous powder. Standard API mixtures of LZD form II in LZD form IV at proportions of 0.49, 1.19, 3.11, 7.23, 11.02, and 15.06 wt.% were prepared and tablet mixtures were prepared by mixing 1/3 excipients and 2/3 corresponding standard API mixture, in which the content of LZD form II was 0.49, 2.01, 5.99, 9.03, 13.05, and 14.99 wt.%, respectively. The samples were mixed strongly for 4 h to make sure the calibration standards were mixing uniformity. All the samples were prepared in a controlled humidity (40 ± 5%) and temperature (25 ± 2°C) conditions to make sure the crystal forms II and IV kept unchanged for a long period of time. All the PXRD experiment samples were tested in triplicate. The average value was used to construct the calibration curve. The limit of detection (LOD) and limit of quantitation (LOQ) were determined with the help of this calibration curve. Validation mixtures were prepared in the same way.
III. RESULTS AND DISCUSSION
A prerequisite for polymorphic composition analysis is to have distinguishable diffraction profiles for each polymorph. The LZD forms II and IV were determined by multiple analytical devices, including thermal analysis techniques and XRD method.
A. DSC
LZD form IV [Figure 2(b)] shows a single melting endothermic peak (peak maximum at 178 °C) without any phase transition. In LZD form II [Figure 2(a)], a two-stage process (phase transformation and melt) can be observed. As shown in Figure 2, an endothermic process is observed around 154.4 °C (peak maximum) and accordingly, LZD form II transforms into form IV. Subsequently, a further endothermic event is observed around 178.9 °C (peak maximum), which can be attributed to melting of form IV, without decomposition. Apparently, form II can be transformed to form IV by heating.
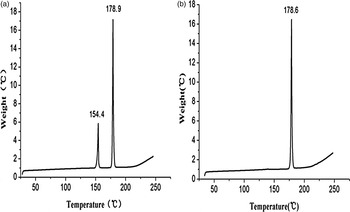
Figure 2. DSC curve of LZD forms II (a) and IV (b).
B. PXRD
The PXRD patterns of the two polymorphs of LZD are shown in Figure 3. The characteristic diffraction peaks matched well to those reported for forms II and IV (Bergren, Reference Bergren2003; Aronhime et al., Reference Aronhime, Koltai, Braude, Fine and Niddam2008; Maccaroni et al., Reference Maccaroni, Alberti, Malpezzi, Masciocchi and Vladiskovic2008; Tanaka and Hirayama, Reference Tanaka and Hirayama2008). Meanwhile, these patterns showed good match with the calculated patterns from the X-ray crystal structure, confirming that the polymorphic purity of the samples used to prepare the mixtures.
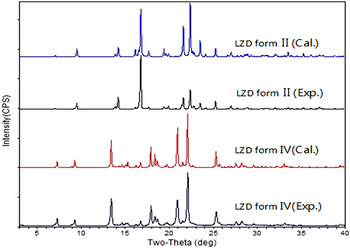
Figure 3. (Color online) Overlay of theoretical and experimental PXRD patterns of LZD forms II and IV.
C. Determination of peak analysis parameters
Single peak and full-profile fitting (Rietveld Refinement) were evaluated for determination of LZD form II content both for drug substance or tablet product. Mixtures of two polymorphs were readily quantifiable using the characteristic peaks as shown in Figure 3. There are two useful quantitation parameters of single peak method from collected XRD profiles. First, a linear relationship was demonstrated for the peak height of polymorph II vs. the weight percentage. We can investigate the linear performance from different sets of parameters such as the absolute peak height of LZD form II (H II) and the peak height ratio of LZD form II and IV [H II/(H IV + H II)].
The second parameter employed to quantify content levels was peak area. This parameter was more useful than peak height when considering multicomponent systems such as granulated mixtures or tablet formulations. The peak area parameter calculated similar as peak height by using different parameters for the peak area (the peak area and the peak area ratio) of form II vs. the weight percentage. The two quantitation parameters were also applied to quantify LZD form II in tablet formulation using the characteristic peaks of form II as shown in Figure 4.
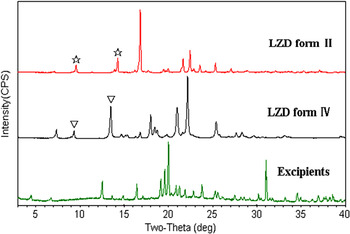
Figure 4. (Color online) Overlay of PXRD patterns of LZD forms II and IV and excipients. “![]() ” shows the characteristic peaks for form II and “▽” shows characteristic peaks for form IV.
” shows the characteristic peaks for form II and “▽” shows characteristic peaks for form IV.
D. Construction of the calibration curve of LZD form II in drug substance
1. Single peaks method
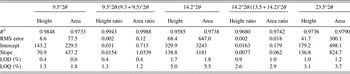
To construct a calibration curve for phase quantification, standard mixture samples containing 0.49, 1.19, 3.11, 7.23, 11.02, and 15.06 wt.% of LZD form II were prepared. In earlier reported studies on quantification of polymorphic forms of drugs, using PXRD, the strongest diffraction peak (I/I 0 = 100%) has been used for estimation of polymorphic content in mixtures (Roberts et al., Reference Roberts, Williams, Grimsey and Booth2002; Qiu et al., Reference Qiu, Li, Sheng and Zhu2015). However, in case of LZD form II, the strongest diffraction peak appeared at 16.8°2θ, while form IV has a diffraction peak (16.8°2θ) at the same position. It is seen that only a few strong peaks do not overlap and, hence, can be used for the quantification. These peaks (with 2θ value 9.5°, 14.2° for LZD form II and with 2θ value 9.3°, 13.5° for form IV) were chosen for analysis, and the change in intensity of these peaks as a function of form II content is shown in Figure 5. As a result, calibration curves of the mixtures of two LZD polymorphs were obtained, and the analysis results are presented in Table I. In the 9.5°2θ:(9.3 + 9.5)°2θ peak area ratio method, a slightly higher linearity was obtained with a correlation coefficient of 0.9988, y-intercept 0.713, and slope 1.0339. It is indicated that calibration curves developed using the peak area parameters were more robust than those using peak height parameters in this study.
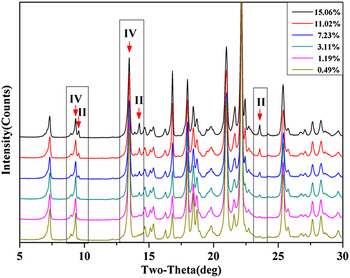
Figure 5. (Color online) XRD patterns of the six standard mixture samples.
Table I. Comparison of different characteristic peaks of LZD form II in APIs using different quantitation parameters analysis
2. Full-profile fitting method (Rietveld Refinement method)
Rietveld Refinement was done using Jade 7.0. The structural parameters including atomic coordinates and temperature factor were kept fixed. In the first step, overall intensity scale factor, lattice constant, background were refined. Then, the refinement was done on profile shape, as well as preferred orientation parameters. Profile shape fitting adopted pseudo-Voigt function. Background fitting function use the third-order polynomial. For the correction of preferred orientation, the refinement of (004) and (014) direction were made. As the polymorphs exhibit identical mass absorption coefficients and small particle size of used samples, no Brindley correction was necessary. The resulting weight fraction values were used as phase concentrations.
For the purpose of quantification the PXRD patterns were measured in the range of 3–40°2θ with long count time (4 s each step) to achieve good signal-to-noise ratio. The obtained R wp was 10.5–12.1 and 9.5–10.5 for the 1–15% (w/w) weight mixture, for forms II and IV, respectively. Higher R-value was obtained for the minor components of mixtures, e.g. 12.1 and 11.8 for 3 and 1% LZD form II, respectively. However, it does not seem to influence the quantitative result of refinement.
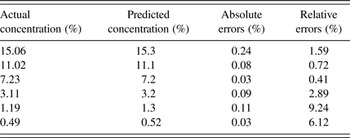
For the method of Rietveld Refinement, we calculated the concentration of LZD form II in LZD form IV of drug substance (Table II), it is correlated to the actual concentration of form II. A correlation curve was obtained with a correlation coefficient of 0.9998, y-intercept-0.0097, and slope 0.9896 (Figure 6).
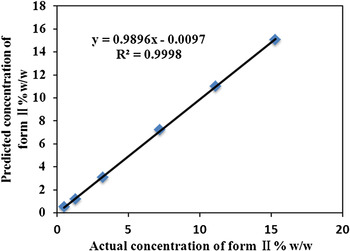
Figure 6. (Color online) Correlation curve of observed vs. theoretical percentage of LZD form II in binary mixtures.
Table II. The predicted concentration of form II from the method of Rietveld Refinement compare with the actual concentration
E. Construction of the calibration curve of LZD form II in tablet formulation
The samples for construction of the calibration curve of LZD form II in tablet formulation were containing 0.49, 2.01, 5.99, 9.03, 13.05, and 14.99 wt.% LZD form II. The characteristic PXRD profiles of two polymorphs are compared with excipients (Figure 4). The characteristic peaks (with 2θ value 9.5°2θ, 14.2°2θ for LZD form II and 9.3°2θ, 13.5°2θ for LZD form IV) parameters were used for quantification. Figure 7 shows the change in intensity of these peaks as a function of LZD form II content. Because of the interference of excipients, the lower concentration peaks of 14.2°2θ are hard to calculate. Hence, we have used the concentration above 2% of LZD form II.
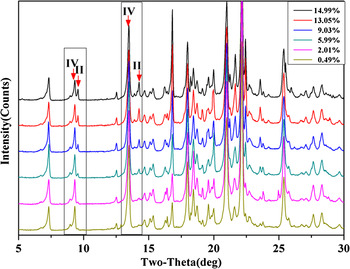
Figure 7. (Color online) XRD patterns of the six tablet formulation mixture samples.
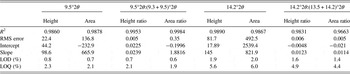
The fit resulting from application of different parameters on the same data set of tablet formulation mixtures was demonstrated in Table III. The method that used the ratio of the 9.5°2θ to the sum of peak parameters of 9.3°and 9.5°2θ had the best performance. The R 2 is reached at 0.9984, y-intercept −0.1996, and slope 1.8816.
Table III. Comparison of different characteristic peaks of LZD form II in tablet formulation using different quantitation parameters analysis
F. Validation of the analytical method
Any analytical method before being successfully utilized for quantification needs to be validated (Hestnes and Sørensen, Reference Hestnes and Sørensen2012; Soares and Carneiro, Reference Soares and Carneiro2014). The analytical method developed for quantification of LZD form II in LZD form IV of API and tablets by using single diffraction peak or full-profile fitting (Rietveld method) were checked for validation parameters such as detection and quantitation limits (LOD and LOQ), linearity, accuracy, precision, specificity, according to the International Conference on Harmonization (ICH) guidelines (ICH, 1999, 2003, 2005).
1. Evaluation of LOD and LOQ
LOD and LOQ of the quantitative method were calculated using Eqs. (1) and (2), respectively, as recommended in the ICH guidelines, where S is the slope of the calibration curve. These values were determined from data obtained in the linear range of the calibration curve.
 $${\rm LOD} = 3.3\sigma /S,$$
 $${\rm LOQ} = 10\sigma /S.$$
The results are provided in Tables I and III. The method developed for drug substance was found to be linear in the range 0–15 wt.% with LOQ of 1 and 6%, but having the LOQ of 0.4% when using the ratio of area parameter. The tablet formulation sample (Table III) showed the limit of quantification between 2 and 6%. The best calibration curve developed from a peak area ratio [9.5°2θ:(9.3 + 9.5) °2θ] of the signature polymorph II peak (9.5°2θ) to the sum of LZD form II and LZD form IV [(9.3 + 9.5)°2θ] had a quantitation limit below 2%. The peak area parameter had better correlation and a lower quantitation limit compared with the peak height parameter when considering all of the three calibration curves.
2. Linearity
Calibration curve (LZD form II in drug substance) showed a linear relation between amount of form II and diffraction peak area ratio % [9.5°2θ:(9.3 + 9.5)°2θ] and correlation coefficient was found as 0.9988. We obtained another calibration curve of LZD form II in drug substance using the method of Rietveld Refinement. The excellent correlation (R 2 = 0.9998) and lower LOD (0.2%) showed this method is better to quantify the content of LZD form II in APIs. The LZD form II in tablet formulation has a linearity calibration coefficient 0.9984, showing this method also possess a high correlation. We did not obtain another calibration curve of LZD form II in tablets using the Rietveld method, since not all of the crystal structures of the excipients are known.
3. Accuracy and precision
Accuracy of the calibration curve was determined by independently examining three different concentration samples (5.03, 8.97, and 13.01%) of LZD form II in API and three different concentration samples (3.21, 7.02, and 11.07%) of LZD form II in tablet formulation. All the accuracy assessments were tested in triplicate. The percentage of the average recoveries was calculated. Precision depicts the repeatability of the X-ray measurement. The method was ascertained by analyzing three known concentration (1.19, 3.11, and 7.23 %) samples of LZD form II in API and concentration (2.01, 5.99, and 9.03%) samples of LZD form II in tablet formulation. The % relative standard deviation (RSD) was calculated for each sample for its content in terms of % area ratio.
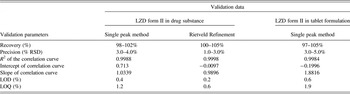
The method developed was found to be linear in the range 0–15%. LOD and LOQ calculated were 0.4%, 1.2% (single peak method), 0.2%, 0.6% (Rietveld method) in drug substance and 0.6%, 1.9% in tablet formulation, respectively. The method was found to be precise with % RSD between 3 and 5% and accurate with recovery in the range of 98–105%. All the validation data were summarized in Table IV. This indicated the adequate sensitivity of the method. Although the validation results show excellent correlation between input and calculated concentration, assay errors can be introduced by a combination of sample positioning, sample packing, inter-day, and intra-day variability.
Table IV. Summary of validation data
G. Estimation of assay error
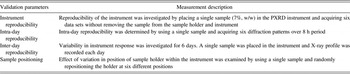
In order to determine errors coupled with PXRD assay, a single mixture [5.03% (w/w) of LZD form II in APIs] was prepared to explore the parameters such as instrument, intra-day, inter-day and sample packing described in Table V and % RSD was calculated (Ibánez et al., Reference Ibánez, Font, Moreno, Elvira, Alvarez and Querol2013). Data of assay error evaluation are shown in Table VI. The instrument reproducibility of about 1.2% was observed when the same sample was consecutively measured without disturbance. The inter-day variation observed was 5.6% in comparison with 3.4% intra-day variation. However, it should be borne in mind that the day-to-day error for which the sample was removed daily from the instrument is a composite including variability resulting from sample repositioning and possibly from sample disturbance on reanalysis. The measurements were performed in a single day to minimize this sort of shift or drift of instrumentation. A total of six sets of patterns obtained during normal generator operation were collected over several days. Variation owing to crystal orientation was investigated by repacking a single sample six times and recording the diffraction pattern after each preparation. Repacking the same sample led to variation of 4.8%. These over-all RSD is actually a combination of errors introduced into the assay by all factors such as instrument reproducibility, inter- and intra-day variation, sample positioning, and sample packing.
Table V. Assay errors associated with quantitative analysis using PXRD

This method is used to control LZD form II content in manufactured LZD tablets and to monitor the polymorphic impurity of form IV in drug substance. From the potential errors investigated in this study, control of parameters such as sample packing appears critical to the accuracy of the data obtained. The small RSD values indicating good reproducibility of the technique.
IV. CONCLUSIONS
PXRD can potentially be a viable method to monitor crystalline form content of the API in tablet formulations. In this study, an accurate, precise, and robust method (single peak and full-profile fitting) was developed and validated for the quantitative determination for the LZD form II in drug substance and tablet formulation. Pure polymorphic forms were characterized before developing a quantification method. Careful and consistent sample preparation was needed to develop a robust calibration curve for quantitation. Although the existence of the assay error, which is introduced by factors such as instrument, inter- and intra-day variation and sample packing, the calibration of the PXRD within the range of 0–15 wt.% provides are liable determination of LZD mixtures. The method was able to quantify the LZD form II content down to 1% in drug substance and 2% in tablet formulation.
This method herein can be used to control LZD polymorphism during manufacturing processes either in drug substance or products. It is proved that X-ray diffraction can be used as a convenient and effective test to monitor minor quantities of LZD form II.
Acknowledgements
The current project was supported by the Analysis and Measurement Foundation of Zhejiang Province, China (grant number 2014C37055).


