I. INTRODUCTION
Most thermomechanical processes and heat treatments of steels require a strict control of the temperature. For instance, intercritical annealing for production of dual phase steels requires heat treatments at high temperatures within the austenite+ferrite (γ+α) phase field. In this case, the annealing temperature controls the volume fractions of ferrite and austenite (Speich and Miller, Reference Speich, Miller, Kot and Morris1979; Rashid and Davenport, Reference Rashid, Davenport and Davenport1979; Ahmad et al., Reference Ahmad, Manzoor, Liaqat and Akhter2000; Ahmad and Priestner, Reference Ahmad and Priestner1998; Sarwar and Priestner, Reference Sarwar and Priestner1996).
The severe ductility losses at high temperatures during hot rolling in steels (Mintz et al., Reference Mintz, Yue and Jonas1991) are often associated to formation of strain-induced ferrite films (∼5–20 μm thick) at temperatures close to Ar3 (temperature at which the austenite transforms to α ferrite under cooling conditions) and Ae3 [highest temperature at which α ferrite and austenite can coexist in equilibrium (Ali and Bhadeshia, Reference Ali and Bhadeshia1990)] transformation temperatures (Cowley et al., Reference Cowley, Abushosha and Mintz1998; Mintz et al., Reference Mintz, Abushosha and Shaker1993). In addition, Yada et al. (Reference Yada, Li and Yamagata2000) reported that ferrite was formed during the deformation even above Ae3 with paraequilibrium. Thus, the equilibrium transformation temperatures in steels have a great importance to design thermal and thermomechanical treatments aimed at developing desirable properties. Most modern steels and alloys have complex chemical compositions which make difficult to estimate the equilibrium temperatures based on binary and ternary phase diagrams. Ac3 (temperature at which the α ferrite transforms to austenite under heating conditions) and Ar3 transformation temperatures can be calculated from empirical equations (Tamura et al., Reference Tamura, Sekine, Tanaka and Ouchi1988); nevertheless, these equations do not contain any term for Si or Al, which can increase the Ar3 and Ae3 temperatures. On the other hand, pseudobinary phase diagrams simulated with Thermo-Calc software require a large database to elaborate phase diagrams for multicomponent alloy systems. In some cases, these data are not available.
Most common experiment in the traditional XRD method for steels is the quench method (“postmortem” or static analysis). A vast amount of materials science data referred to as “phase equilibria data” is data collected on a sample that achieved a static or equilibrium condition prior to analysis. Other in situ high-temperature X-ray diffraction (HTXRD) analysis is made on isothermal conditions (Ayturk et al., Reference Ayturk, Payzant, Speakman and Ma2008).
For dynamic measurements (in situ or real-time analysis), much faster data collection rates are needed. Additional options have been developed to improve data collection speeds to approach those required for dynamic analysis. Recent several applications of X-ray diffraction technique have been the analysis at low temperatures (25 to 100 °C) (Tsotsis et al., Reference Tsotsis, Yang, Kim, Liu and Sahimi2002; Mahesh et al., Reference Mahesh, Uchil and Braz Fernandes2007) or with different materials to Fe alloys (Ramaswamy et al., Reference Ramaswamy, Jagtap, Bhagwat and Awati2005; Teresiak et al., Reference Teresiak, Gebert, Savyak, Uhlemann, Mickel and Mattern2005; Bhange and Ramaswamy, Reference Bhange and Ramaswamy2007; Ikeda et al., Reference Ikeda, Okazaki, Tanak, Suzuki and Toshishige2009).
The proposed in situ HTXRD method has been performed to obtain high intensity peaks in the X-ray diffraction patterns using a scintillation counter, an environment atmosphere of helium-built-in-purifier (BIP) gas (within a compressed gas cylinder), and relatively short periods of analysis. The high intensity peaks has allowed determining volume fractions of austenite and ferrite with sensitive results.
On the other hand, dilatometric analysis is the common technique used to determine transformation temperatures in steels. Nevertheless, this technique requires several calculations to determine the fractions of austenite and ferrite (Prado et al., Reference Prado, Catalan and Marsal1990; Cota et al., Reference Cota, Oliveira and Andrade2007; Sommer et al., Reference Sommer, Liu, Wang and Mittemeijer2008). The results of the proposed method have demonstrated that HTXRD is a suitable technique to determine fractions of austenite and ferrite in an easy manner. In addition, the interplanar d spacings from 2θ maximum positions of the peaks and the activation energy of phase transformation that can also be determined using the values of temperature time at 50% of transformation with good approach to literature values (Morra et al., Reference Morra, Böttger and Mittemeijer2001) were determined.
The HTXRD technique has not been commonly used to determine equilibrium temperatures in Fe alloys or steels. Hence, the proposed HTXRD technique is an in situ experiment performed to determine Ae1 [eutectoid temperature or the highest temperature at which α ferrite, cementite, and pearlite phases in a steel can coexist in equilibrium (Yunxu, Reference Yunxu1981)] and Ae3 transformation temperatures in steels alloyed with Si and Al, which elements increase notably the Ae1 and Ae3 equilibrium temperatures. In addition, the proposed method used in this work is more sensitive to determine smaller volume fractions of ferrite and austenite compared with the tradition XRD method.
II. EXPERIMENTAL
A. Sample preparation
A 3.5-mm-thick sample was obtained from a production hot rolled steel sheet fabricated from a continuous cast thin slab produced by the continuous strip processing. The chemical composition (wt %) of the investigated steel was C=0.049, Mn=0.602, Si=0.658, Al=0.271, Mo=0.0136, Cr=0.0163, P=0.0138, S=0.0005, Ni=0.0456, Cu=0.136, Sb=0.032, and Co=0.00314. The initial microstructure consisted of ferrite and 5% pearlite. Because of the hot rolling and austenite→ferrite→austenite transformations that take place on cooling after hot rolling and reheating to 1050 °C, it was expected that the orientation distribution of the austenite and ferrite was essentially random during the HTXRD measurements.
The dimensions of the specimen for the HTXRD analysis are very important for accurate temperature measurements. In addition, the sample must be representative of the bulk and free of contaminants. Sample preparation involved the following steps:
1. A 9-mm-wide and 15-mm-long sample was cut from the 3.5-mm-thick hot rolled strip using a SiC cutting wheel. This sample was then mechanically milled to a thickness of 0.8 mm by removing a 1.35 mm layer of material from each side of the strip.
2. The 0.8 mm sample was grounded to a thickness of 0.3 mm using SiC abrasive paper on a rotating wheel. As in the case of milling, grinding was carried out on both sides of the sample.
3. Final cleaning of the sample to remove a variety of contaminants (dirt, oil, grease, and buffing/polishing compounds) was performed in an ultrasonically stirred ethanol bath.
The dimension of the specimen used for the in situ experiments was 0.3 mm thick, 9mm wide, and 15 mm long. A specimen with a larger dimension can cause an increment

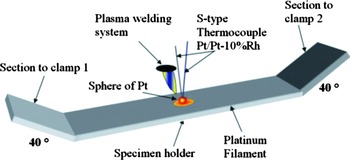
Figure 1. (Color online) Schematic description of the method of instrumentation of the platinum filament with an S -type thermocouple.
in thermal resistivity that affects the temperature in the specimen during a HTXRD measurement.
B. In situ HTXRD experiments
The in situ experiments were carried out in an Antón-Paar high-temperature chamber model HTTK adapted to a multipurpose Philips X-ray diffractometer model X’PRT-MPD with a Cu-target X-ray generator operated at 40 kV and 55 mA. The X-ray diffraction measurements were carried out using θ/2θ scan (Bragg Brentano geometry). This system uses a Pt filament (1 mm thick, 9 mm wide, and 132 mm long) both as heating element and specimen holder.
The original filament requires to be remanufactured due to possible reaction at high temperatures between the surfaces of specimen and filament which causes fracture in the filament.
The procedure to remanufacture the filament consisted of five steps:
1. Melt and cast: the melt of platinum was carried out in an induction furnace and the liquid Pt was cast in a conventional cast iron mold.
2. Cold roll: it was performed in a semiautomatic mill of two 12.7-cm-long rollers. The thickness reduction was 60%.
3. Deformation of sides of the filament at 40°: Figure 1 shows a schematic description of the filament shape. It can be seen the sides with angles at 40°. The mentioned deformations were required to hold the filament in the clamps which provides electric current.
4. Instrumentation of filament with an S-type thermocouple (platinum/platinum-10 wt % rhodium): it was carried out attaching, to the center of the filament, a small quantity of platinum in form of a sphere of 1 mm diameter. The sphere was melted by a welding plasma system. The thermocouple was placed inside the liquid sphere of Pt and the incorporation of filament and thermocouple occurred by the action of solidification (see Figure 1).
5. Calibration: a signal of temperature was introduced by a temperature calibrator; the value of temperature was compared with the value of temperature displayed by the control software of the high-temperature chamber. The calibration was corroborated by a K-type thermocouple on the surface of the steel specimen placed on the filament. The temperature on both thermocouples exhibited an excellent agreement.

Figure 2. Effect of gas atmosphere on the intensity peaks of X-ray diffraction patterns.
The specimen was placed on the Pt filament of the high-temperature chamber of the diffractometer. The chamber was then closed and flushed with a high flow of high purity (HP) helium gas to remove air. In order to avoid undue sample oxidation and absorption of the diffracted X-ray beam during heating and measurement of diffraction patterns at high temperatures, a moderate flow (1.5 1 min−1) of helium-BIP gas was established through the chamber. As shown in Figure 2, the use of this type of gas reduces significantly the oxidation of the sample and produces X-ray diffraction peaks with intensities between seven and ten times larger than those obtained when using HP or ultrahigh purity argon or helium gases during heating and measurement of the diffraction patterns.
The specimen was continuously heated at a rate of 1 °C s−1 to 300 °C and held during 180 s, then heated continuously at the same rate to 1050 °C and held during 300 s. Subsequently, the sample was cooled in a stepwise manner decreasing −10 °C from 1000 to 720 °C. The cooling rate between temperatures was 1 °C s−1. At each selected temperature, θ/2θ scans from 40° to 45° 2θ were measured at 0.02° 2θ/s to record the diffracted intensities of the (110)α and (111)γ peaks. In the experimental steel, the intensity of the first peak of ferrite was ∼30 counts; this value of counts was relatively lower compared with the peak of maximum intensity. Thus, for a registered value of counts lower than 30, it was considered as the Ae3 temperature. When the intensity of austenite peak decreased below ∼30 counts, it was considered as the Ae1 temperature.
In the case of other steels, where the first intensity peak of ferrite was higher than 30 counts, additional measurements were required. In this case, X-ray diffraction patterns were measured each 2 °C above the temperature at which the first ferrite peak was showed. The time elapsed until the rank of temperature was closed to detect the Ae3 should be added to the total time of the phase transformation. The value of intensity of 30 counts is not considered as background due to the high intensity peaks produced by the use of helium-BIP gas.
In the experimental steel, the total time elapsed between each pattern recorded was 300 s (10 s for cooling, 250 s measurement time, and 40 s to introduce the file names and

Figure 3. High-temperature X-ray diffraction patterns of experimental steel for temperature range from 1000 to 720 °C.
next selected temperature in the DRX software). The integrated intensities of the (111)γ and (110)α peaks, I γ and I α, were calculated from the measured diffraction patterns using SIETRONICS TRACES XRD analysis software Version 3.0 (GBC, 2009).
In addition, the HTXRD results were supported by microstructural observations using a reflected light microscope. Thirty samples were austenized at 1050 °C and held during 300 s (same heat treatment to those applied in the HTXRD experiment), and then the temperature was lowered from 1000 to 710 °C by steps of −10 °C, held during 300 s, and each sample was quenched at the selected temperatures.
III. RESULTS AND DISCUSSION
The effect of temperature on the X-ray diffraction patterns of the steel sample measured every −10 °C from 1000 to 720 °C is shown in Figure 3. The Cu Kα1 peaks of (110)α and (111)γ appear at about 44.6° and 43.4°, respectively. The patterns show changes in the intensities of these peaks as a function of temperature. Austenite is the only equilibrium phase at 1000 °C and the ferrite phase appears first at a 950 °C (at 1800 s). The austenite-ferrite transformation ends at 720 °C (8700 s). Calculation of the austenite-ferrite equilibrium temperatures using Thermo-Calc (Thermo-Calc Software AB, 2006) and the full chemical composition of the experimental steel resulted in Ae1=719 °C and Ae3=944 °C. These results are in good agreement with those

Figure 4. (Color online) Temperature vs d spacings and 2θ peak positions of (a) austenite and (b) ferrite.
estimated from the HTXRD measurements performed in this work. The experimental results (Ae3=950 °C and Ae3=950 °C ) are also very close to those obtained by continuous cooling dilatometry using a cooling rate of 1 °C s−1:Ae3=955 °C and Ae1=728.5 °C (Ghassemi and Salinas, Reference Ghassemi and Salinas2009). The transformation temperatures estimated by the present HTXRD technique show an error of 3% to 5% with respect to those estimated using continuous cooling dilatometry and those calculated using Thermo-Calc.
It is apparent in Figure 3 that the 2θ maximum positions of the austenite (111)γ and ferrite (110)α peaks shift to larger 2θ angles as the temperature decreases due to thermal contraction. Using the 2θ maximum positions, the interplanar d spacings of (111)γ and (110)α were calculated from Bragg’s law (λ=2dhkl sin θ and λ=1.540 56 Å) and plotted as a function of temperature and time. As can be seen in Figure 4(a), during cooling from 1000 to 960 °C, the 2θ position of the (111)γ peak remains relatively unchanged and then increases suddenly at a temperature that corresponds to Ae3=950 °C (experimental equilibrium transformation temperature). The interplanar d spacings of (110)α decrease from 950 to 930 °C (50% of the phase transformation), then decrease notably from 860 °C to the end of transformation (720 °C). Thus, 90% of phase transformation has taken place at 890 °C. Below 890 °C, d spacings of (111)γ change significantly because the austenite fraction is very small (10%); a small quantity of austenite remains to transform to ferrite until the end of phase transformation [see Figures (a) and (b)].
The austenite to ferrite transformation causes a volume expansion and, therefore, must reduce the rate of contraction due to thermal effects. Nucleation of ferrite during cooling at temperatures below Ae3 takes place by nucleation at austenite grain boundaries. Growth of the ferrite then proceeds first laterally along the boundary and then perpendicularly into the austenite grain. The nucleation and growth involve a reconstructive mode of crystal structure change without any form of macroscopic shape change and only a positive volume change is observed due to the larger specific volume of ferrite. This volume expansion must reduce the rate of contraction due to thermal effects at temperatures where the γ→α transformation takes place. However, it has been reported by Jonas and Liang (Reference Jonas and Liang2002) that the ferrite crystals exhibit the Kurdjumov-Sachs orientation relationship (Kurdjumov and Sachs, Reference Kurdjumov and Sachs1930), {110}α∥{111}γ, 〈111〉α∥〈110〉γ, with one of the austenite grains at the boundary where nucleation occurs. This relationship implies that the closed packed planes and directions of the austenite and ferrite phases are parallel to each other and, therefore, favor formation of a semicoherent austenite-ferrite boundary which minimizes the surface energy required for nucleation of ferrite. Growth of the grain boundary nucleated ferrite occurs then into the adjacent austenite grain with no specific orientation and the noncoherent nature of this interface allows rapid growth of the ferrite crystal by a diffusion-controlled process. The apparent increase in the rate of decrease of the (111)γ interplanar d spacings as the temperature decreases below Ae3 [Figure 4(a)] may be attributed to transformation-induced compressive stresses generated normal to the surface of the specimen as the ferrite nucleates and grows into the austenite grains.
The integrated intensities of the (111)γ and (110)α peaks, I γ and I α, are shown in Figure 5(a). Following the method described by Cullity (Reference Cullity1978), the concentrations (vol %) of austenite and ferrite, C γ and C α, were calculated from I γ and I α using the equation of I γ/I α=2.8483(C γ/C α). The time-temperature evolutions of the concentrations (or volume fractions) of austenite and ferrite are shown in Figure 5(b). The resulting curves exhibit a sigmoid behavior, characteristic of the diffusion-controlled phase transformation. The main characteristic of this diffusion-controlled phase transformation is mass exchange between austenite and ferrite phases leading to spatial growth of the ferrite and shrinkage of the austenite phase.
Figure 5(b) must be interpreted carefully. The volume fraction of ferrite, at a given temperature and time, is the sum of the amount of ferrite present at the beginning of cooling from the previous temperature plus the amount of ferrite formed from the beginning of cooling up to the end of the measurement of the diffraction pattern. Since the time of the measurement (300 s) is significantly larger than the time of cooling (10 s), it can be argued that the additional amount of ferrite formed at every temperature step was the result of the isothermal transformation of the austenite. Thus, the data in Figure 5(b) represent a measure of the additional quantity of

Figure 5. (Color online) Integrated intensities and fractions of austenite and ferrite in experimental steel.
austenite that can be transformed isothermally to ferrite within the austenite-ferrite phase field when the temperature is decreased by 10 °C at a rate of 1 °C s−1.
The kinetics of the austenite-ferrite phase transformation in steels can be controlled by the diffusion of the components (Inden, Reference Inden, Finel, Mazière and Véron2003), by the interfacial reaction (Borgenstam and Hillert, Reference Borgenstam and Hillert2000), or by both mechanisms (Krielaart et al., Reference Krielaart, Sietsma and Van Der Zwaag1997). It is also possible that the transformation mechanism changes during the transformation process (Svoboda et al., Reference Svoboda, Gamsjager, Fischer and Fratzl2004; Sietsma and Van Der Zwaag, Reference Sietsma and Van Der Zwaag2004). For the apparent activation energy, Ea, based on the Avrami kinetic model (Avrami, Reference Avrami1940), using the values of time and temperature at 50% of transformation from Figure 5(b) (2498 s at 926.3 °C), the estimated activation energy for the phase transformation in the experimental steel was 132.15 kJ mol−1, in a good agreement with the literature values (136 kJ mol−1) for a steel with similar chemical composition (Morra et al., Reference Morra, Böttger and Mittemeijer2001). The Avrami model equation, also known as Kolmogorov-Johnson-Mehl-Avrami equation, has been widely used for the preliminary identification of the growth rate law and to describe any solid-solid phase transformations (Kim et al., Reference Kim, Kim, Kacynski, Acher, Yoon, Anderson, Payzant and Li2005; Lind et al., Reference Lind, Angus, Wilkinson, Rawn and Payzant2002; Anderson and Mehl, Reference Anderson and Mehl1945; Avrami, Reference Avrami1939, Reference Avrami1941; Choi et al., Reference Choi, Mamak, Speakman, Chopra and Ozin2005; Johnson and Mehl, Reference Johnson and Mehl1939; Kolmogorov, Reference Kolmogorov1937).

Figure 6. Microstructures of samples of experimental steel cooled from 1000 to (a) 960 °C and (b) 949 °C held during 300 s and finally quenched to room temperature.
Figure 6 illustrates the effect of quenching temperature on the room temperature microstructures of samples of experimental steel isothermally treated during 300 s at 960 and 949 °C. The Ms martensite starting temperature calculated from the chemical composition of this steel was 507 °C (Steven and Haynes, Reference Steven and Haynes1956; Messien et al., Reference Messien, Herman, Greday, Kot and Bramfitt1981). As can be seen, the microstructures in the sample quenched from 960 °C showed practically 100% martensite [Figure 6(a)]. This microstructure indicates that the sample was fully austenitic at the moment of quenching, i.e., T ≥ Ae3. In contrast, sample quenched from 949 °C exhibits a microstructure consisting of thin films of ferrite [Figure 6(b)]. According to Reed and Bhadeshia (Reference Reed and Bhadeshia1992) allotriomorphic ferrite nucleates at austenite grain boundaries and grows isothermally following a parabolic time law. In the present experiments the isothermal transformation time was held constant (300 s) and the transformation temperature was decreased. It was observed that decreasing the temperature causes coarsening of the ferrite allotriomorphs and, therefore, the microstructural evidence suggests that the transformation rate increases as the temperature decreases within the austenite+ferrite phase field for the experimental steel. When the transformation temperature is decreased below the temperature at which the austenite peak was no longer observed in the diffraction pattern, the morphology of the ferrite phase changes to equiaxed and the martensite is no longer observed.
Finally, Figure 7 shows the effect of temperature on the size of ferrite in the microstructure at room temperature of quenched samples of the experimental steel. Thin ferrite films (∼6 μm) were formed at 949 °C; this corroborates that the experimental Ae3 transformation temperature was an excellent determination compared with Ae3 obtained by HTXRD. In the case of samples quenched from rank 949 to 890 °C, they exhibit thin ferrite films of less than 15 μm in thickness.

Figure 7. Effect of temperature on the “size” of the ferrite formed isothermally at temperatures between 949 and 720 °C.
As can be seen, isothermal transformation, at lower temperatures, causes a rapid increase of the ferrite thickness in samples quenched from 900 to 720 °C. The data in Figure 7 represent the average thickness of the grain boundary allotriomorphic ferrite while, for samples quenched from 900 °C to lower temperatures, the size represents the average equiaxed ferrite grain size. This ferrite films can be formed by strain-induced deformation at temperatures higher than Ae3 (Yada et al., Reference Yada, Li and Yamagata2000) causing ductility loss during hot rolling.
IV. CONCLUDING REMARKS
The proposed method using in situ HTXRD allows for the determination of the Ae3 and Ae1 equilibrium transformation temperatures in low C steels. The Ae3 and Ae1 equilibrium temperatures were determined to be 950 and 720 °C, respectively. Quantitative analysis of the experimental data allows also estimation of the relative volume fractions of austenite and ferrite that are present in the sample at a given temperature and time and can be used to estimate activation energies for the transformation. The effect of the temperature on interplanar d spacings of ferrite and austenite was determined from the integrated intensities of X-ray diffraction patterns. The HTXRD results agree to those of equilibrium transformation temperatures obtained by Thermo-Calc software and dilatometric technique. The result is it can have implications even to determine equilibrium transformation temperatures in steels with different chemical compositions to the investigated steel. The proposed method has also been tested with specimens of several steels alloyed with Co, and results are in good agreement with those obtained by dilatometric technique and Thermo-Calc comparison methods. The reproducibility in all experiments of HTXRD measurements shows an error of 3% to 5%. In addition, the formation of thin ferrite films was observed at temperatures below Ae3 in the experimental steel.
ACKNOWLEDGMENT
The authors are grateful to Consejo Nacional de Ciencia y Tecnología (CONACYT) for financial support.