


I. INTRODUCTION
Our structural studies of Group 1 (alkali metal) citrates (Kaduk and Stern, Reference Kaduk and Stern2016a, Reference Kaduk and Stern2016b; Rammohan and Kaduk, Reference Rammohan and Kaduk2016a, Reference Rammohan and Kaduk2016b, Reference Rammohan and Kaduk2016c, Reference Rammohan and Kaduk2016d, Reference Rammohan and Kaduk2016e, Reference Rammohan and Kaduk2017a, Reference Rammohan and Kaduk2017b, Reference Rammohan and Kaduk2017c, Reference Rammohan and Kaduk2017d, Reference Rammohan and Kaduk2017e, Reference Rammohan and Kaduk2017f; Rammohan et al., Reference Rammohan, Sarjeant and Kaduk2016; Reference Rammohan, Sarjeant and Kaduk2017a, Reference Rammohan, Sarjeant and Kaduk2017b; Cigler and Kaduk, Reference Cigler and Kaduk2018) have led us to consider other citrate salts of monopositive cations. An ammonium ion is sometimes considered a pseudo-alkali metal cation.
To determine what crystallography had been done on ammonium citrates, we searched two databases. In the Powder Diffraction File (PDF)-4 Organics 2018 (Fawcett et al., Reference Fawcett, Kabekkodu, Blanton and Blanton2017), a search for compounds containing the elements H, C, N, and O only and “citrat” in the name yielded four hits. A search of the Cambridge Structural Database (Groom et al., Reference Groom, Bruno, Lightfoot and Ward2016) for entries containing both a citrate and an ammonium fragment yielded 23 hits, most of which also contained metal cations. For the purpose of this study, only four hits were relevant.
The unit cell of (NH4)H2C6H5O7 was reported by Love and Patterson (1960; CSD Refcode ZZZDTW): space group P-1, a = 7.492, b = 10.539, c = 6.150 Å, α = 102.42, β = 105.57, γ = 104.67°, V = 431.145 Å3, Z = 2, but no atom coordinates were determined.
The crystal structure of (NH4)2HC6H5O7 was reported by Andrade et al. (Reference Andrade, Costa, Paixão, Santos, Agostinho Moreira and Almeida2002; CSD Refcode ZZZSAC01). The space group is Pnma, with a = 10.775(6), b = 14.715(7), c = 6.165(2) Å, V = 977.5 Å3, and Z = 4. The unit cell had been reported previously by Love and Patterson (Reference Love and Patterson1960). Experimental powder patterns of diammonium hydrogen citrate were reported by Visser (Reference Visser1979) and Gong (Reference Gong1980), and a pattern calculated from the crystal structure is included in the PDF-4 Organics as entry 02-081-0712.
An orthorhombic unit cell with a = 6.2232, b = 15.048, and c = 11.056 Å was reported for (NH4)3C6H5O7 by Venkateshwarlu et al. (Reference Venkateshwarlu, Bhaskar Rao and Kishan Rao1989; CSD Refcode SESJIJ), but no coordinates were determined. An experimental powder pattern is reported by Venkateshwarlu et al. (Reference Venkateshwarlu, Hussain and Bhaskar Rao1993) as PDF entry 00-045-1540 with a space group Pcc2, a = 6.171(2), b = 14.990(6), c = 10.783(5) Å, V = 997.46 Å3. Both the unit cell and the powder pattern make it clear that this material is actually (NH4)2HC6H5O7 (Figure 1).
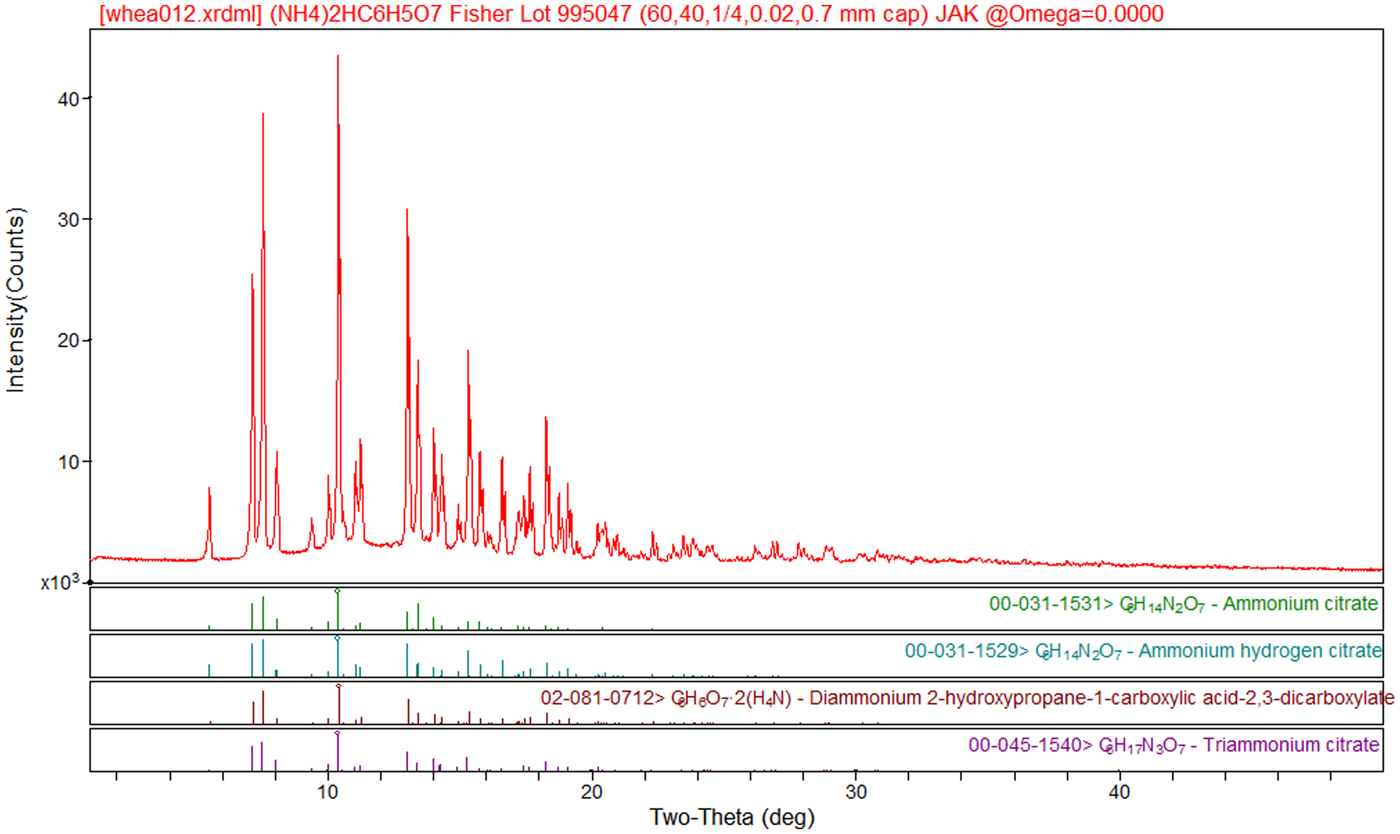
Figure 1. (Color online) Experimental powder pattern of (NH4)2HC6H5O7 (Mo Kα radiation), with the three PDF entries for this compound. The “triammonium citrate” of PDF entry 00-045-1540 has been mis-characterized.
II. EXPERIMENTAL
(NH 4)H 2C 6H 5O 7. To 2.0281 g citric acid monohydrate (10.0 mmoles, Sigma-Aldrich lot #089K0091) dissolved in 10 ml water were added 2.3735 g (30.0 mmoles, Spectrum Chemical lot#00B34) NH4HCO3. After fizzing, the clear solution was exposed to ambient conditions in a Petri dish in a fume hood. After 18 days, a white solid was observed in the thick solution (20307-106-1). Single crystals (20307-105-1) were obtained from a replication of this preparation. The composition of the crystals did not correspond to the overall stoichiometry.
A portion of the solid was ground in a mortar and pestle. The X-ray powder pattern was measured on a Bruker D2 Phase diffractometer equipped with a LynxEye position-sensitive detector. The pattern was measured using CuKα radiation from 5 to 100°2θ in 0.0202144° steps, counting for 0.5 s/step. The standard instrument settings (30 kV, 10 mA, 0.6 mm divergence slit, 2.5°Soller slits, and 3 mm scatter screen height) were employed.
The powder pattern was indexed on a primitive triclinic unit cell with a = 6.1166, b = 7.4765, c = 10.5035 Å, α = 104.791, β = 101.744, γ = 105.730°, V = 427.4 Å3 using N-TREOR as incorporated into EXPO2014 (Altomare et al., Reference Altomare, Cuocci, Giacovazzo, Moliterni, Rizzi, Corriero and Falcicchio2013). This cell is very similar to the reduced cell reported by Love and Patterson (Reference Love and Patterson1960) for (NH4)H2C6H5O7 (a = 6.150, b = 7.492, c = 10.539 Å, α = 104.67, β = 102.42, γ = 105.57°, V = 431.145 Å3), indicating that ammonium dihydrogen citrate crystallized from an aqueous solution of triammonium citrate. The structure was solved with FOX (Favre-Nicolin and Černý, Reference Favre-Nicolin and Černý2002) using an ammonium cation and a citrate anion as fragments. The positions of the active hydrogens were deduced by analysis of hydrogen bonding patterns.
Subsequent to the solution using powder data, single crystals were obtained from another crystallization from triammonium citrate solution. A crystal approximately 0.20 × 0.30 × 0.50 mm3 was mounted in a Bruker SMART X2S diffractometer, and a single crystal data set was collected at 300 K using MoK α radiation. Data collection information is summarized in Table I.
Table I. Single crystal data collection for (NH4)H2C6H5O7.

Since the single crystal and powder data sets were collected at the same temperature, a joint refinement using both data sets was carried out using GSAS (Toby, Reference Toby2001; Larson and Von Dreele, Reference Larson and Von Dreele2004). Only the 12.0–100.0° portion of the powder pattern was included in the refinement (d min = 1.005 Å). The C, N, and O atoms were refined independently and anisotropically. The C-H bond distances were restrained to 0.96(2) Å, the O17-H18 distance to 0.85(2) Å, and the N-H distances to 0.95(2) Å. The hydrogen atoms were refined isotropically, with common U iso based on chemical similarity. The peak profiles were described using profile function #4 (Thompson et al., Reference Thompson, Cox and Hastings1987; Finger et al., Reference Finger, Cox and Jephcoat1994), which includes the Stephens (Reference Stephens1999) anisotropic strain broadening model. The background was modeled using a 6-term shifted Chebyshev polynomial. A 4th-order spherical harmonic model was included; the refined texture index was 1.114, so preferred orientation was present in the powder specimen. The final refinement of 177 variables using 8119 observations (4353 powder data points, 3757 single crystal reflections, and 9 restraints) yielded the residuals R wp = 0.0719, R p = 0.0551, and χ 2 = 5.116. The largest peak (0.67 Å from C3) and hole (0.00 Å from H22) in the difference Fourier map were 0.28 and −0.28 eÅ−3, respectively. The Rietveld plot is included as Figure 2.
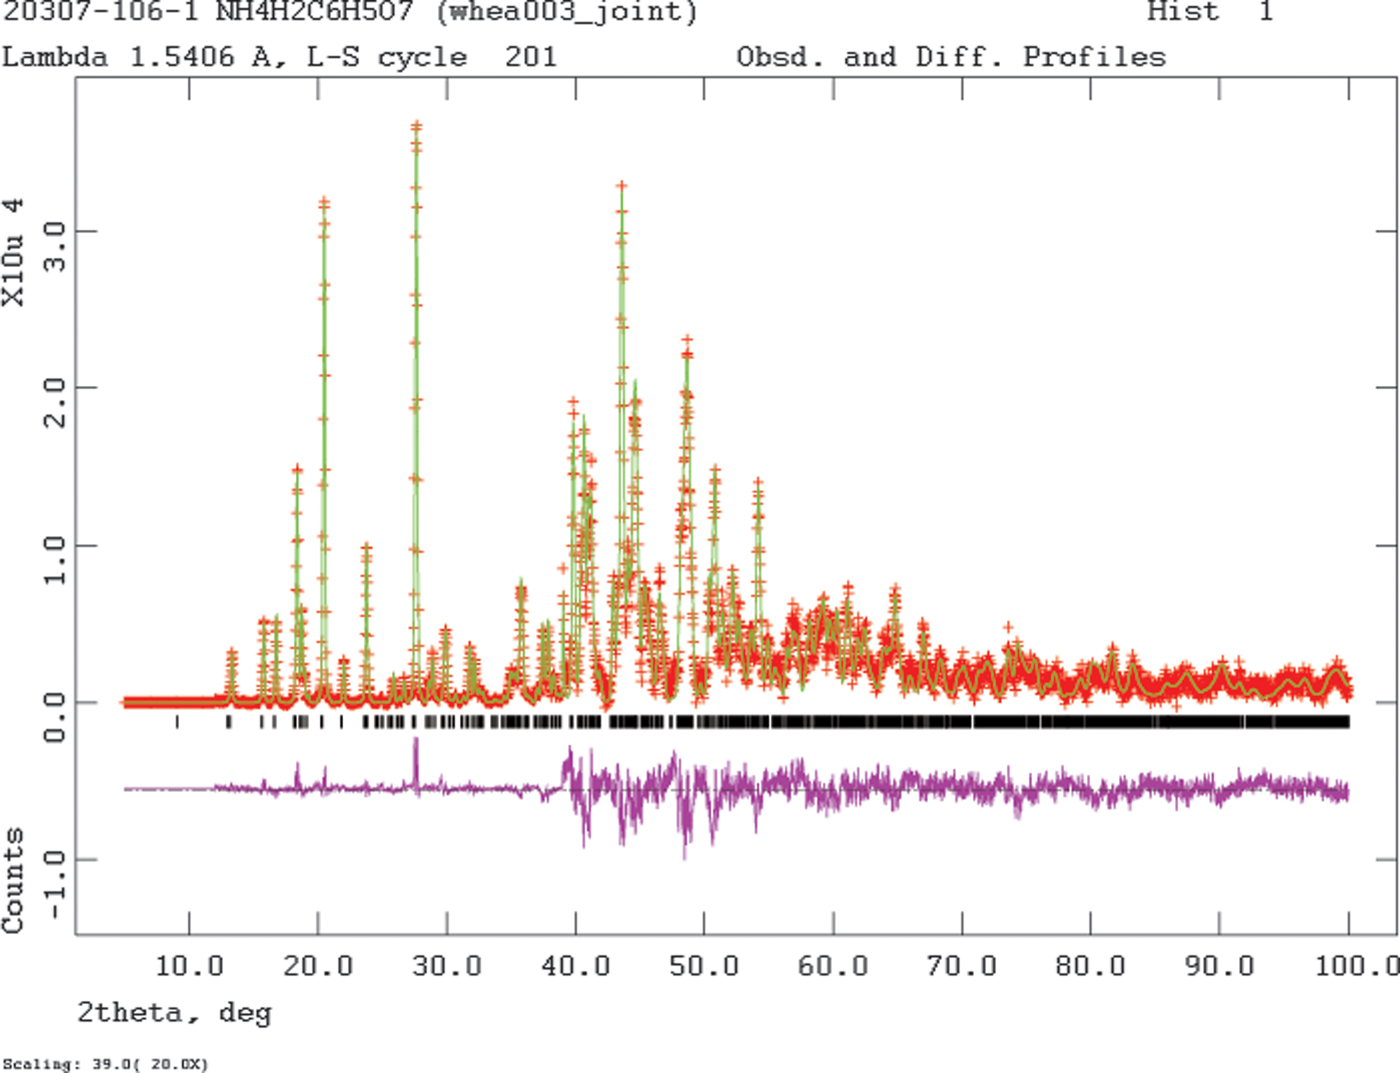
Figure 2. (Color online) The Rietveld plot for the refinement of (NH4)H2C6H5O7. The red crosses represent the observed data points, and the green line is the calculated pattern. The magenta curve is the difference pattern, plotted at the same vertical scale as the other patterns. The vertical scale has been multiplied by a factor of 20 for 2θ > 39.0°. The row of black tick marks indicates the calculated reflection positions.
(NH 4)2HC 6H 5O 7. Diammonium hydrogen citrate (Fisher lot #995047) was obtained from the chemistry stockroom at North Central College. A portion of the sample was ground in a mortar and pestle and sieved to <400 mesh. The powder pattern was measured on a PANalytical Empyrean diffractometer equipped with an incident-beam focusing mirror and an X'Celerator detector. The pattern (1–50°2θ, 0.0167113° steps, 4 s/step, 1/4° divergence slit, 0.02 radian Soller slits) was measured from a rotated 0.7 mm capillary using Mo Kα radiation. The powder pattern corresponded to that calculated from the crystal structure (Figure 2). A Rietveld refinement using the fixed ZZZSAC01 structure was carried out to determine the lattice parameters and profile coefficients.
(NH 4)3C 6H 5O 7. Triammonium citrate (Sigma-Aldrich lot #BCBS1296) was obtained from the chemistry stockroom at North Central College. A portion of the sample was ground in a mortar and pestle and sieved to <400 mesh. The powder pattern was measured on a PANalytical Empyrean diffractometer equipped with an incident-beam focusing mirror and an X'Celerator detector. The pattern (1–50° 2θ, 0.0167113° steps, 4 s/step, 1/4° divergence slit, 0.02 radian Soller slits) was measured from a rotated 0.7 mm capillary using MoK α radiation.
The pattern was indexed on a primitive monoclinic unit cell with a = 6.077, b = 13.375, c = 13.534 Å, β = 92.53°, V = 1103.4 Å3, and Z = 4 using DICVOL as incorporated into FOX. The suggested space group was P21/c, which was confirmed by sa uccessful solution and refinement of the structure. The structure was solved with FOX (sinθ/λ max = 0.40 Å−1), using a citrate anion and 3 N atoms as fragments. The success rate was ~30% of the multiple runs.
Subsequent to the solution using powder data, poor-quality single crystals were isolated from the reagent bottle. A crystal approximately 0.40 × 0.40 × 0.40 mm3 was mounted in a Bruker SMART X2S diffractometer, and a single crystal data set was collected at 300 K using MoK α radiation. Data collection information is summarized in Table II. A data set was collected from another crystal at 200 K to determine the lattice parameters.
Table II. Room-temperature data collection for (NH4)3C6H5O7.
Since the single crystal and powder data sets were collected at the same temperature, a joint refinement using both data sets was carried out using GSAS (Larson and Von Dreele, Reference Larson and Von Dreele2004; Toby, Reference Toby2001). Only the 5.0–42.0° portion of the powder pattern was included in the refinement (d min = 0.989 Å). The C, N, and O atoms were refined independently and anisotropically. All non-H bond distances and angles were subjected to restraints. The C-C bonds between the terminal carboxyl carbon atoms and the adjacent carbon atoms were restrained at 1.51(2) Å, the C-C bonds between the central carbon atom and the adjacent carbon atoms at 1.54(1) Å, the C-C bond between the central carbon atom and the central carboxyl carbon at 1.55(1) Å, the C-O bond to the hydroxyl group at 1.43(3) Å, and the C-O bonds in the carboxylate groups at 1.25(2) Å. The tetrahedral carbon bond angles were restrained at 109(3)°, and the angles in the planar carboxyl groups at 120(3)°. The C-H bond distances were restrained to 1.00(3) Å, and the N-H distances to 0.90(3) Å. The hydrogen atoms were refined isotropically, with common U iso based on chemical similarity. The peak profiles were described using profile function #4 (Thompson et al., Reference Thompson, Cox and Hastings1987; Finger et al., Reference Finger, Cox and Jephcoat1994), which includes the Stephens (Reference Stephens1999) anisotropic strain broadening model. The background was modeled using a 1-term shifted Chebyshev polynomial and a 6-term diffuse scattering function to model the capillary and any amorphous component. A 2nd-order spherical harmonic model was included; the refined texture index was 1.005, so preferred orientation was not significant in the powder specimen. The final refinement of 215 variables using 11614 observations (2214 powder data points, 9354 single crystal reflections, and 46 restraints) yielded the residuals R wp = 0.0447, R p = 0.0341, and χ 2 = 9.703. The single crystal R w(F o) was 0.073. The largest peak (1.40 Å from N21) and hole (1.44 Å from O15) in the difference Fourier map were 0.28 and −0.26 eÅ−3, respectively. The Rietveld plot is included as Figure 3. The overall fit is excellent; the good signal/noise and the restraints result in a relatively high reduced χ 2 to accompany the low R wp. The largest errors in the fit are in the shapes of some of the peaks.
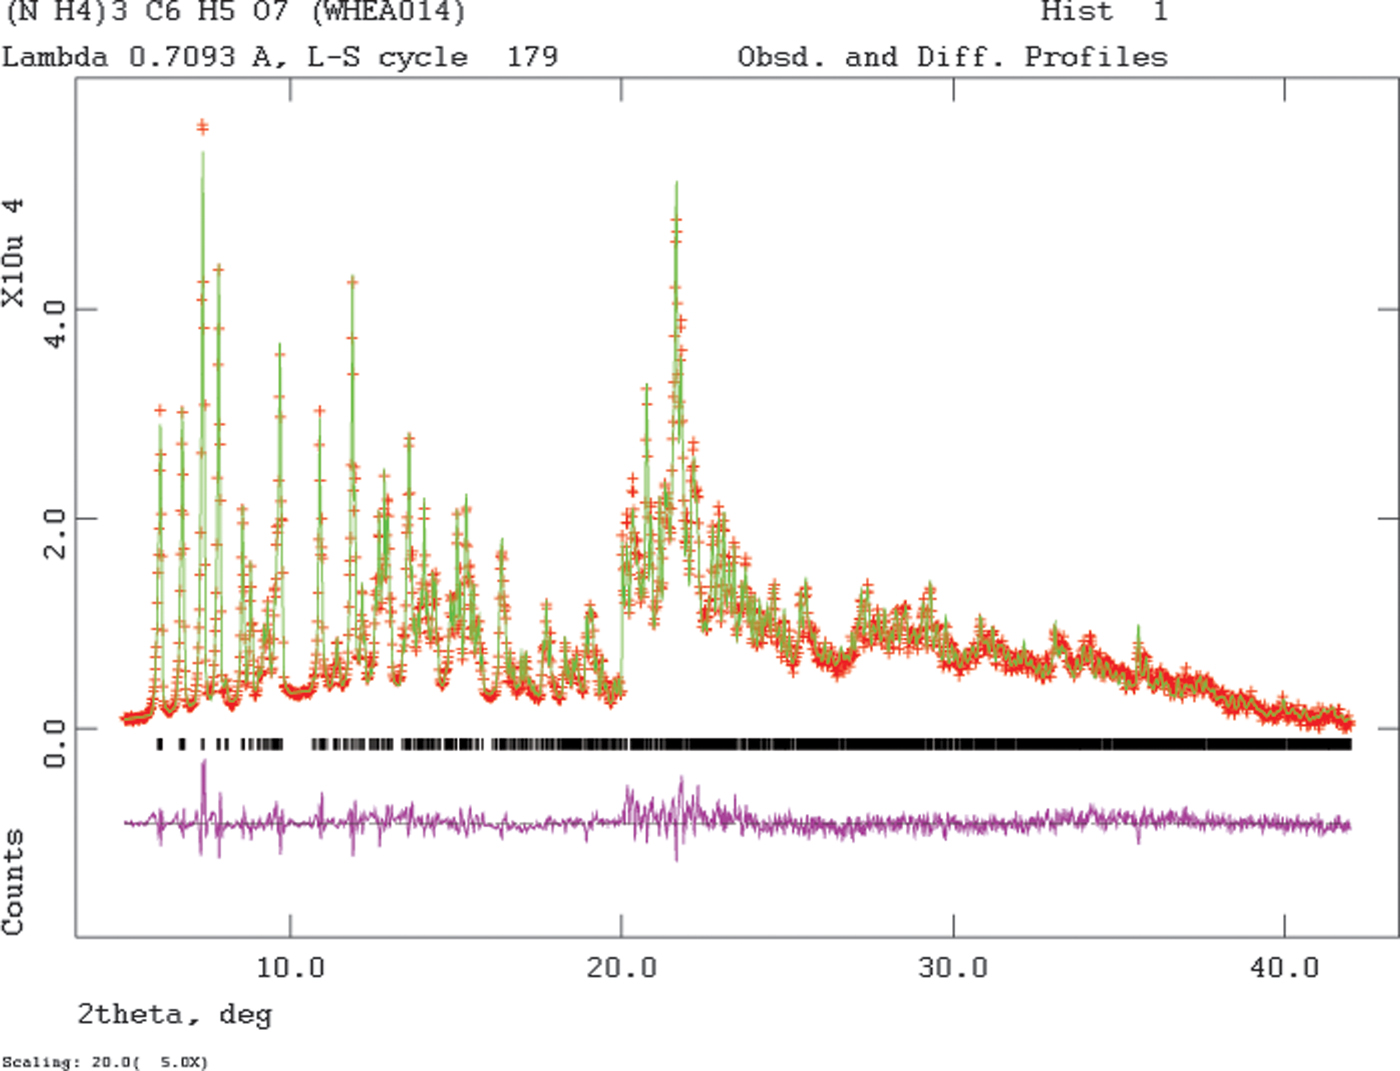
Figure 3. (Color online) The Rietveld plot for the refinement of (NH4)3C6H5O7. The red crosses represent the observed data points, and the green line is the calculated pattern. The magenta curve is the difference pattern, plotted at the same vertical scale as the other patterns. The vertical scale has been multiplied by a factor of 5 for 2θ > 20.0°. The row of black tick marks indicates the calculated reflection positions.
Density functional geometry optimizations (fixed experimental unit cells) of all three structures were carried out using CRYSTAL14 (Dovesi et al., Reference Dovesi, Orlando, Erba, Zicovich-Wilson, Civalleri, Casassa, Maschio, Ferrabone, De La Pierre, D-Arco, Noël, Causà and Kirtman2014). The basis sets for the H, C, N, and O atoms were those of Peintinger et al. (Reference Peintinger, Vilela Oliveira and Bredow2013). The calculations were run on eight 2.1 GHz Xeon cores (each with 6 Gb RAM) of a 304-core Dell Linux cluster at IIT, used 8 k-points and the B3LYP functional, and took ~2–3 days (66 h/(NH4)H2C6H5O7, 43 h/(NH4)2HC6H5O7, 57 h/(NH4)3C6H5O7).
For (NH4)H2C6H5O7 and (NH4)3C6H5O7, density functional optimizations (fixed experimental unit cells) were also carried out using VASP (Kresse and Furthmüller, Reference Kresse and Furthmüller1996) through the MedeA graphical interface (Materials Design, 2016). The calculations were carried out on 8 2.4 GHz processors (each with 4 Gb RAM) of a 64-processor HP Proliant DL580 Generation 7 Linux cluster at North Central College. The calculation used the GGA-PBE functional, a planewave cutoff energy of 400 eV, and a k-point spacing of 0.5 Å−1 (3 × 2 × 2 and 3 × 1 × 1 k-points), and took 0.7 and 1.6 h.
III. RESULTS AND DISCUSSION
The refined atom coordinates for all three compounds and the coordinates from the density functional theory (DFT) optimizations are reported in the CIFs attached as Supplementary Material. For (NH4)H2C6H5O7 and (NH4)3C6H5O7 (the new structures solved using powder data), the optimizations were carried out using both CRYSTAL14 and VASP. The fractional coordinates of the nitrogen atoms of the ammonium ions were identical (to within 0.001 Å) and the root-mean-square Cartesian displacements of the non-H atoms in the citrate anions were 0.027 and 0.012 Å, respectively. The two programs yield essentially identical structures. Since it is easier to analyze the hydrogen bonds using the CRYSTAL14 output, this discussion will concentrate on those optimized structures.
Comparing the experimental and DFT-optimized structures, the root-mean-square Cartesian displacements of the non-hydrogen atoms in the citrates of (NH4)H2C6H5O7, (NH4)2HC6H5O7, and (NH4)3C6H5O7 are 0.0722, 0.0206, and 0.1021 Å respectively (Figures 4a, b, c). The excellent agreement between the refined and optimized structures is evidence that the experimental structures are correct (van de Streek and Neumann, Reference van de Streek and Neumann2014). The agreement for the single-crystal structure is notably better than for the two powder structures. The following discussion uses the DFT-optimized structures.
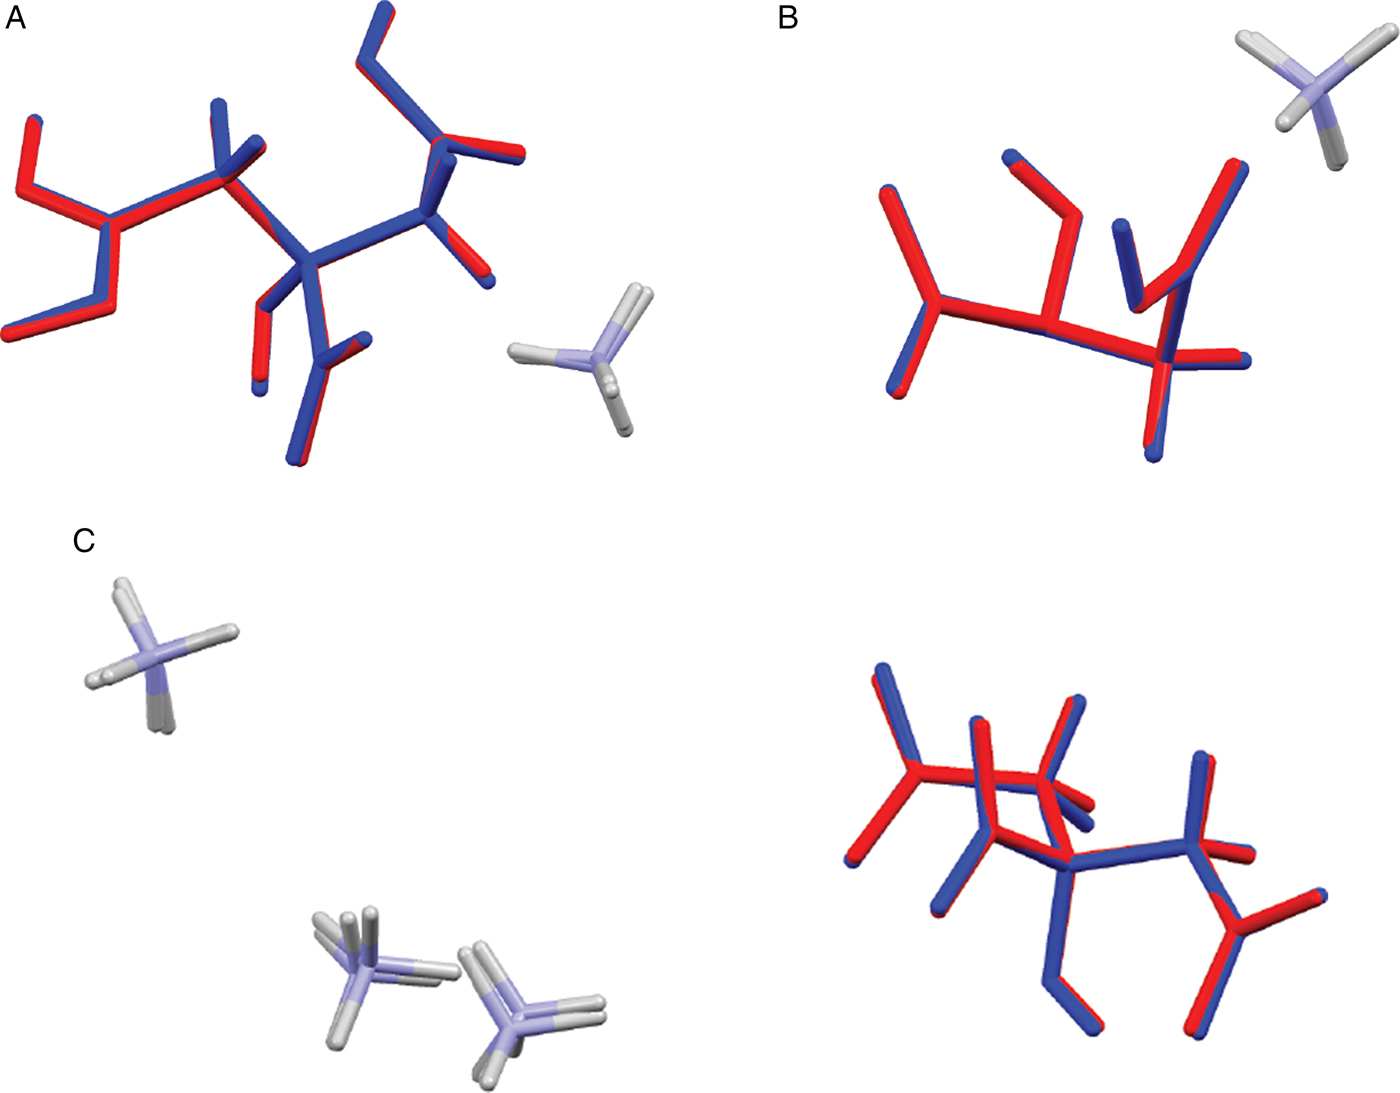
Figure 4. (Color online) (a) Comparison of the refined and optimized structures of (NH4)H2C6H5O7. The Rietveld/single crystal refined structure is in red, and the density functional theory (DFT)-optimized structure is in blue. (b) Comparison of the refined and optimized structures of (NH4)2HC6H5O7. The Rietveld/single crystal refined structure is in red, and the DFT-optimized structure is in blue. (c). Comparison of the refined and optimized structures of (NH4)3C6H5O7. The Rietveld/single crystal refined structure is in red, and the DFT-optimized structure is in blue.
Almost all of the bond distances, bond angles, and torsion angles in the citrate anions fall within the normal ranges indicated by a Mercury Mogul Geometry check (Macrae et al., Reference Macrae, Bruno, Chisholm, Edington, McCabe, Pidcock, Rodriguez-Monge, Taylor, van de Streek and Wood2008). Only the O11-C1-C2-C3 and C4-C3-C2-C1 torsion angles in (NH4)H2C6H5O7 are flagged as unusual. As noted in Rammohan and Kaduk (Reference Rammohan and Kaduk2018), the carboxyl torsion angles in citrates cover all possible values, so the occurrence of this angle in a minor part of the distribution is not a cause for concern. The citrate in (NH4)H2C6H5O7 occurs in the gauche/trans conformation [Figure 5(a)], one of the two lowest-energy conformations of an isolated citrate (though a minority). The citrates in (NH4)2HC6H5O7 and (NH4)3C6H5O7 occur in the trans/trans conformation (Figure 5b).
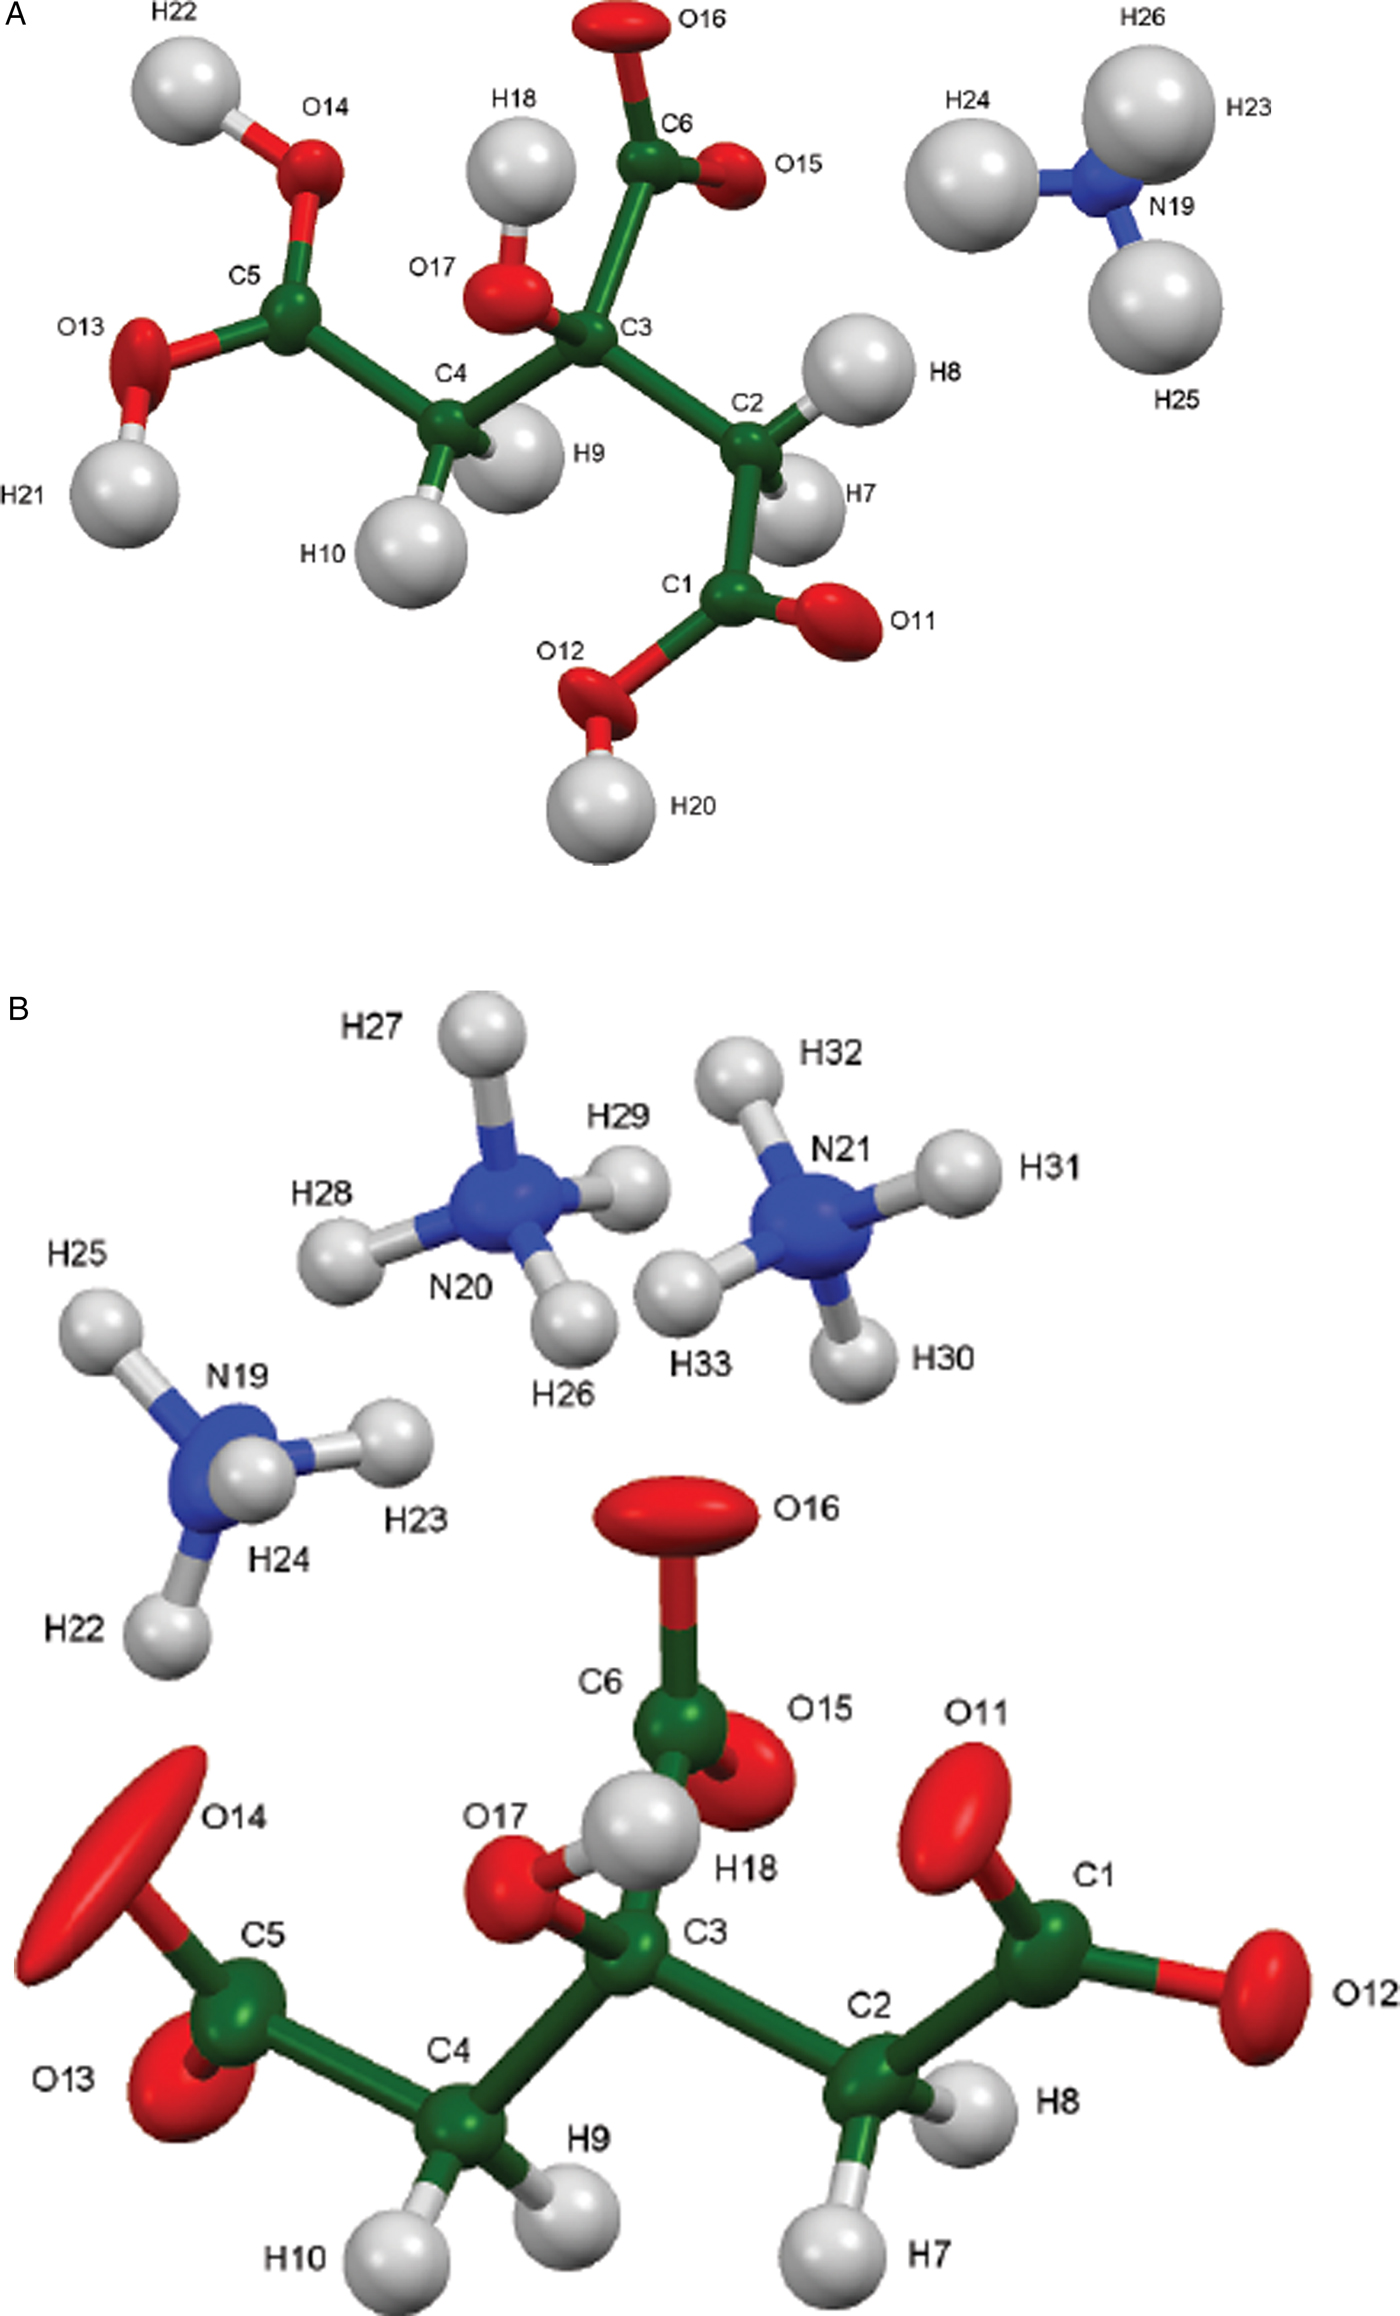
Figure 5. (Color online) (a) The asymmetric unit of (NH4)H2C6H5O7, with the atom numbering. The atoms are represented by 50% probability ellipsoids (b) The asymmetric unit of (NH4)3C6H5O7, with the atom numbering. The atoms are represented by 50% probability ellipsoids.
The three crystal structures are illustrated in Figures 6(a)–6(c). As discussed below, all three structures are dominated by hydrogen bonding. The hydrophobic methylene groups lie adjacent to each other in the structures. In (NH4)2HC6H5O7 the citrate anion lies on a mirror plane.
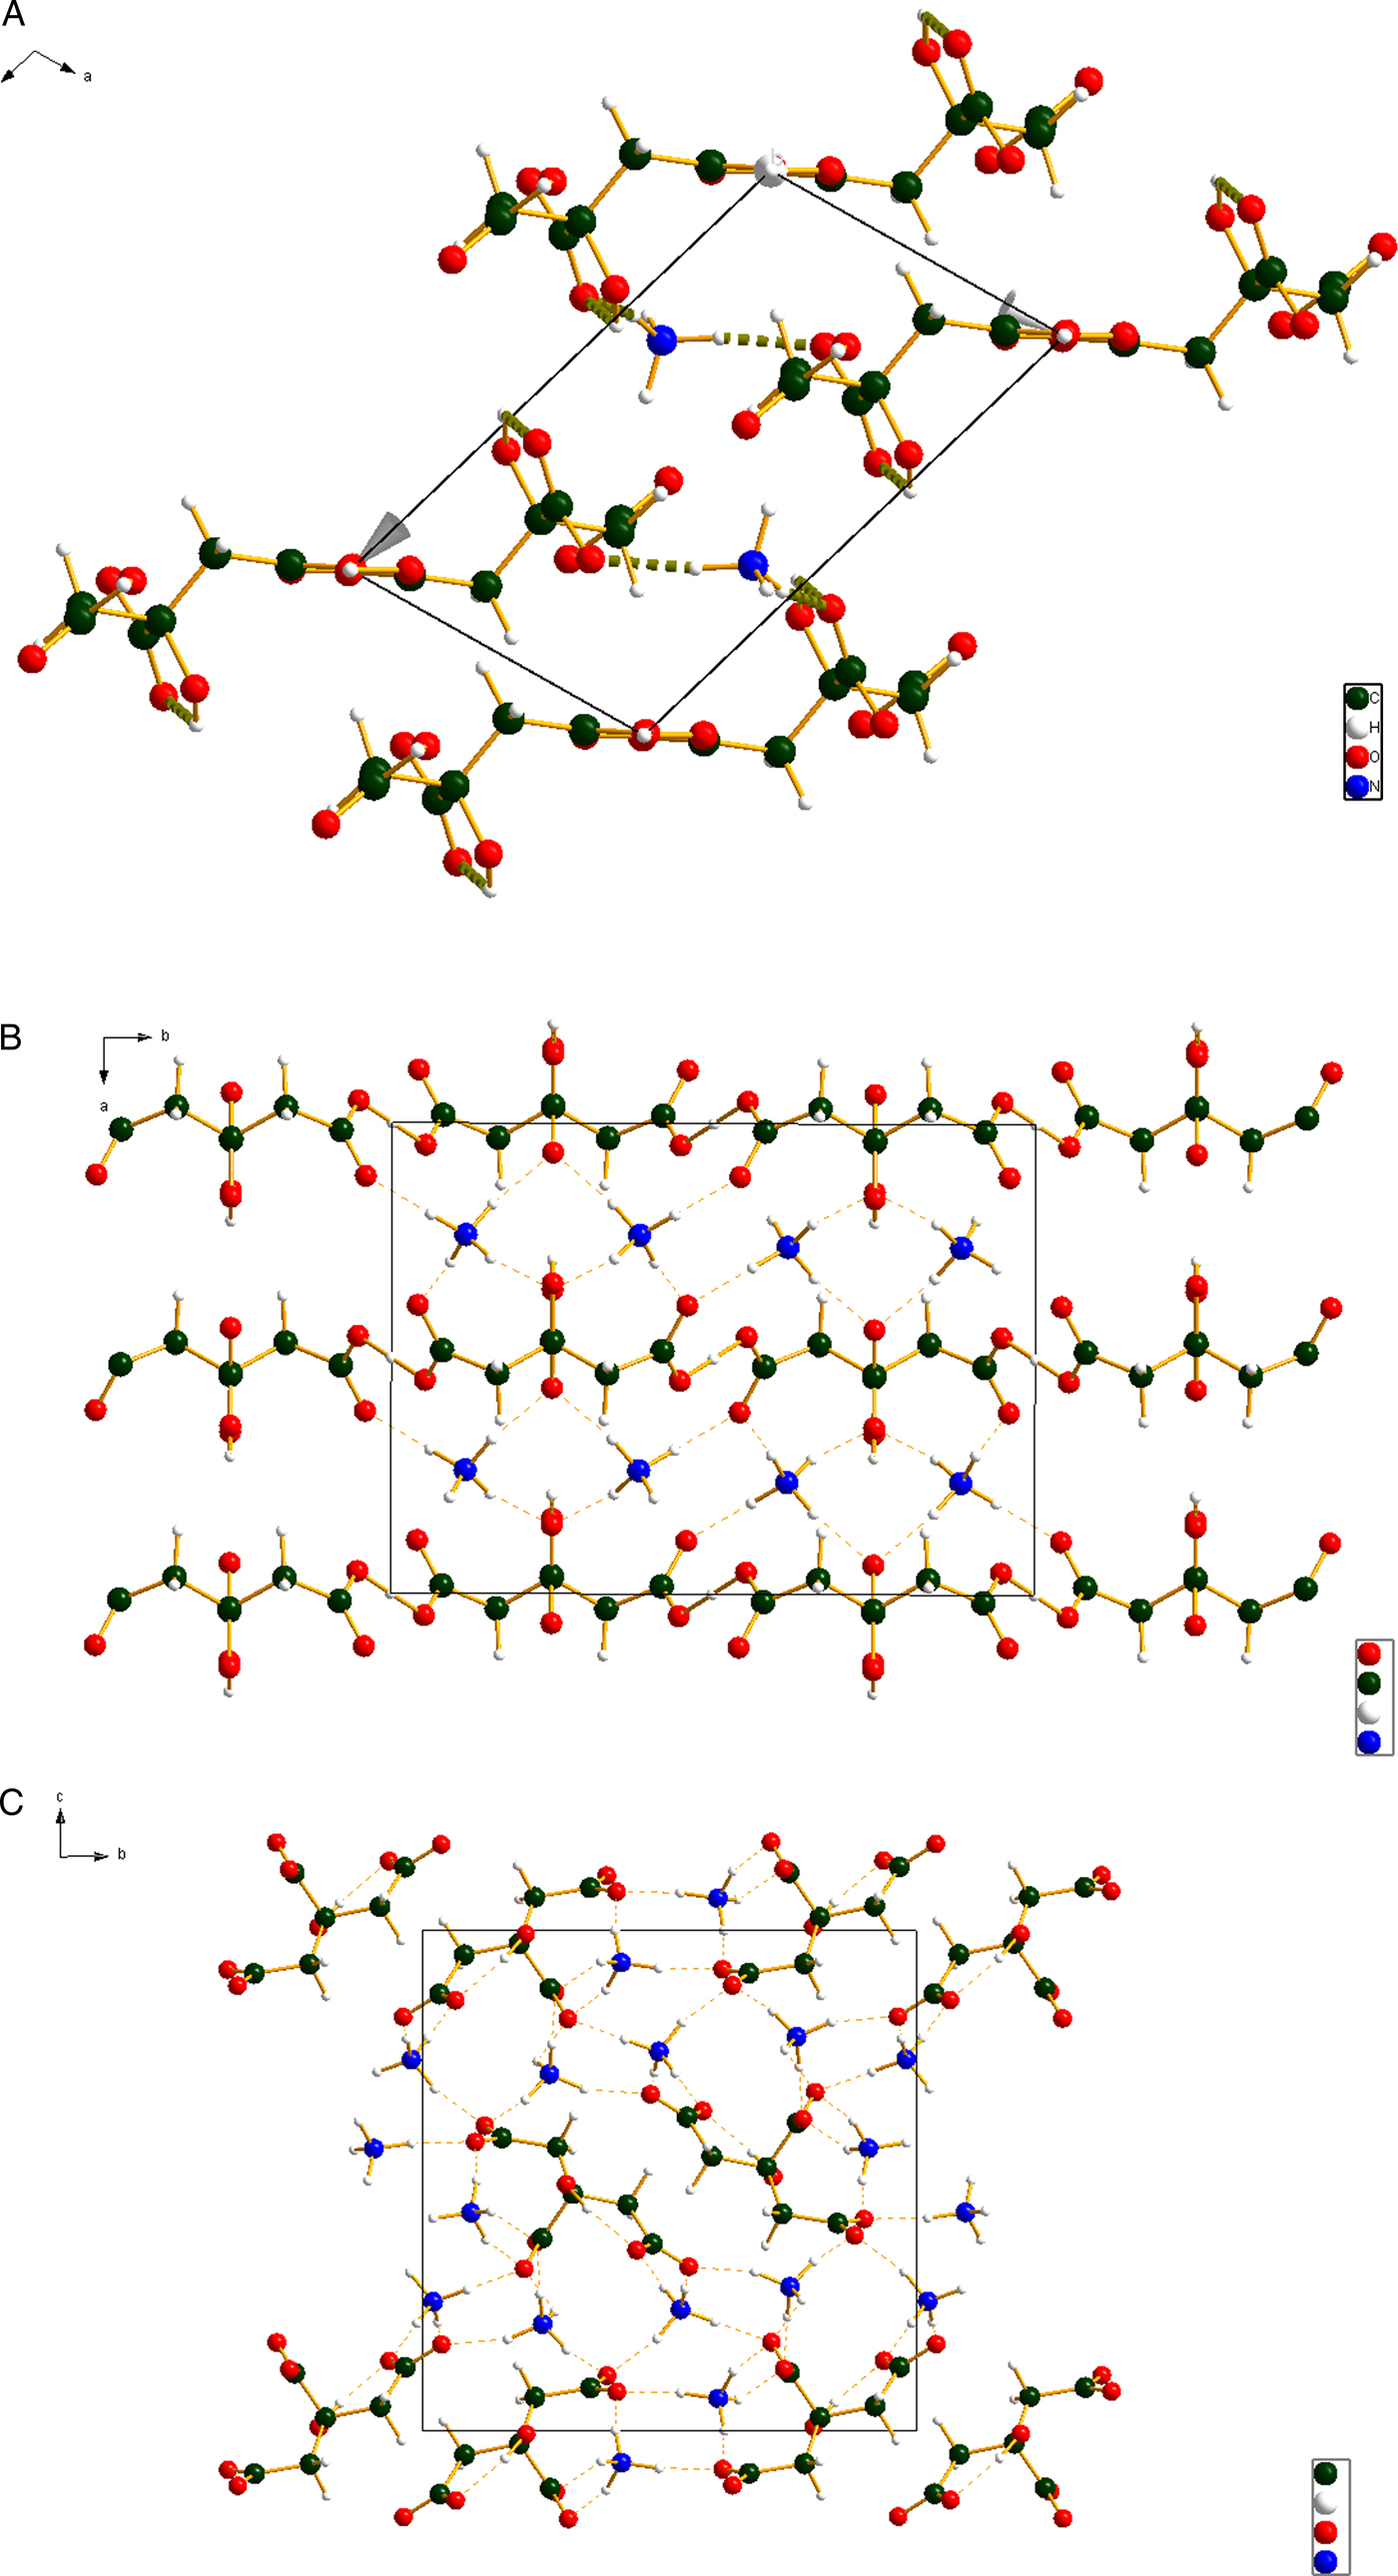
Figure 6. Color online (a) The crystal structure of (NH4)H2C6H5O7, viewed down the b-axis. (b) The crystal structure of (NH4)2HC6H5O7, viewed down the c-axis. (c) The crystal structure of (NH4)3C6H5O7, viewed down the a-axis.
Analysis of the contributions to the total crystal energy in (NH4)3C6H5O7 using the Forcite module of Materials Studio (Dassault, 2018) suggests that the intermolecular energy is dominated by electrostatic attractions, which in this force-field-based analysis include hydrogen bonds. The hydrogen bonds are better analyzed using the results of the DFT calculations. (Forcite was not able to accommodate the chains of strong H-bonds in (NH4)H2C6H5O7 and (NH4)2HC6H5O7.)
As expected, these crystal structures are dominated by N-H⋅⋅⋅O hydrogen bonds (Tables III, IV, and V), though O-H⋅⋅⋅O hydrogen bonds are also important. In (NH4)H2C6H5O7 very strong (as measured by the Mulliken overlap populations) centrosymmetric charge-assisted O13-H21-O13 and O14-H22-O14 hydrogen bonds link one end of the citrate into chains along the b-axis. A more-normal (by the overlap population) O12-H20⋅⋅⋅O15 links the other end of the citrate to the central ionized carboxyl group. Ionization of the central carboxyl group first is the normal pattern of ionization in the solid state (Rammohan and Kaduk, Reference Rammohan and Kaduk2018). The hydroxyl group forms an intramolecular hydrogen bond to the central carboxylate. The N19-H23⋅⋅⋅O11 hydrogen bond is weaker than the other four, reflected in its length, angle, and overlap population. In (NH4)2HC6H5O7, the very strong centrosymmetric O1-H8-O1 hydrogen bonds link the citrates into zig-zag chains along the b-axis. The citrates occupy layers parallel to the bc plane, and the ammonium ions link the layers through N-H⋅⋅⋅O hydrogen bonds. All four of the N-H⋅⋅⋅O hydrogen bonds have similar strength. The hydroxyl groups also form an intramolecular hydrogen bond to the central ionized carboxylate and (NH4)2HC6H5O7, hydroxyl groups. In (NH4)3C6H5O7, the hydroxyl group forms a hydrogen bond to a terminal carboxylate, perhaps because each of the oxygen atoms of the central carboxylate acts as an acceptor in two N-H⋅⋅⋅O hydrogen bonds. The hydrogen bond involving H30 is weaker than the other 11 N-H⋅⋅⋅O hydrogen bonds, reflected by its smaller angle.
The unit cell energies of the three compounds calculated by CRYSTAL14 provide an opportunity to derive a correlation between the Mulliken overlap population in an N-H⋅⋅⋅O hydrogen bond and the energy of that bond. Under the assumption that the energy/citrate is a linear combination of the energies of the citrate anion, the ammonium cations, the N-H⋅⋅⋅O hydrogen bonds, and the O-H⋅⋅⋅O hydrogen bonds (the energies of which were calculated using the correlation in Rammohan and Kaduk, Reference Rammohan and Kaduk2018), some simple algebra results in an average N-H⋅⋅⋅O hydrogen bond energy of −4.79 kcal/mole. The average Mulliken overlap population of the N-H⋅⋅⋅O hydrogen bonds in these compounds is 0.043(13) e. Assuming the previous correlation that the energy of a hydrogen bond is proportional to the square root of the overlap population in the H⋅⋅⋅A bond (Rammohan and Kaduk, Reference Rammohan and Kaduk2018; Kaduk, Reference Kaduk2002), we derive:
 $$E({\rm N}-{\rm H}\cdot \cdot \cdot {\rm O}){\rm} \lpar {{\rm kcal}/{\rm mole}} \rpar = 23.1\lpar {{\rm overlap}} \rpar ^{1/2}$$
This correlation was used to calculate the hydrogen bond energies in TABLES III–V.
Table III. Hydrogen bonds (CRYSTAL14) in ammonium dihydrogen citrate.
* = intramolecular.
Table IV. Hydrogen bonds (CRYSTAL14) in diammonium hydrogen citrate.
* = intramolecular.
Table V. Hydrogen bonds (CRYSTAL14) in triammonium citrate.

The lattice parameters of (NH4)3C6H5O7 were determined at 200 K from a single crystal and at 300 K using powder data (Table VI). The expansion between the two temperatures is nearly isotropic.
Table VI. Lattice parameters of (NH4)3C6H5O7.
The Bravais-Friedel-Donnay-Harker (Bravais, Reference Bravais1866; Friedel, Reference Friedel1907; Donnay and Harker, Reference Donnay and Harker1937; calculated in Mercury) morphology suggests that we might expect platy morphology for (NH4)H2C6H5O7 with {001} as the major faces, blocky morphology for (NH4)2HC6H5O7 with {020} as major faces, and {011} plates and/or {100} needles for (NH4)3C6H5O7. As noted in the experimental section, preferred orientation was not severe for any of these samples.
As shown in Figure 1, the powder pattern reported in PDF entry 00-045-1540 for “triammonium citrate” corresponds to the experimental and calculated patterns for diammonium hydrogen citrate. The compound was mis-characterized by Venkateshwarlu et al. (Reference Venkateshwarlu, Hussain and Bhaskar Rao1993). An authentic powder pattern for triammonium citrate (as well as one for ammonium dihydrogen citrate) have been submitted to the International Centre for Diffraction Data for inclusion in the PDF.
SUPPLEMENTARY MATERIAL
The supplementary material for this article can be found at https://doi.org/10.1017/S0885715618000829.
ACKNOWLEDGEMENTS
The authors thank Andrey Rogachev for the use of computing resources at IIT.


