


I. INTRODUCTION
Nilotinib hydrochloride monohydrate (Tasigna®) is an orally bioavailable derivative of imatinib. As a second-generation tyrosine kinase inhibitor, it is approved for the treatment of a type of blood cancer called Philadelphia chromosome positive chronic myeloid leukemia (Deremer et al., Reference Deremer, Ustun and Natarajan2008). The free-base phase (nilotinib) does not contain HCl or H2O. The systematic name (CAS Registry Number 641571-10-0) is 4-methyl-N-[3-(4-methyl-1H-imidazol-1-yl)-5-(trifluoromethyl)phenyl]-3-[(4-pyridin-3-ylpyrimidin-2-yl)amino]benzamide. A two-dimensional molecular diagram of nilotinib is shown in Figure 1.

Figure 1. The molecular structure of nilotinib.
The presence of high-quality reference powder patterns in the Powder Diffraction File (PDF; ICDD, Reference Kabekkodu2014) is important for phase identification, particularly by pharmaceutical, forensic, and law enforcement scientists. The crystal structures of a significant fraction of the largest dollar volume pharmaceuticals have not been published, and thus calculated powder patterns are not present in the PDF-4 databases. Sometimes experimental patterns are reported, but they are generally of low quality. This structure is a result of a collaboration among ICDD, Illinois Institute of Technology, Poly Crystallography Inc., and Argonne National Laboratory to measure high-quality synchrotron powder patterns of commercial pharmaceutical ingredients, include these reference patterns in the PDF, and determine the crystal structures of these active pharmaceutical ingredients (APIs).
Even when the crystal structure of an API is reported, the single crystal structure was often determined at low temperature. Most powder measurements are performed at ambient conditions. Thermal expansion (often anisotropic) means that the peak positions calculated from a low-temperature single crystal structure often differ significantly from those measured at ambient conditions. These peak shifts can result in failure of default search/match algorithms to identify a phase, even when it is present in the sample. High-quality reference patterns measured at ambient conditions are thus critical for easy identification of APIs using standard powder diffraction practices.
II. EXPERIMENTAL
Nilotinib commercial reagent was purchased from Carbosynth LLC (lot FN108311101) and was used as-received. The white powder was packed into a 1.5 mm diameter Kapton capillary, and rotated during the measurement at ~50 cycles s−1. The powder pattern was measured at 295 K at beam line 11-BM (Lee et al., Reference Lee, Shu, Ramanathan, Preissner, Wang, Beno, Von Dreele, Ribaud, Kurtz, Antao, Jiao and Toby2008; Wang et al., Reference Wang, Toby, Lee, Ribaud, Antao, Kurtz, Ramanathan, Von Dreele and Beno2008) of the Advanced Photon Source at Argonne National Laboratory using a wavelength of 0.413 691 Å from 0.5° to 50° 2θ with a step size of 0.001° and a counting time of 0.1 s step−1. The pattern was indexed on a primitive triclinic unit cell having a = 4.5181, b = 10.6391, c = 13.7042 Å, α = 68.862, β = 82.143, γ = 84.200°, V = 607.70 Å3, and Z = 1 using DICVOL06 (Louër and Boultif, Reference Louër and Boultif2007). With one molecule in the unit cell, the space group was assumed to be P1. A reduced cell search in the Cambridge Structural Database (Allen, Reference Allen2002) yielded nine hits, but no structure for nilotinib.
A nilotinib cation was built and its conformation optimized using Spartan‘14 (Wavefunction, 2013), and saved as a mol2 file. This file was converted into a Fenske–Hall Z-matrix file using OpenBabel (O'Boyle et al., Reference O'Boyle, Banck, James, Morley and Hutchison2011). Preliminary attempts to solve the structure using this molecule, a chlorine atom, and an oxygen atom (water molecule) led to solutions in which the Cl and O were too close to the organic cation. (The authors originally believed that this sample was nilotinib hydrochloride monohydrate.) A direct methods solution using EXPO2013 (Altomare et al., Reference Altomare, Cuocci, Giacovazzo, Moliterni, Rizzi, Corriero and Falcicchio2013) yielded no heavy atom. Accordingly, only a nilotinib molecule was used as a fragment to solve the structure using FOX (Favre-Nicolin and Černý, Reference Favre-Nicolin and Černý2002). Much higher-quality solutions were obtained, and subsequent refinement confirmed that the sample was nilotinib. Chemical analysis indicated only traces of Cl (consistent with the NaCl detected during the refinement) and not the 6.3 wt% Cl expected for the hydrochloride, confirming that the sample was free base. Positions of the active hydrogens were deduced by an analysis of potential hydrogen bonding.
Rietveld refinement was carried out using the General Structure Analysis System (GSAS) (Larson and Von Dreele, Reference Larson and Von Dreele2004). Only the 2.0°–25°portion of the pattern was included in the refinement. The C1–C6 and C20–C25 benzene rings were refined as rigid bodies. All other non-H bond distances and angles were subjected to restraints, based on a Mercury/Mogul Geometry Check (Bruno et al., Reference Bruno, Cole, Kessler, Luo, Motherwell, Purkis, Smith, Taylor, Cooper, Harris and Orpen2004; Sykes et al., Reference Sykes, McCabe, Allen, Battle, Bruno and Wood2011) of the molecule. The Mogul average and standard deviation for each quantity were used as the restraint parameters. The restraints contributed 4.00% to the final χ 2. Isotropic displacement coefficients were refined, grouped by chemical similarity. The hydrogen atoms were included in calculated positions, which were recalculated during the refinement. The U iso of each hydrogen atom was constrained to be 1.3 × that of the heavy atom to which it is attached. The peak profiles were described using profile function #4 (Thompson et al., Reference Thompson, Cox and Hastings1987; Finger et al., Reference Finger, Cox and Jephcoat1994), which includes the Stephens (Reference Stephens1999) anisotropic strain broadening model. The background was modeled using a three-term shifted Chebyshev polynomial and an eight-term diffuse scattering (Debye) function, to model the scattering from the Kapton capillary and any amorphous component of the sample. A second-order spherical harmonic preferred orientation correction was included in the model. A few weak peaks not accounted for by nilotinib indicated the presence of NaCl (0.54 wt%), which was included in the refinement as a second phase.
Initial refinement of the model from FOX yielded an excellent refinement; R wp = 0.0708, R p = 0.0545, and χ 2 = 1.083. The root-mean-square deviation of the non-hydrogen atoms was 0.290 Å, a little high, but within the range of correct structures (van de Streek and Neumann, Reference van de Streek and Neumann2014). However, we realized that rotating the C34–C39 C5H4N ring by 180° would result in a more-reasonable hydrogen bonding pattern. A density functional theory (DFT) geometry optimization of this second model yielded a structure 10.4 Kcal mole−1 lower in energy, and this structure was used as the basis for the final refinement. The final refinement of 130 variables using 23 081 observations (23 002 data points and 79 restraints) yielded the residuals R wp = 0.0717, R p = 0.0559, and χ 2 = 1.161. The largest peak (1.12 Å from C18) and hole (2.02 Å from N29) in the difference Fourier map were 0.34 and −0.37 e Å−3, respectively. The Rietveld plot is included as Figure 2. The largest errors are in the shapes of some of the low-angle peaks. These errors and some difficulty in refining the lattice parameters suggested that the sample may have changed slightly during the measurement.

Figure 2. (Color online) The Rietveld plot for the refinement of nilotinib. The red crosses represent the observed data points, and the green line is the calculated pattern. The magenta curve is the difference pattern, plotted at the same vertical scales as the other patterns. The vertical scale has been multiplied by a factor of 5 for 2θ > 7.2° and by a factor of 20 for 2θ > 12.8°.
A density functional geometry optimization (fixed experimental unit cell) was carried out using CRYSTAL09 (Dovesi et al., Reference Dovesi, Orlando, Civalleri, Roetti, Saunders and Zicovich-Wilson2005). The basis sets for the H, C, N, and O atoms were those of Gatti et al. (Reference Gatti, Saunders and Roetti1994), and the basis set for F was that of Nada et al. (Reference Nada, Catlow and Orlando1993). The calculation used eight k-points and the B3LYP functional.
III. RESULTS AND DISCUSSION
The refined atom coordinates of nilotinib are reported in Table I, and the coordinates from the DFT optimization in Table II. The root-mean-square deviation of the non-hydrogen atoms is 0.142 Å (Figure 3). The excellent agreement between the refined and optimized structures is strong evidence that the structure is correct (van de Streek and Neumann, Reference van de Streek and Neumann2014). The less-good agreement for the first model serves as a caution that a DFT optimization can merely confirm a false minimum structure. The discussion of the geometry uses the DFT-optimized structure. The asymmetric unit (with atom numbering) is illustrated in Figure 4, and the crystal structure is presented in Figure 5.

Figure 3. (Color online) Comparison of the refined and optimized structures of nilotinib. The Rietveld refined structure is in red and the DFT-optimized structure is in blue.

Figure 4. (Color online) The molecular structure of nilotinib, with the atom numbering. The atoms are represented by 50% probability spheroids.
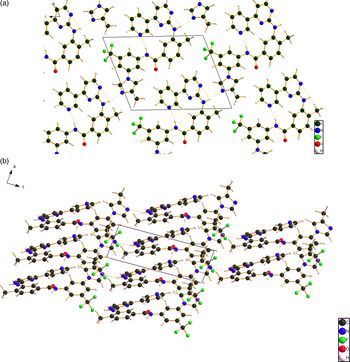
Figure 5. (Color online) (a) The crystal structure of nilotinib, viewed down the a-axis. (b) A view down the b-axis, showing the parallel stacking of aromatic rings.
Table I. Rietveld refined crystal structure of nilotinib.

Table II. DFT (CRYSTAL09) optimized crystal structure of nilotinib.

All bond distances, angles, and torsion angles fall within the normal ranges indicated by a Mercury Mogul Geometry Check. Nilotinib is generally drawn in an extended conformation, but occurs in the crystal structure in a curled up one. A molecular mechanics conformational analysis in Spartan'14 yields a minimum energy conformation which is even more curled up, having parallel stacking of three 6-rings and another parallel stacking of a 5- and 6-ring. We can then expect that parallel stacking of aromatic rings will be important in the crystal structure, as is observed.
An analysis of the contributions to the total crystal energy using the Forcite module of Materials Studio (Accelrys, 2013) suggests that angle distortion terms are the major intramolecular contribution to the crystal energy, and that electrostatic attraction (which in this force field analysis include hydrogen bonds) is important. Van der Waals forces appear to be small. The hydrogen bonds are better analyzed using the results of the DFT calculation.
The most prominent feature of the structure is two strong hydrogen bonds, N27–H55···N10 and N17–H48···N36 (Table III). These form chains with a graph set (Etter, Reference Etter1990; Bernstein et al., Reference Bernstein, Davis, Shimoni and Chang1995; Shields et al., Reference Shields, Raithby, Allen and Motherwell2000) C1,1(13). The chains run along [111]. Several weak C–H···O hydrogen bonds also contribute to the packing. The carbonyl oxygen O19 acts as an acceptor in both intra- and inter-molecular hydrogen bonds.
Table III. Hydrogen bonds in nilotinib.

The volume enclosed by the Hirshfeld surface (Figure 6; Hirshfeld, Reference Hirshfeld1977; McKinnon et al., Reference McKinnon, Spackman and Mitchell2004; Spackman and Jayatilaka, Reference Spackman and Jayatilaka2009; Wolff et al., Reference Wolff, Grimwood, McKinnon, Turner, Jayatilaka and Spackman2012) is 598.58 Å3, 98.5% of the unit cell volume. The molecules are thus not tightly packed. The only significant close contacts (red in Figure 6) involve the hydrogen bonds.

Figure 6. (Color online) The Hirshfeld surface of nilotinib. Intermolecular contacts longer than the sums of the van der Waals radii are colored blue, and contacts shorter than the sums of the radii are colored red. Contacts equal to the sums of radii are white.
The Bravais–Friedel–Donnay–Harker (Bravais, Reference Bravais1866; Friedel, Reference Friedel1907; Donnay and Harker, Reference Donnay and Harker1937) morphology suggests that we might expect elongated morphology for nilotinib, with <001> as the long axis. A second-order spherical harmonic preferred orientation model was included in the refinement; the texture index was only 1.003, indicating that preferred orientation was not significant for this rotated capillary specimen. The powder pattern of nilotinib has been submitted to ICDD for inclusion in future releases of the PDF.
SUPPLEMENTARY MATERIALS AND METHODS
The supplementary material for this article can be found at http://www.journals.cambridge.org/PDJ
ACKNOWLEDGEMENTS
Use of the Advanced Photon Source at Argonne National Laboratory was supported by the U.S. Department of Energy, Office of Science, Office of Basic Energy Sciences, under Contract No. DE-AC02-06CH11357. This work was partially supported by the International Centre for Diffraction Data. The authors thank Lynn Ribaud for his assistance in data collection and Thanh Nguyen and Gerry Zajac of Ineos Technologies for the chemical analysis.


