I. INTRODUCTION
Preparation of the medical isotope technetium-99m (99mTc, daughter isotope of 99Mo) using non-traditional methods such as linear accelerator (LINAC) production (Hoedl and Updegraff, Reference Hoedl and Updegraff2015) has taken on increased importance. The recent shuttering of the National Research Universal (NRU) nuclear reactor facility at Chalk River (Lougheed, Reference Lougheed2017), uncertainty in the supply chain security for 99Mo (Van Noordan, Reference Van Noorden2013), and desire for migration to production routes that do not require highly enriched uranium have increased the emphasis on developing alternative techniques for isotope production (Lyra et al., Reference Lyra, Charalambatou, Roussou, Fytros and Baika2011; Wolterbeek et al., Reference Wolterbeek, Kloosterman, Lathouwers, Rohde, Winkelman, Frima and Wols2014; Welsh et al., Reference Welsh, Bigles and Valderrabano2015).
Chemistry development for target processing and Mo recycling related to LINAC production of 99Mo recently led to the structural characterization of two molybdate compounds (Reid et al., Reference Reid, Kaduk and Olson2017, Reference Reid, Kaduk and Matei2018). The phase described in this work appears comparable to a hydrated molybdenum peroxide phase documented previously in the Powder Diffraction File (ICDD, Reference Kabekkodu2016), H2MoO5·H2O (PDF entry 00-041-0060), without determination of the crystal structure. This work describes the crystal structure and provides a reflection list based on the final Rietveld refinement for phase identification.
II. EXPERIMENTAL
A specimen of molybdenum processing powder supplied by Canadian Isotope Innovation Corp. was examined as-synthesized. The specimen was mounted in a 0.5 mm ID Kapton capillary, which was sealed at both ends with adhesive.
Powder X-ray diffraction (PXRD) patterns were collected using a Canadian Macromolecular Crystallography Facility beamline (08B1-1, Fodje et al., Reference Fodje, Grochulski, Janzen, Labiuk, Gorin and Berg2014) at the Canadian Light Source (CLS). 08B1-1 is a bending magnet beamline with a Si (111) double-crystal monochromator. Two-dimensional (2D) data were obtained using a Rayonix MX300HE detector with an active area of 300 mm × 300 mm. The patterns were collected at an energy of 18 keV (λ = 0.68880 Å) and a sample-detector distance of 250 mm.
The 2D PXRD patterns were calibrated and integrated using the GSASII software package (Toby and Von Dreele, Reference Toby and Von Dreele2013). The sample-detector distance, detector centering, and tilt were calibrated using a lanthanum hexaboride (LaB6) standard reference material (NIST SRM 660a LaB6) and the calibration parameters were applied to all patterns. After calibration, the 2D patterns were integrated to obtain standard powder diffraction patterns. A pattern collected from an empty Kapton capillary (using the same conditions) was subtracted from the sample data during integration.
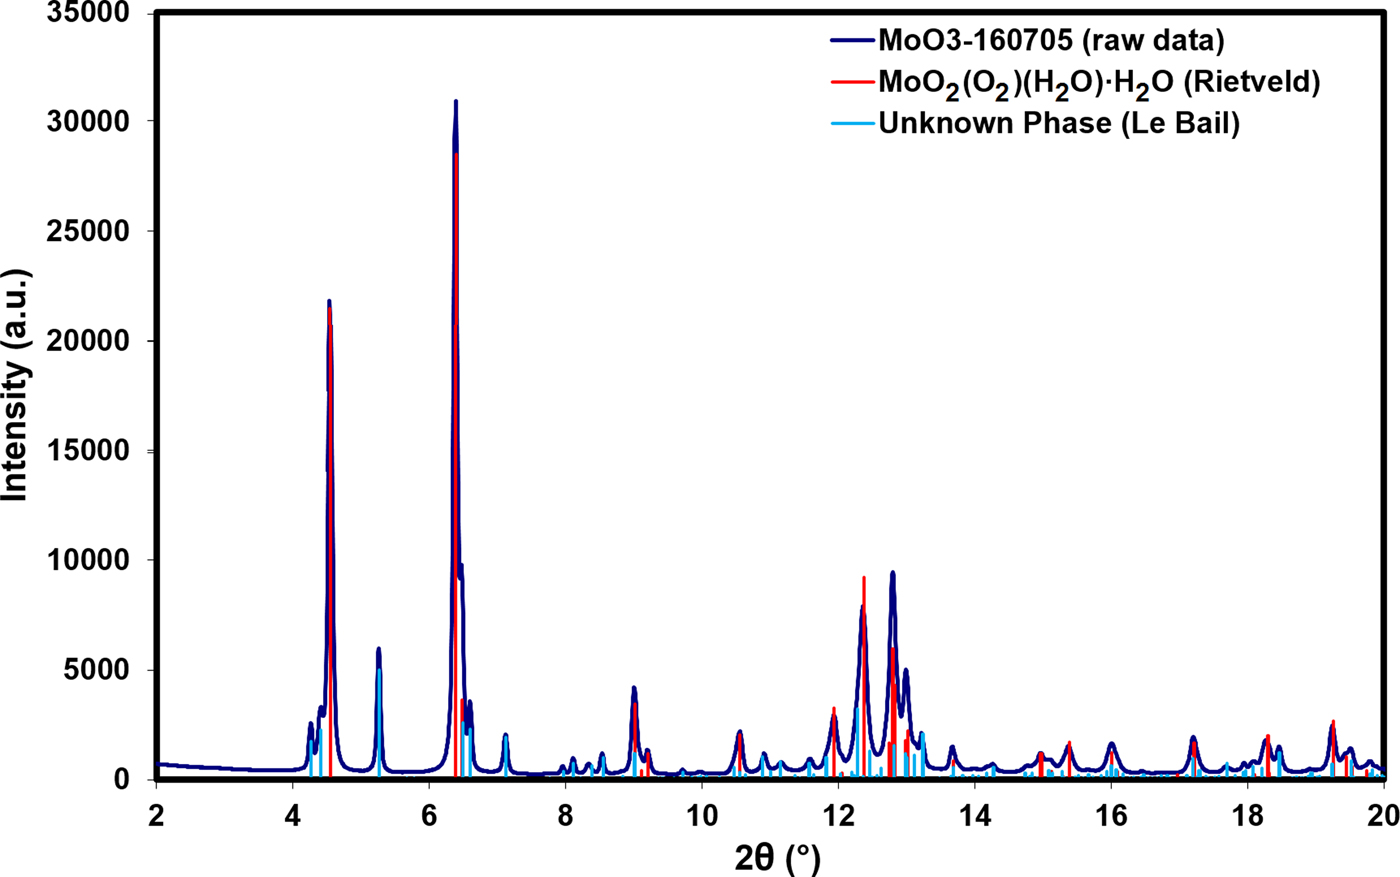
Search/match phase identification performed with the Powder Diffraction File, PDF-4+ (ICDD, Reference Kabekkodu2016), identified an indexed experimental pattern for H2MoO5·H2O [PDF entry 00-041-0060, unit-cell parameters a = 17.156(1) Å, b = 3.8749(3) Å, c = 6.5506(4) Å, β = 90.832(4)°, space group I2/m]. Multiple remaining Bragg reflections could not be identified with search/match phase identification, but could be indexed with a number of unit cells using DICVOL06 (Boultif and Louer, Reference Boultif and Louer2004). After testing these unit cells, a monoclinic cell with lattice parameters a = 10.2187 Å, b = 22.0825 Å, c = 8.9545 Å, and β = 97.500° (M 20 = 9.1, F 20 = 40.4) was used for subsequent Le Bail refinement (Le Bail et al., Reference Le Bail, Duroy and Fourquet1988) for this unknown phase. Figure 1 illustrates the low-angle Bragg reflections for both the main MoO2(O2)(H2O)·H2O phase and the unknown monoclinic impurity phase.

Figure 1. (Color online) A plot of the raw data for the sample vs. the Bragg reflections for the MoO2(O2)(H2O)·H2O phase obtained from Rietveld refinement and the unknown phase obtained from Le Bail refinement.
A reduced cell search of the PDF using the cell for the main H2MoO5·H2O phase identified a hydrated tungsten peroxide, WO2(O2)(H2O)2.66 [unit-cell parameters a = 12.4110(7) Å, b = 3.8717(3) Å, c = 10.1405(6) Å, β = 117.553(3)°, space group C2/m], as a potentially analogous structure (PDF entry 04-011-4401, Pecquenard et al., Reference Pecquenard, Castro-Garcia, Livage, Zavalij, Whittingham and Thouvenot1998). However, preliminary Rietveld refinements based on this model were unsuccessful and the structure was ultimately solved using parallel tempering with the FOX software package (Favre-Nicolin and Černý, Reference Favre-Nicolin and Černý2002) using the unit-cell and space group setting from PDF entry 00-041-0060. Roughly 30 sets of parallel tempering with 2 × 10⁶ trials/set resulted in multiple comparable solutions with cost functions of ~50 000, reflecting the presence of unaccounted for Bragg reflections from the impurity phase.
Rietveld refinements of the crystal structure were performed with both the GSAS/EXPGUI programs (Toby, Reference Toby2001; Larson and Von Dreele, Reference Larson and Von Dreele2004) and FullProf (Rodriguez-Carvajal, Reference Rodriguez-Carvajal2001); the results described here were obtained with GSAS/EXPGUI using the pseudo-Voigt reflection profile of Thompson et al. (Reference Thompson, Cox and Hastings1987). Anomalous scattering factors were interpolated from the tables of Sasaki (Reference Sasaki1989). The background was modeled using a nine-term Chebyshev polynomial. Positional parameters were refined with no restraints for the Mo and O atoms, while isotropic displacement parameters were refined for the Mo and constrained as equal for all the O atoms.
The crystal data, data collection, and refinement details are summarized in Table I.
Table I. The crystal data, data collection, and refinement parameters obtained for MoO2(O2)(H2O)·H2O.
Two density functional geometry optimizations (using a fixed experimental unit cell) were carried out using CRYSTAL14 (Dovesi et al., Reference Dovesi, Orlando, Erba, Zicovich-Wilson, Civalleri, Casassa, Maschio, Ferrabone, De La Pierre, D'Arco, Noel, Causa, Rerat and Kirtman2014), with the hydrogen (H7) for the molybdate coordinated water placed at either O2 or O4 (denoted DFT-O2 and DFT-O4, respectively). The basis sets were obtained from the literature for the H and O (Gatti et al., Reference Gatti, Saunders and Roetti1994) and Mo atoms (Cora et al., Reference Cora, Patel, Harrison, Roetti and Catlow1997). The calculation was run on eight 2.1 GHz Xeon cores (each with 6 Gb RAM) of a 304-core Dell Linux cluster at the Illinois Institute of Technology (IIT), used 8 k-points and the B3LYP functional.
III. RESULTS AND DISCUSSION
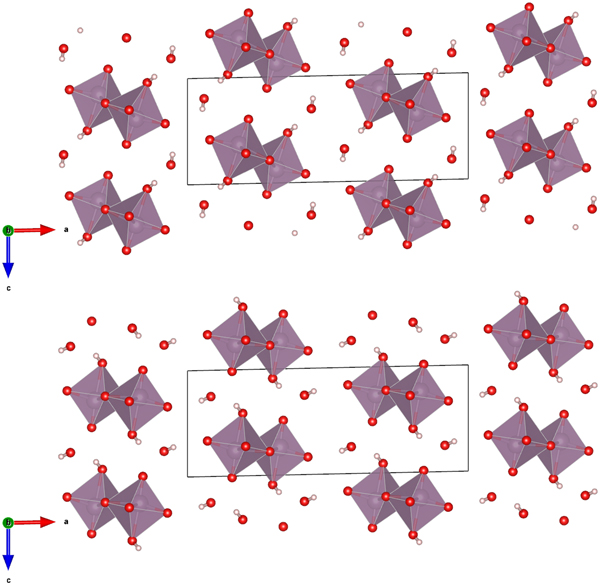
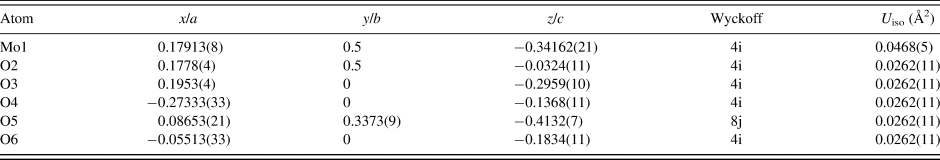
The Rietveld refined atomic coordinates obtained with GSAS for MoO2(O2)(H2O)·H2O are given in Table II, while density functional theory (DFT) optimized atomic coordinates are given in Table III for two models with molybdate coordinated water molecules at either O2 or O4 (DFT-O2 and DFT-O4, respectively). The DFT optimized models are illustrated for comparison along the b-axis and c-axis in Figures 2 and 3, respectively. The root-mean square (RMS) Cartesian displacement between the two DFT models for the heavy (non-hydrogen) atoms is 0.0125 Å, and the structures differ in energy by 0.06 kcal mol−1, making them essentially indistinguishable except for the placement of H7 associated with the molybdate coordinated water molecule.
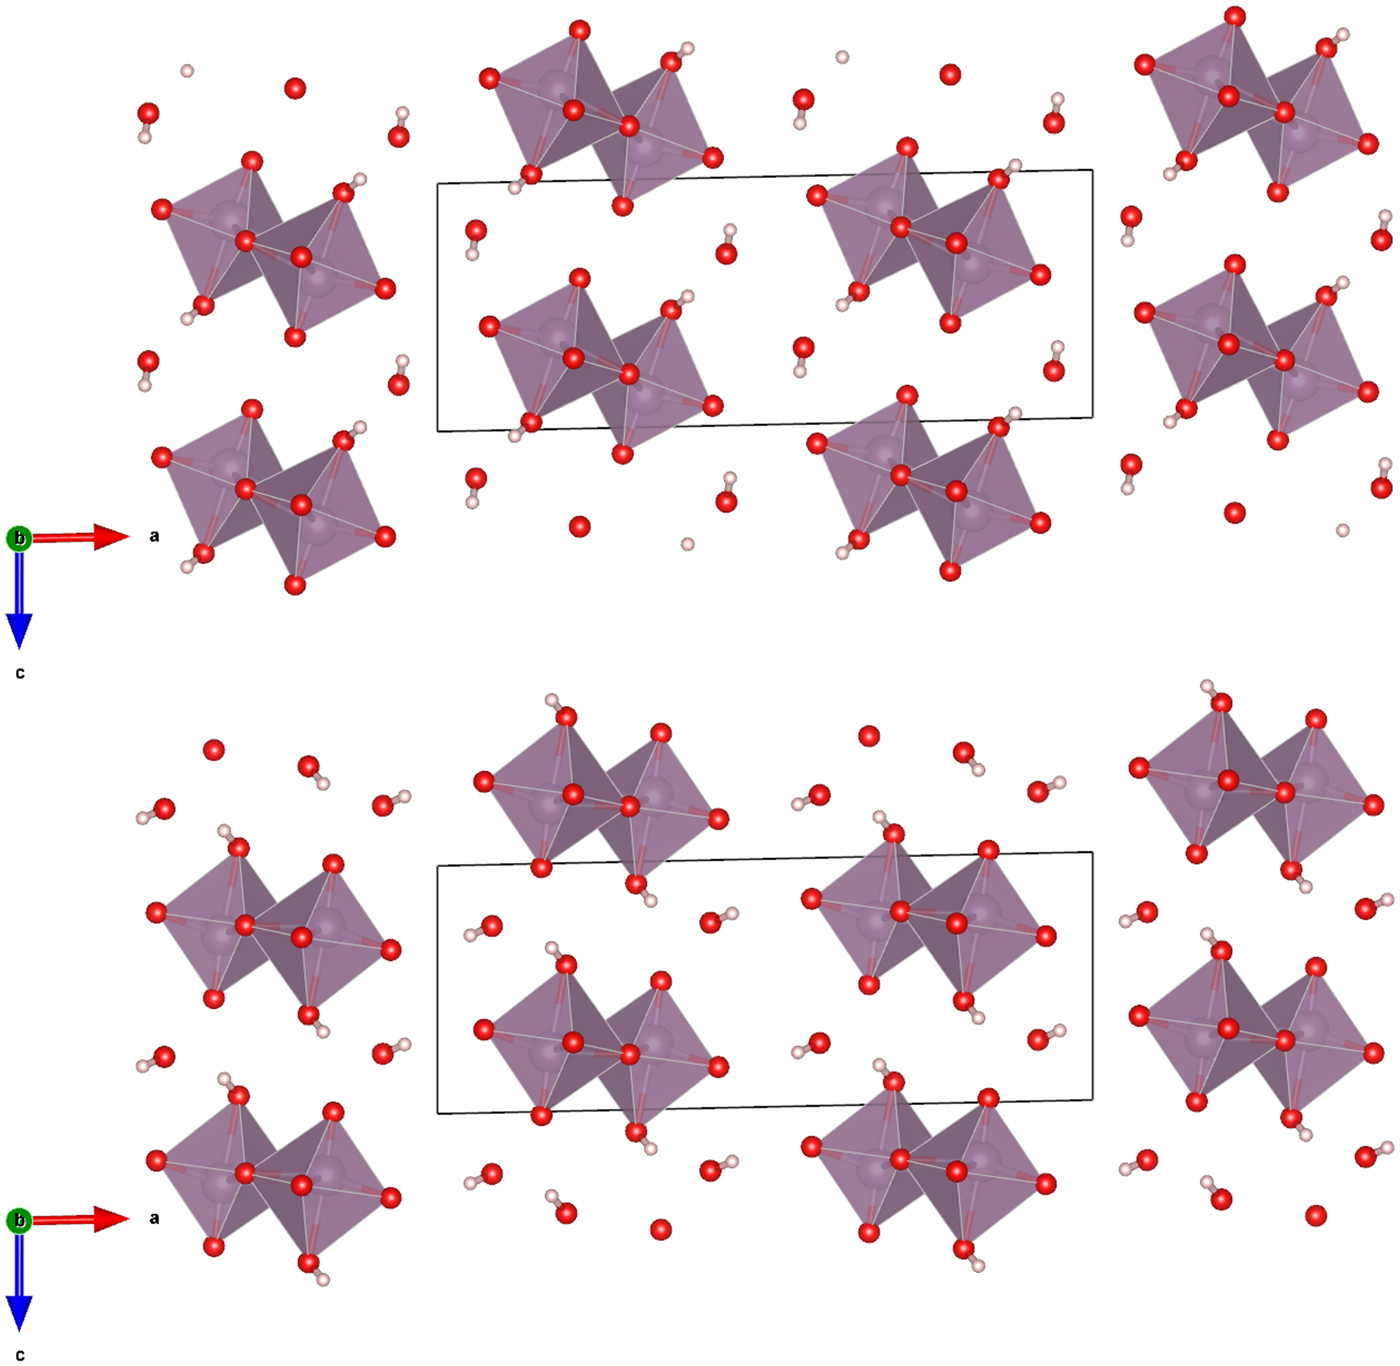
Figure 2. (Color online) The DFT optimized crystal structures of MoO2(O2)(H2O)·H2O, viewed along the b-axis with water hydrogen atoms associated with O2 (top) and O4 (bottom). The polyhedra and atom types can be identified by color including MoO6 (purple octahedra), hydrogen (pink), and O (red). The unit cell is outlined in black. The figure was prepared with VESTA (Momma and Izumi, Reference Momma and Izumi2011).
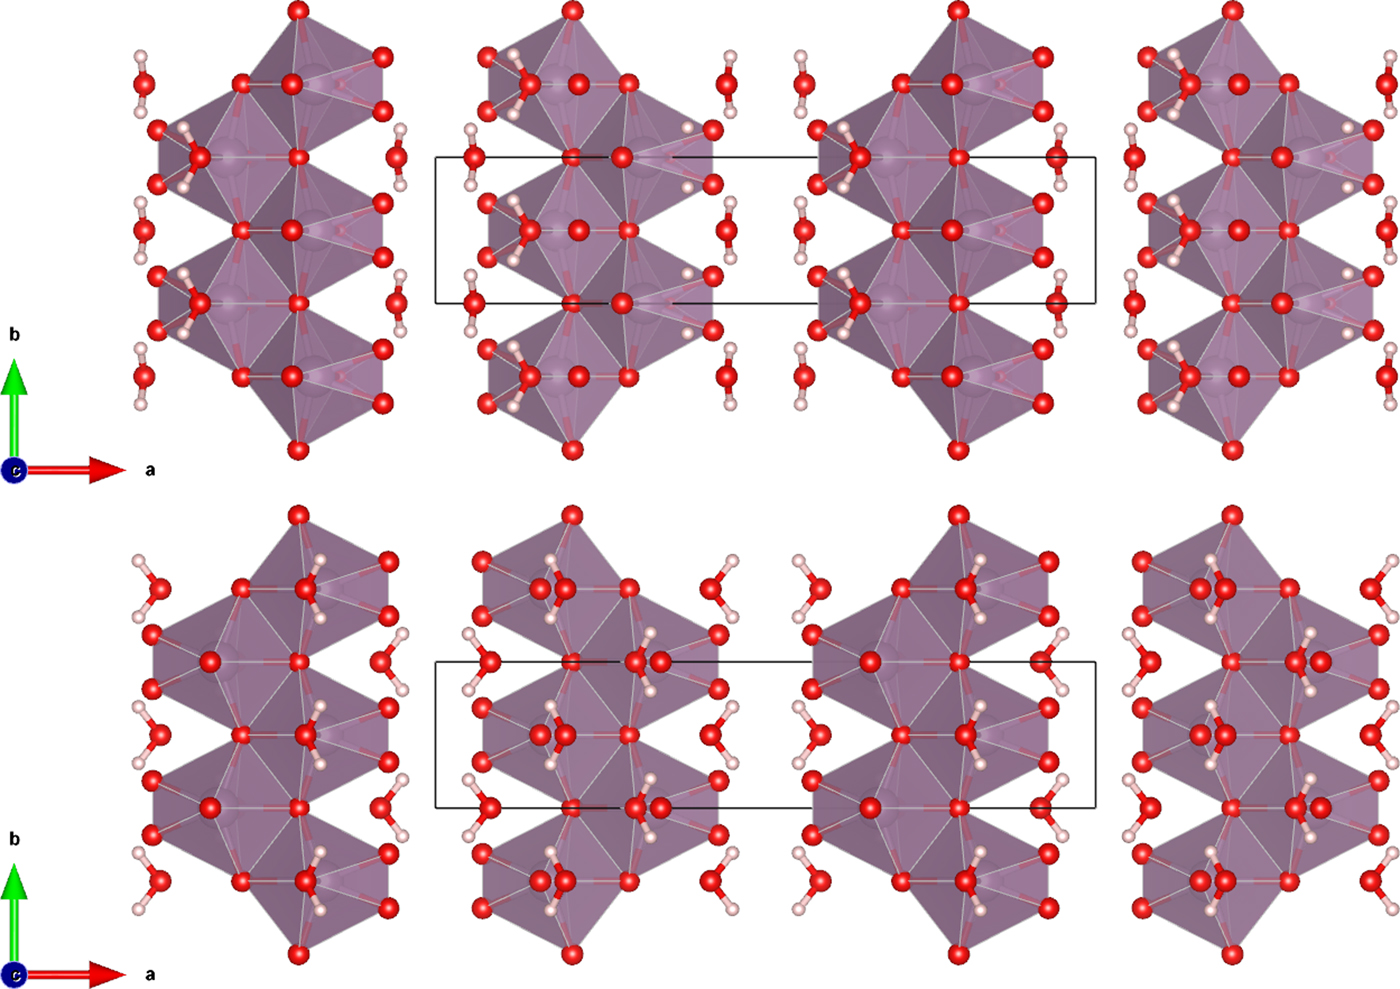
Figure 3. (Color online) The DFT optimized crystal structures of MoO2(O2)(H2O)·H2O, viewed along the c-axis with water hydrogen atoms associated with O2 (top) and O4 (bottom). The polyhedra and atom types can be identified by color including MoO6 (purple octahedra), hydrogen (pink), and O (red). The unit cell is outlined in black. The figure was prepared with VESTA (Momma and Izumi, Reference Momma and Izumi2011).
Table II. The Rietveld refined crystal structure of MoO2(O2)(H2O)·H2O with lattice parameters a = 17.3355(5) Å, b = 3.83342(10) Å, c = 6.55760(18) Å, and β = 91.2114(27)°.
All atoms were refined with fixed site occupancies of 1.
Table III. The DFT optimized crystal structures of MoO2(O2)(H2O)·H2O with fixed lattice parameters a = 17.3362 Å, b = 3.8336 Å, c = 6.5580 Å, and β = 91.2132°.

The structures differ by the placement of H7 with a water molecule on either the O2 or O4 sites (DFT-O2 and DFT-O4, respectively).
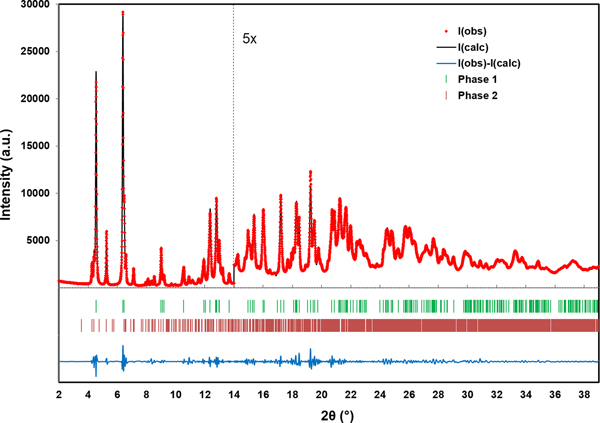
The RMS Cartesian displacement between the Rietveld refined atomic coordinates and the two DFT models are 0.2437 and 0.2446 Å, respectively (for DFT-O2 and DFT-O4). The RMS differences are higher than those obtained for previous molybdate structures refined using comparable data acquisition (Reid et al., Reference Reid, Kaduk and Olson2017, Reference Reid, Kaduk and Matei2018). This probably reflects increased uncertainty in the correct Bragg intensities for the main phase because of the use of Le Bail refinement for the unknown impurity phase observed in the current data. The final Rietveld refinement is illustrated in Figure 4. While the monoclinic unit cell used for the Le Bail refinement of the impurity phase was the optimal cell of five unit cells which were tested, it may not be the correct cell, and the chemistry of the impurity phase remains unknown. An offset plot comparing the observed pattern to the calculated patterns for both phases is illustrated in Figure 5.

Figure 4. (Color online) A plot illustrating the final Rietveld refinement of MoO2(O2)(H2O)·H2O (phase 1) obtained with GSAS. Phase 2 refers to the unknown monoclinic phase refined with Le Bail refinement. The data are magnified by a factor of 5 for the region above 14° (2θ).
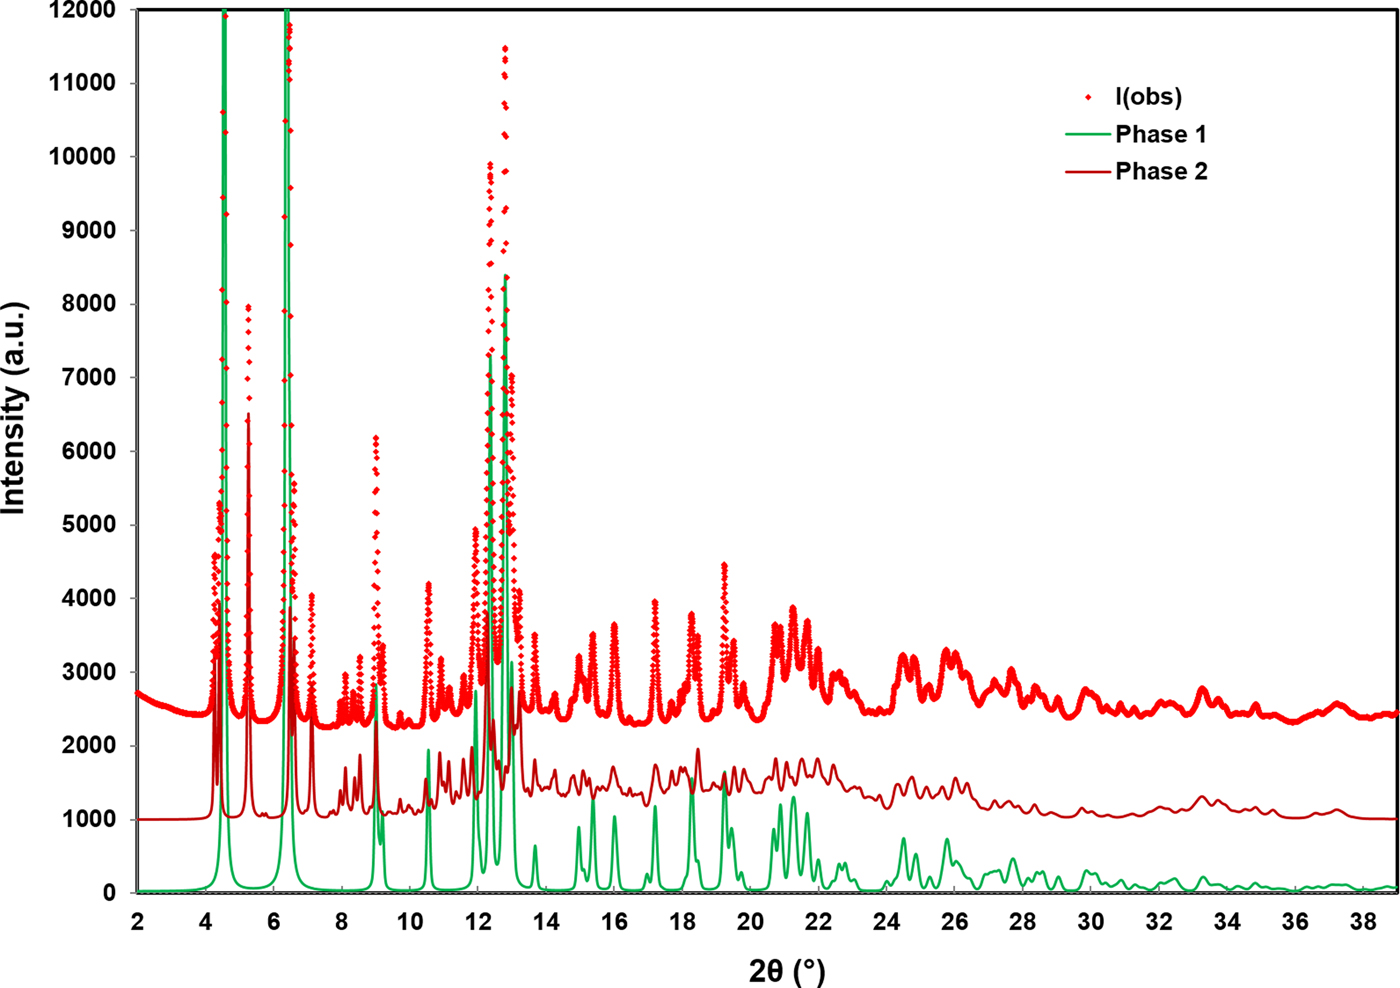
Figure 5. (Color online) An offset plot comparing the observed data to the Rietveld refined pattern of MoO2(O2)(H2O)·H2O (phase 1) and the Le Bail refined pattern for the unknown monoclinic phase (phase 2).
Similar to the previously characterized MoO2(O2)H2O structure (Reid et al., Reference Reid, Kaduk and Matei2018), this structure is characterized by double zigzag molybdate chains running parallel to the b-axis. The additional water molecule between molybdate chains in the current compound results in a less densely packed structure compared with MoO2(O2)H2O (the calculated densities are 2.988 and 3.511 g cm−3, respectively). The bond valence sum (Brown, Reference Brown2002) for Mo1 in the Rietveld refined structure is 6.181(28), while the Mo-O bond lengths are shown for both the Rietveld and DFT optimized structures in Table IV. The Mo1-O2 and Mo1-O4 bond lengths for the Rietveld refined model fall between the values for the two DFT optimized models, likely suggesting that the molybdate coordinated water molecules are disordered over the O2 and O4 sites. Attempts were made to refine the structure starting from the DFT optimized models with the molybdate coordinated water molecule situated on (1) O2, (2) O4, and (3) split between the two sites, but the results were ultimately inconclusive.
Table IV. The Mo-O bond lengths obtained from the Rietveld refinement and DFT optimized structures.
The hydrogen bonds observed in the two DFT optimized structures are summarized in Table V. The hydrogen bond energies were calculated from the overlap populations using the correlation function of Rammohan and Kaduk (Reference Rammohan and Kaduk2018). Both water hydrogens participate in discrete hydrogen bonds, with graph sets D1,1(2).
Table V. Hydrogen bonds observed in the MoO2(O2)(H2O)·H2O DFT optimized structures and their parameters as determined by the DFT modeling.
A Bragg reflection list was prepared by summing reflections closer than 0.02° 2θ as multiple reflections and assigning a weighted average reflection position, then including all reflections with relative integrated intensities of 0.5% or greater up to 39° 2θ. The Bragg reflection list and raw data are contained in a crystallographic information file (CIF) in the online Supplementary material, along with individual CIF files for the Rietveld refined and DFT optimized structures.
SUPPLEMENTARY MATERIAL
The supplementary material for this article can be found at https://doi.org/10.1017/S0885715619000095.
ACKNOWLEDGEMENTS
The authors thank Andrey Rogachev for the use of the computing resources at the Illinois Institute of Technology. Research described in this paper was performed using beamline 08B1-1 at the Canadian Light Source, which is supported by the Canadian Foundation for Innovation, the Natural Sciences and Engineering Research Council of Canada, the National Research Council Canada, the Canadian Institutes of Health Research, the Government of Saskatchewan, Western Economic Diversification Canada, and the University of Saskatchewan.