


I. INTRODUCTION
New production routes for 99Mo and daughter isotope technetium-99 m (99mTc), the most widely used radioisotope for medical imaging (Banerjee et al., Reference Banerjee, Pillai and Ramamoorthy2001), are being developed to eliminate the need for expensive nuclear reactors requiring highly enriched uranium and the associated security and nuclear waste concerns (Van Noorden, Reference Van Noorden2013; Wolterbeek et al., Reference Wolterbeek, Kloosterman, Lathouwers, Rohde, Winkelman, Frima and Wols2014). Emerging methods such as linear accelerator (LINAC) and other accelerator-based production of 99Mo (Galea et al., Reference Galea, Ross and Wells2014; Hoedl and Updegraff, Reference Hoedl and Updegraff2015) require complementary chemical processes for isotope separation and molybdenum recycling to make these alternative production routes viable (McAlister and Horwitz, Reference McAlister and Horwitz2009; Chattopadhyay et al., Reference Chattopadhyay, Das and Barua2010; Tkac and Vandergrift, Reference Tkac and Vandergrift2016). During the development of target processing and Mo chemical recycling processes, unknown or poorly characterized compounds are sometimes encountered because of the diverse crystal chemistry of molybdenum (Reid et al., Reference Reid, Kaduk and Olson2017). The compound examined in this work was observed during the development of target processing studies for LINAC-based isotope production.
II. EXPERIMENTAL
A specimen of molybdenum processing powder supplied by the Canadian Isotope Innovation Corp. was examined as-synthesized. The specimen was mounted in a 0.3 mm ID Kapton capillary, which was sealed at both ends with adhesive.
Powder X-ray diffraction (PXRD) patterns were collected using a Canadian Macromolecular Crystallography Facility beamline (08B1-1, Fodje et al., Reference Fodje, Grochulski, Janzen, Labiuk, Gorin and Berg2014) at the Canadian Light Source (CLS). The 08B1-1 is a bending magnet beamline with a Si (111) double crystal monochromator. Two-dimensional (2D) data were obtained using a Rayonix MX300HE detector with an active area of 300 mm × 300 mm. The patterns were collected at an energy of 18 keV (λ = 0.68880 Å) and a sample-detector distance of 250 mm.
The 2D PXRD patterns were calibrated and integrated using the GSASII software package (Toby and Von Dreele, Reference Toby and Von Dreele2013). The sample-detector distance, detector centering, and tilt were calibrated using a lanthanum hexaboride (LaB6) standard reference material (NIST SRM 660a LaB6) and the calibration parameters were applied to all patterns. After calibration, the 2D patterns were integrated to obtain standard powder diffraction patterns. A pattern collected from an empty Kapton capillary (using the same conditions) was subtracted from the sample data during integration.
Initial search/match phase identification performed with the Powder Diffraction File, PDF-4+ (ICDD, 2016), identified an indexed experimental pattern for H2MoO5 (PDF entry 00-041-0359). Subsequent reduced cell searches of the Inorganic Crystal Structure Database (Hellenbrandt, Reference Hellenbrandt2004) and the PDF identified a hydrated tungsten peroxide, WO2(O2)H2O [unit cell parameters a = 12.0710(8) Å, b = 3.8643(2) Å, c = 12.6568(9) Å, β = 145.470(3)°, space group P21/c], as a potentially analogous structure (ICSD entry 85609, PDF entry 04-011-4400, Pecquenard et al., Reference Pecquenard, Castro-Garcia, Livage, Zavalij, Whittingham and Thouvenot1998). The unit cell and structure were transformed from the P21/c setting to the P21/n setting with an acute β angle for the final Rietveld refinement and DFT optimization.
Rietveld refinement of the crystal structure was performed with the GSAS/EXPGUI programs (Toby, Reference Toby2001; Larson and Von Dreele, Reference Larson and Von Dreele2004). The pseudo-Voigt reflection profile of Thompson et al. (Reference Thompson, Cox and Hastings1987) was used, including the asymmetry correction of Finger et al. (Reference Finger, Cox and Jephcoat1994) and the microstrain broadening model of Stephens (Reference Stephens1999). Anomalous scattering factors were interpolated from the tables of Sasaki (Reference Sasaki1989) and input into GSAS. The background was modeled using a three-term Chebyshev polynomial and a nine-term diffuse scattering (Debye) function. Positional parameters were refined with no restraints for the Mo and O atoms, while isotropic displacement parameters were refined for the Mo and constrained as equal for all the O atoms. The positions of the H atoms for the water molecule were added late in the refinement based on the results of the DFT calculation, with the isotropic displacement parameter of the H atoms constrained to 1.3 times the value of the O atom. A sixth order spherical harmonic preferred orientation correction (von Dreele, Reference Von Dreele1997) was refined, yielding a texture index of 1.0232, suggesting limited preferred orientation.
The crystal data, data collection and refinement details are summarized in Table I.
Table I. The crystal data, data collection, and refinement parameters obtained for MoO2(O2)(H2O).
A density functional geometry optimization (using fixed experimental unit cell) was carried out using CRYSTAL14 (Dovesi et al., Reference Dovesi, Orlando, Erba, Zicovich-Wilson, Civalleri, Casassa, Maschio, Ferrabone, De La Pierre, D'Arco, Noel, Causa, Rerat and Kirtman2014). The basis sets were obtained from the literature for the H and O (Gatti et al., Reference Gatti, Saunders and Roetti1994) and Mo atoms (Cora et al., Reference Cora, Patel, Harrison, Roetti and Catlow1997). The calculation was run on eight 2.1 GHz Xeon cores (each with 6 Gb RAM) of a 304-core Dell Linux cluster at the Illinois Institute of Technology (IIT), used 8 k-points and the B3LYP functional, and took less than 1 day.
III. RESULTS AND DISCUSSION
Figure 1 illustrates the DFT optimized structure from two views along the c-axis and the b-axis, while the Rietveld refined and DFT optimized atomic coordinates are given in Tables II and III, respectively. The final Rietveld refinement, yielding a reduced χ 2 value of 2.47, is illustrated in Figure 2. The root-mean-square Cartesian displacement between the Rietveld refined and DFT optimized structures for the heavy (non-hydrogen) atoms is 0.1330 Å, well within a reasonable range for correct crystal structures. The largest peak and hole in the difference Fourier map were 0.513 e Å−3 (at two locations; 0.49 Å from Mo1 and 1.15 Å from O3) and −0.480 e Å−3 (between adjacent molybdate chains, 1.77 Å from O2) respectively.

Figure 1. (Colour online) The crystal structure of MoO2(O2)H2O, viewed along the c-axis (top) and b-axis (bottom). The polyhedra and atom types can be identified by color including MoO6 (purple octahedra), hydrogen (pink), and O (red). The unit cell is outlined in black. The figure was prepared with VESTA (Momma and Izumi, Reference Momma and Izumi2011).
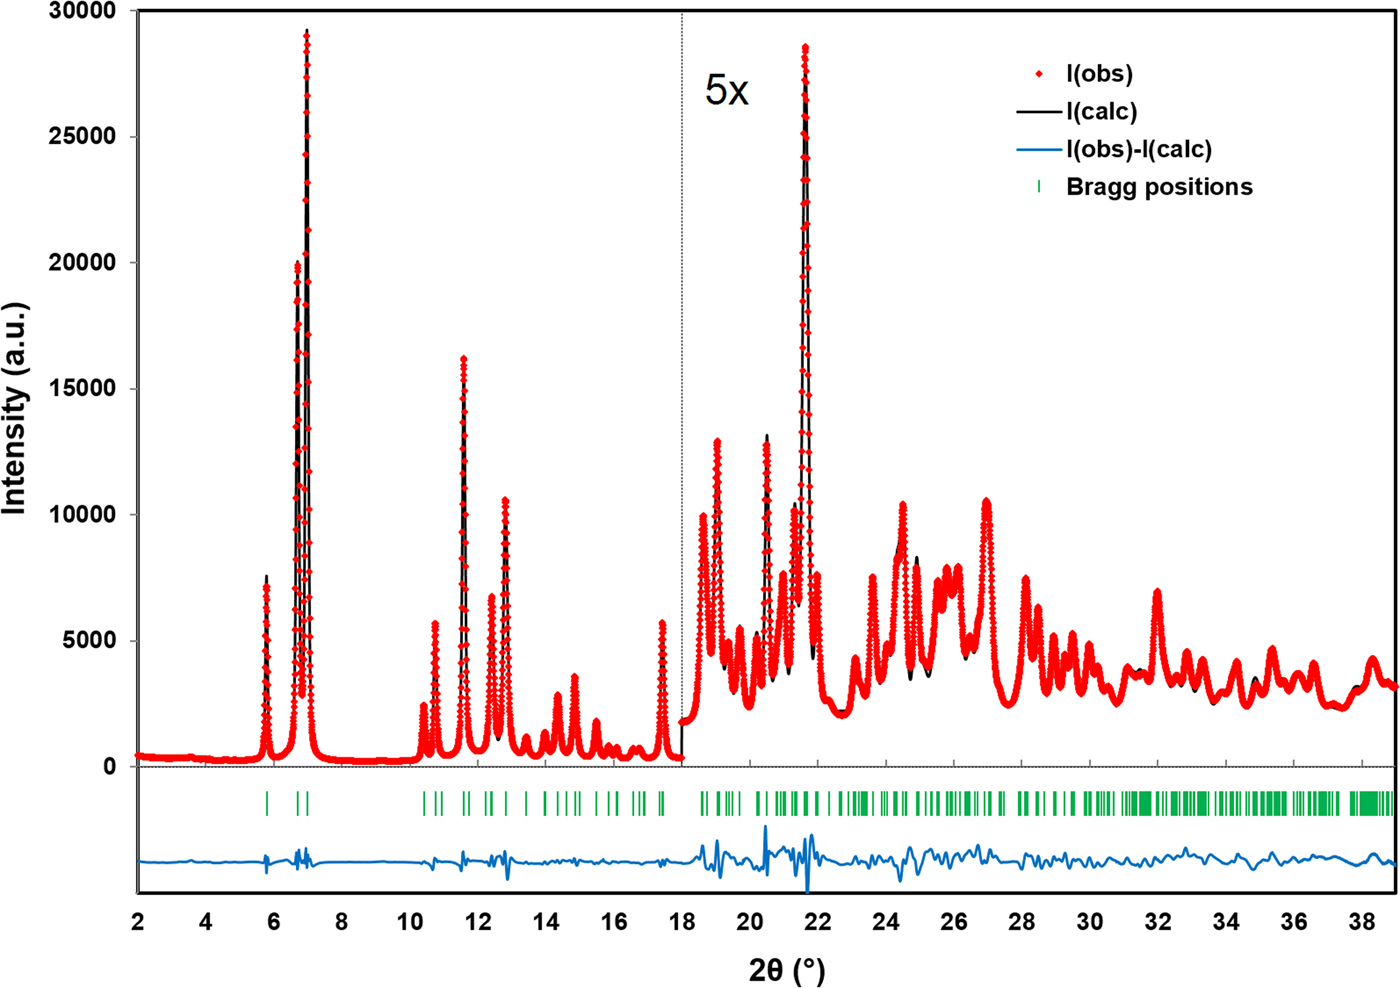
Figure 2. (Colour online) A plot illustrating the final Rietveld refinement of MoO2(O2)H2O obtained with GSAS, zooming in by a factor of 5 for the region above 18° (2θ).
Table II. The Rietveld refined crystal structure of MoO2(O2)H2O with lattice parameters a = 12.0417(4) Å, b = 3.87003(14) Å, c = 7.38390(24) Å, and β = 78.0843(11)°. All atoms were refined with fixed site occupancies of 1.
Table III. The DFT optimized crystal structure of MoO2(O2)H2O with fixed lattice parameters a = 12.0432 Å, b = 3.8699 Å, c = 7.3847 Å, and β = 78.0960°.

The crystal structure is characterized by double zigzag molybdate chains running parallel to the b-axis, where adjacent molybdate octahedra share edges and a corner of each octahedron has been replaced by a peroxo ligand oriented nearly parallel the b-axis. The octahedra are distorted and the Mo–O bond lengths obtained from both the Rietveld refinement and the DFT optimization are given in Table IV. The bond valence sum (Brown, Reference Brown2002) values for Mo1 are 6.057(60) and 5.954 for the Rietveld refined and DFT optimized structures, respectively. Hydrogen bonds based on the DFT optimized structure are shown in Table V. Both hydrogen bonds through H8 connect to a single adjacent molybdate chain with the peroxo ligand oxygen atoms (O4 and O5) as acceptors. One hydrogen bond through H7 connects to a second adjacent molybdate chain (via O2 as an acceptor), while the second bond is within the same chain.
Table IV. Mo–O bond lengths obtained from the Rietveld refinement and DFT calculation.

Table V. Hydrogen bonds observed in the MoO2(O2)H2O structure and their parameters as determined by the DFT modeling.
A Bragg reflection list, shown in Table VI, was prepared by summing reflections closer than 0.02° (2θ) as multiple reflections and assigning a weighted average reflection position, then including all reflections with relative integrated intensities of 0.5% or greater up to 35° (2θ). The Bragg reflection list and raw data are contained in a crystallographic information file (CIF) in the online Supplementary material. Individual CIF files containing the Rietveld refined and DFT calculated structures are also included as Supplementary material.
Table VI. The Bragg reflection list obtained from the final Rietveld refinement, prepared by summing reflections closer than 0.02° 2θ as multiple reflections and assigning a weighted average reflection position, then including all reflections with relative integrated intensities of 0.5% or greater up to 35° 2θ.

SUPPLEMENTARY MATERIAL
The supplementary material for this article can be found at https://doi.org/10.1017/S0885715618000118
ACKNOWLEDGEMENTS
The authors thank Andrey Rogachev for the use of the computing resources at the Illinois Institute of Technology. Research described in this paper was performed using beamline 08B1-1 at the Canadian Light Source, which is supported by the Canadian Foundation for Innovation, the Natural Sciences and Engineering Research Council of Canada, the National Research Council Canada, the Canadian Institutes of Health Research, the Government of Saskatchewan, Western Economic Diversification Canada, and the University of Saskatchewan.


